1467
Liver Biopsy Analysis to Determine Fat Droplet Distribution1Biomedical Engineering, University of Wisconsin, Madison, Madison, WI, United States, 2Radiology, University of Wisconsin, Madison, Madison, WI, United States, 3Medical Physics, University of Wisconsin, Madison, Madison, United States, 4School of Automation Engineering, University of Electronic Science and Technology of China, Chengdu, People's Republic of China, 5School of Biomedical Engineering and Guangdong Provincial Key Laboratory of Medical Image Processing, Southern Medical University, Guangzhou, People's Republic of China, 6Pathology, University of Wisconsin, Madison, Madison, United States, 7Radiology, University of California, San Diego, San Diego, United States, 8Medicine, University of Wisconsin, Madison, Madison, United States, 9Emergency Medicine, University of Wisconsin, Madison, Madison, United States
Synopsis
The purpose of this work was to quantify the size and clustering of fat droplets using liver biopsy, as part of a long-term effort to characterize the relationship between tissue microstructure and quantitative MRI signals in fat-containing tissue. Three H&E stained liver core biopsies with varying fat-fractions were analyzed using segmentation software in order to generate probability density functions for fat droplet size and location. This work demonstrates that fat droplet distribution in the liver can be modeled statistically to determine the size and location distribution of fat droplets, potentially enabling characterization of the MR signal observed from fatty liver.
Introduction
Biophysical modeling of the physical interactions in tissue microstructure is a powerful tool to understand unexplained MR signal behavior. One such phenomenon is a positive correlation between liver proton density fat fraction (PDFF) and R2* in the absence of iron overload1. One possible explanation for this observation is the microscopic field inhomogeneity caused by the magnetic susceptibility difference between fat droplets and water leads to increasing R2* at higher PDFF. Biophysical modeling2 can be used to validate this hypothesis. However, biophysical modeling relies on accurate models of tissue including the size and distribution (clustering) of hepatic fat droplets. The purpose of this work was to quantify size and clustering of fat droplets within hepatocytes using liver biopsy.Methods
This study was IRB approved and HIPAA compliant. Subjects scheduled to undergo bariatric weight loss surgery (WLS), with a high pretest probability of nonalcoholic fatty liver disease (NAFLD), were recruited from two bariatric centers. Subjects underwent biopsy from the left lobe of the liver at the time of weight loss surgery.
A total of 3 H&E stained core liver biopsies were chosen randomly from patients with low (n=1), medium (n=1), and high (n=1) fat content. Each core liver biopsy was segmented into six areas of interest for analysis.
High-resolution digitized histological slides were processed to determine the steatosis area-fraction along with the fat droplet distribution (coordinates of the droplet center, as well as diameter of each droplet) from the biopsy specimens. Semi-automated threshold macro segmentation of the fat droplets to determine these distributions was determined using Image Pro Plus 7.0 software (Media Cybernetics, Inc., Rockville, MD). Further, the coordinates of the central veins were determined manually using the same software.
The coordinate and diameter data collected from the digitized slides was imported into Matlab2014b (The MathWorks, Inc., Natick, MA). For each segment of every histology slide, histograms of the droplet size, nearest neighbor distance, and distance to the central vein were generated and fit to both gamma and exponential density functions. The Gamma distribution function3 is given by,
$$GDF(x)=\frac{1}{\beta+\Gamma(\gamma)}\times\left(\left(\frac{x-\mu^{(\gamma -1)}}{\beta}\right)\times exp\left(-\frac{x-\mu}{\beta}\right)\right)$$
where β > 0 (scale parameter), γ > 0 (shape parameter), x ≥ μ (location parameter) and Γ(γ) is the function given by,
$$\Gamma(z)=\int_{0}^{\infty }{t^{z-1}e^{-t}dt}$$
Alternatively, the exponential density function is given by,
$$PDF(x)=\lambda e^{-\lambda x}$$
where 1/λ is the events per unit time is both the mean and standard deviation of the distribution.
Using these two probability density functions along with a Monte Carlo simulation, 3D versions of the liver can be generated, to facilitate Bloch equation simulations to predict MR signal characteristics in fatty liver (Figure 5).
Results
Fat Droplet Size Distribution: Density function analysis determined that the best fit the fat droplet size distribution based on the diameter is provided by the gamma distribution (Figure 2). Droplet size distribution over a range of fat concentrations was not significant between the three subjects. The fitting results for droplet size to the gamma distribution were as follows: βlarge=1.43±0.3; γlarge=7.02±0.76, βmedium=1.65±0.5; γmedium=5.14±1.3, βsmall=1.41±0.18, γsmall=5.48±0.72.
Fat Droplet Location: Fat droplet location distribution was split into distance to nearest neighbor fat droplet and distance to nearest central vein. An exponential distribution fit was determined to provide the best fit for the nearest neighbor distribution (Figure 3), while the gamma distribution fit was determined to provide the best fit for the central vein distribution (Figure 4). The nearest neighbor distribution showed that with a decrease in fat fraction, the average distance to the nearest neighbor is higher due to an increase in the λ parameter from the exponential fit, with the following fitting results: λlarge=8.25±0.9; λmedium=18.17±2.8; λsmall=24.8±3.6.
The central vein distributions also showed that as the fat fraction decreases, the fat droplets tend to clump less, with the following fits to the gamma distribution function: βlarge=3.76±0.24; γlarge=88.6±18.3, βmedium=2.09±0.34; γmedium=184.9±63.6, βsmall=1.89±0.16, γsmall=300.9±129.6.
Discussion/Conclusions
In this work we have characterized fat droplet size and clustering in patients with hepatic steatosis and provided estimates of their probability density function. Fits of small, medium, and large fat fractions showed substantial differences implying that the appropriate density function is dependent on the fat fraction. Using such distributions, advanced biophysical modeling can be performed to predict the signal behavior from tissues with complex tissue microstructure and pathology such as hepatic steatosis.Acknowledgements
We acknowledge the support of NIH (UL1TR00427, R01 DK083380, R01 DK088925, R01 DK100651, K24 DK102595).References
1. Hernando D, Haufe WM, Hooker CA, et al. Relationship between liver proton density fat fraction and R2* in the absence of iron overload. In Proceedings of the 23nd Annual Meeting of ISMRM, Toronto, Canada, 2015. Abstract 4118.
2. Ghugre NR, Gonzalez-Gomez I, Shimada H, et al. Quantitative analysis and modelling of hepatic iron stores using stereology and spatial statistics. Journal of Microscopy 2010; 238(3): 265-274.
3. Beyer, WH. CRC Standard Mathematical Tables. CRC Press, Boca Raton, FL, 1987.
Figures
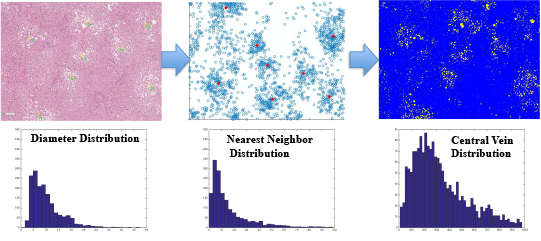
Figure 1: Methods of Analyzing Biopsy
The images below show the methodologies used to generate the probability density functions for size and location. The process begins with the digitized biopsy slide. A semi-automated threshold macro is used to generate a segmented biopsy. Data is gathered using Image Pro Plus 7.0, and a Matlab generated biopsy is created. From here, the size histogram along with the nearest neighbor histogram and central vein histogram are generated.
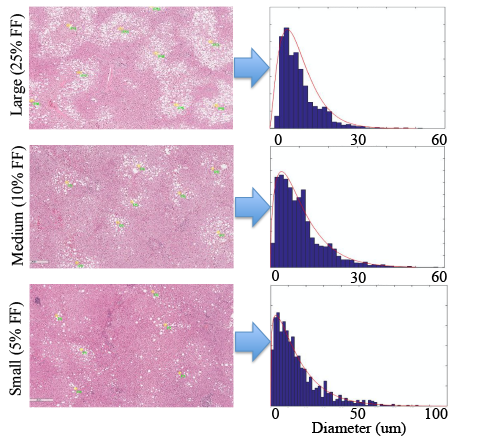
Figure 2: Particle Size Analysis
The images below show the gamma distribution functions for one case in each fat fraction range. It was determined that there was a insignificant difference in the probability distribution functions between the three fat fraction cases.
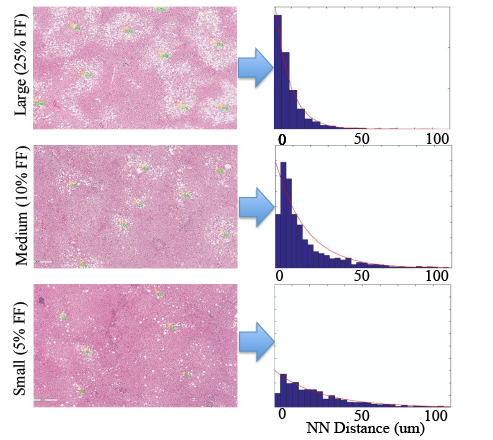
Figure 3: Nearest Neighbor (NN) Analysis
The images below show the exponential distribution functions for the nearest neighbor distribution for one case in each fat fraction range. It was determined that there was a significant difference in the probability distribution functions between the three fat fraction cases, which means that the location density functions change with respect to the fat fraction.
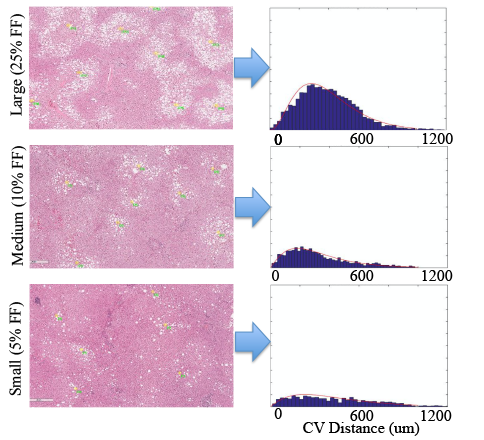
Figure 4: Central Vein (CV) Distance Analysis
The images below show the gamma distribution functions for the central vein distribution for one case in each fat fraction range. It was determined that there was a significant difference in the probability distribution functions between the three fat fraction cases, which means that the location density functions change with respect to the fat fraction.
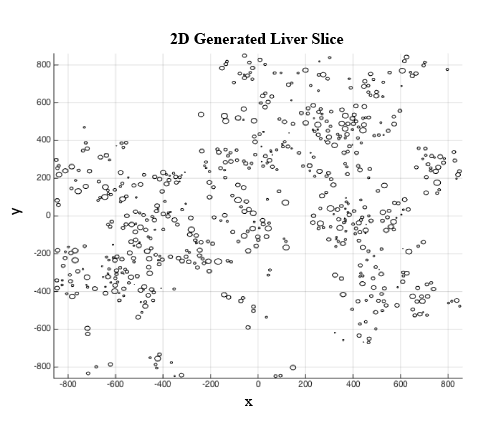
Figure 5: 2D Generated Liver Slice
The image below shows a 2D generated liver slice based on the fat droplet size and nearest neighbor location distributions. This liver slice is only a portion of the larger 3D generated case, which also follows the same distributions.