1466
Analysis of error in Fat-Water Quantifications Originated from Models1Clinical Science, Philips Healthcare, Beijing, People's Republic of China, 2Department of Radiology, Beijing Jishuitan Hospital, 3Department of Radiology, Beijing Shijingshan Hospital
Synopsis
Fat-water separation imaging methods with multi-echo acquisition require specific fat spectrum model. The optimal spectrum model to be applied relies on the fat chemical properties as well as the acquisition scheme regarding to, for example, TR and TE. Herein we exam the consequence if inaccurate fat spectrum is used in the fat quantification processing, and analyze the related errors.
Introduction
Several fat-water separation methods[1,2,3], including mDIXON quant, utilizing multiple gradient echo sequence, are based on signal modeling incorporating water-fat contents and corresponding Larmor frequency difference[2]. The intrinsic issue regarding to the fat spectrum modeling accuracy raised the question of fat quantification accuracy as well as its reproducibility. Currently these methods have been recognized and approved for liver fat quantification application, however, the studies in measuring fat fraction in another anatomies are already going on, such as lumbar vertebrae marrow[7]. Major MRI vendors are using their own tables in modeling fat MR spectrum, which have some difference and would lead to difference in cross comparison. Most importantly, longer TE (or more echoes in measurement) should lead to a different fat signal behavior, which would result in inaccuracy [4,5] .
Herein we compare the outcomes in calculating fat quantification by these spectrum modeling based methods, and prepare solutions for cross-vendor and cross-anatomy fat quantification studies.
Methods
Synthetic MR Signal (single voxel multiple gradient echo sequence data) was simulated by forward modeling signal contributions from water and fat. The inverse processing, utilizing least square fitting algorithm, calculates the fat fraction and transverse relaxation time T2*. Two MR spectrums were provided (A. the original model used in forward signal simulation; B. another spectrum based on reference [2]); a key difference is that the main fat peak contribution is changed by almost 10% between the two models.
A healthy volunteer went through the liver mDIXON quant scan on 3.0T MR Scanner (Ingenia, Philips Healthcare, Best, Netherlands) with single breath hold settings(12 seconds): TR, 8.8 ms; TE1, 1.11ms; 6echos with delta TE 1.3ms; FOV 400 × 350 × 189 mm, FA=3°, resolution=2.5×2.5×3.0mm. Raw data was saved and utilized for image analyzing based on spectrum model A and also spectrum B.
Results
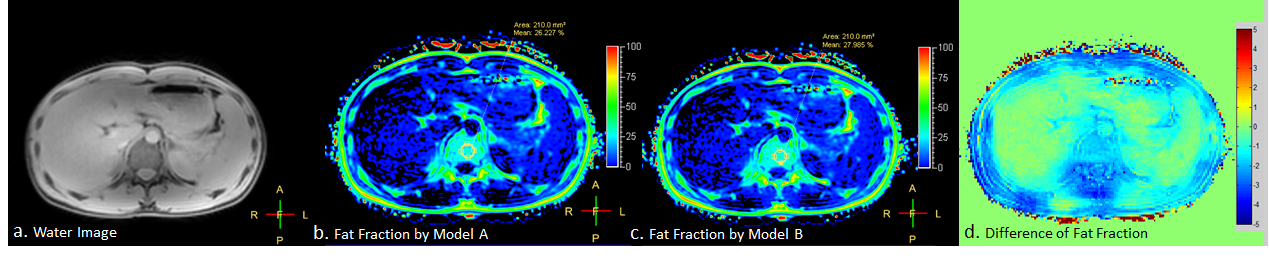
Fat fraction calculated based on model B is overall slightly bigger than model A, as shown in Fig 1.b and 1.c. However, the difference is restricted within 2.5% in both numerical simulation and real data processing (Fig 1.d).
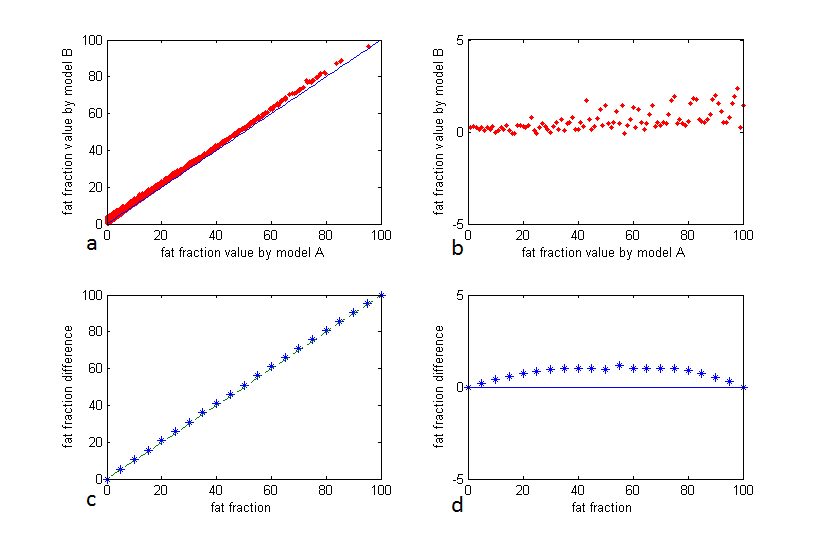
A very good, almost linear, pattern was observed in Fig 2.a and 2.b. by registering each value calculated using model B to the corresponding value using model A. Numerical simulation in Fig 2.c and 2.d also show a pattern that could be used as registration table to correct this small error.
Conclusion and discussion
The results shows that small (2.5%) difference would be observed in using the two different models, while it is smaller when fat fraction is less than 20%. This provides confidence in applying currently justified models in most clinically relevant applications, with the knowledge that fat spectrum is overall similar, in vivo. However, in a very careful study with less than 2% error allowed, the fat fraction results might need to be corrected based on a prior matching table. In the situation that different vendors are used for cross comparison, or liver fat spectrum model are applied in lumbar vertebrae marrow exams [6], this matching table can be either generated by numerical simulation or registering scan results.Acknowledgements
No acknowledgement found.References
[1]. Kukuk, GM. et al., Comparison between modified Dixon MRI techniques, MR spectroscopic relaxometry, and different histologic quantification methods in the assessment of hepatic steatosis. Eur Radiol. 2015 Oct;25(10):2869-79
[2]. Yu H. et al, Multiecho water-fat separation and simultaneous R2* estimation with multifrequency fat spectrum modeling. Magn Reson Med. 2008 Nov;60(5):1122-34.
[3]. Nozaki T, et al. Quantification of Fatty Degeneration Within the Supraspinatus Muscle by Using a 2-Point Dixon Method on 3-T MRI. Ajr American Journal of Roentgenology. 2015; 205(1):116-122.
[4]. Kijowski, R., et al., Improved fat suppression using multipeak reconstruction for DEAL chemical shift fat-water separation: Application with fast spin echo imaging. Journal of Magnetic Resonance Imaging, 2009. 29(2): p. 436-442.
[5]. Tang A. et al., Accuracy of MR imaging-estimated proton density fat fraction for classification of dichotomized histologic steatosis grades in nonalcoholic fatty liver disease. Radiology. 2015 Feb;274(2):416-25
[6]. Ren, J., et al., Composition of adipose tissue and marrow fat in humans by 1H NMR at 7 Tesla. Journal of Lipid Research, 2008. 49(9): p. 2055-2062.
Figures