1463
Assessment of interplatform reproducibility of T1 quantification methods used for DCE-MRI: results from a multicenter phantom study1Translational and Molecular Imaging Institute, Icahn School of Medicine at Mount Sinai, New York, NY, United States, 2Radiology, Groupe Hospitalier Pitié Salpêtrière, Paris, France, 3Institute of Imaging Science, Vanderbilt University Medical Center, Nashville, TN, United States, 4Radiation Oncology, University of Michigan, Ann Arbor, MI, United States, 5Physical Measurement Laboratory, National Institute of Standards and Technology (NIST), Boulder, CO, United States, 6Radiology, University of Michigan, Ann Arbor, MI, United States, 7Radiology, Brigham and Women's Hospital, Boston, MA, United States, 8Advanced Imaging Research Center, Oregon Health & Science University, Portland, OR, United States, 9Radiology, University of California San Francisco Mount Zion Hospital, San Francisco, CA, United States, 10Martinos Center for Biomedical Imaging, Massachusetts General Hospital, Charlestown, MA, United States, 11Biomedical Engineering, University of Texas at Austin, Austin, TX, United States
Synopsis
Our multicenter study examined variability in T1 quantification by testing common inversion-recovery spin echo and variable flip angle (VFA) protocols, as well as T1 mapping methods used by participating sites, using a phantom with known T1 values. We found field strength dependence of the accuracy, and platform dependence of the repeatability of T1 measurements with the common VFA protocol. Accuracy for site-specific protocols was influenced by site, while repeatability, by type of protocol. Our findings suggest modified IR methods and VFA protocols with multiple flip angles and B1 correction as good methods for repeatable T1 measurement.
Purpose
The precision of pharmacokinetic parameters derived from DCE-MRI studies is highly dependent on accurate measurement of the baseline T1 value of the tissue of interest1,2. The objectives of this study (sponsored by NCI Quantitative Imaging Network) are threefold: (1) measure interplatform variability in T1 quantification in a multicenter study by testing common inversion-recovery spin echo (IR-SE) and variable flip angle (VFA) protocols using a dedicated phantom, (2) determine the accuracy and precision of several T1 mapping methods currently used by participating centers in a phantom with known T1 and (3) determine the feasibility of a harmonized T1 mapping protocol across platforms and centers.Methods
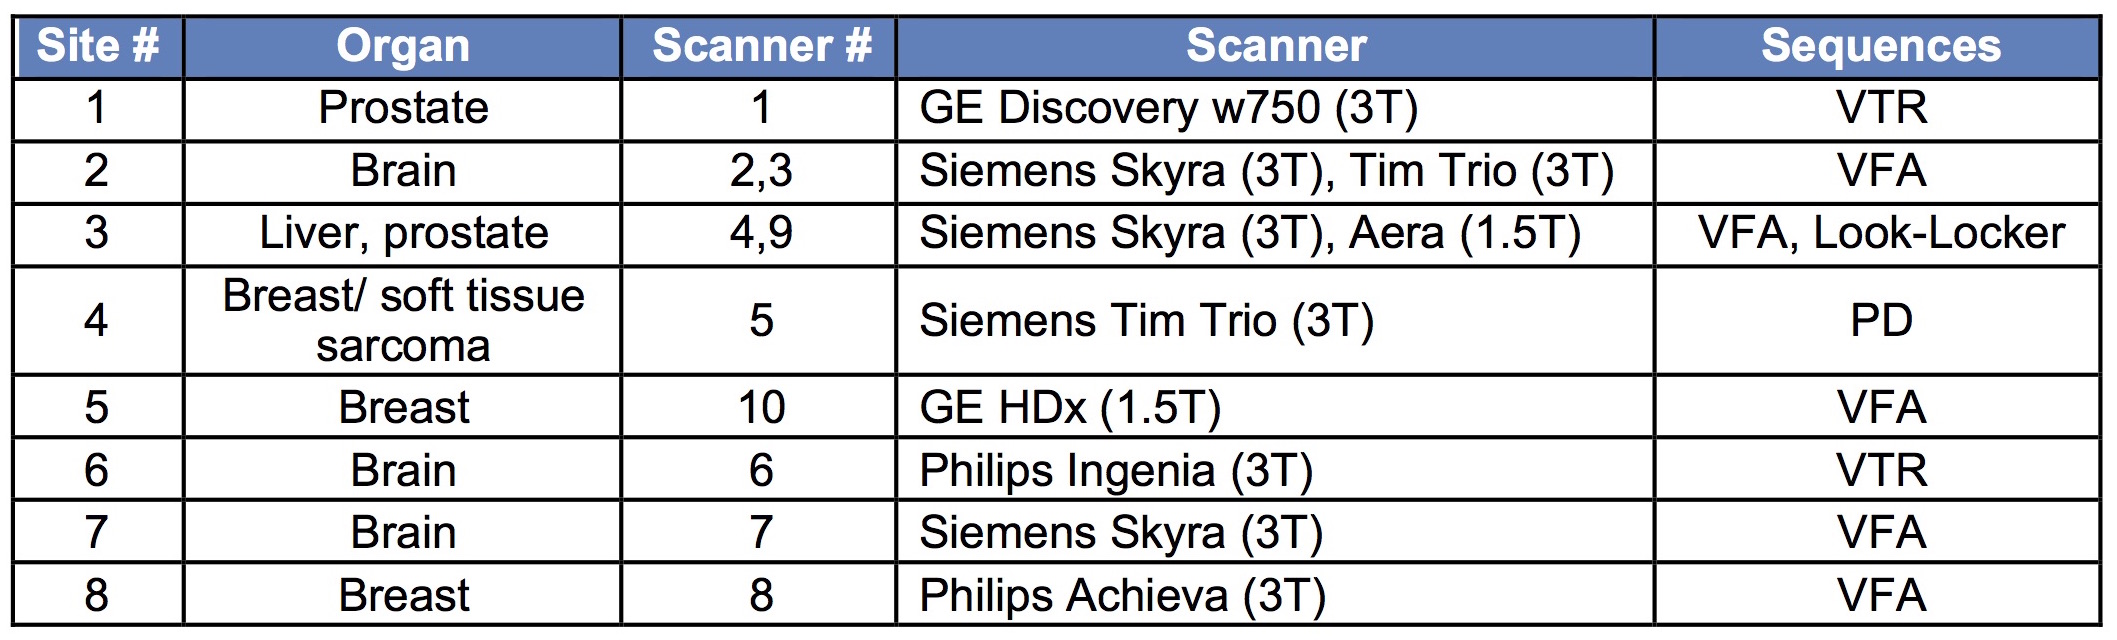
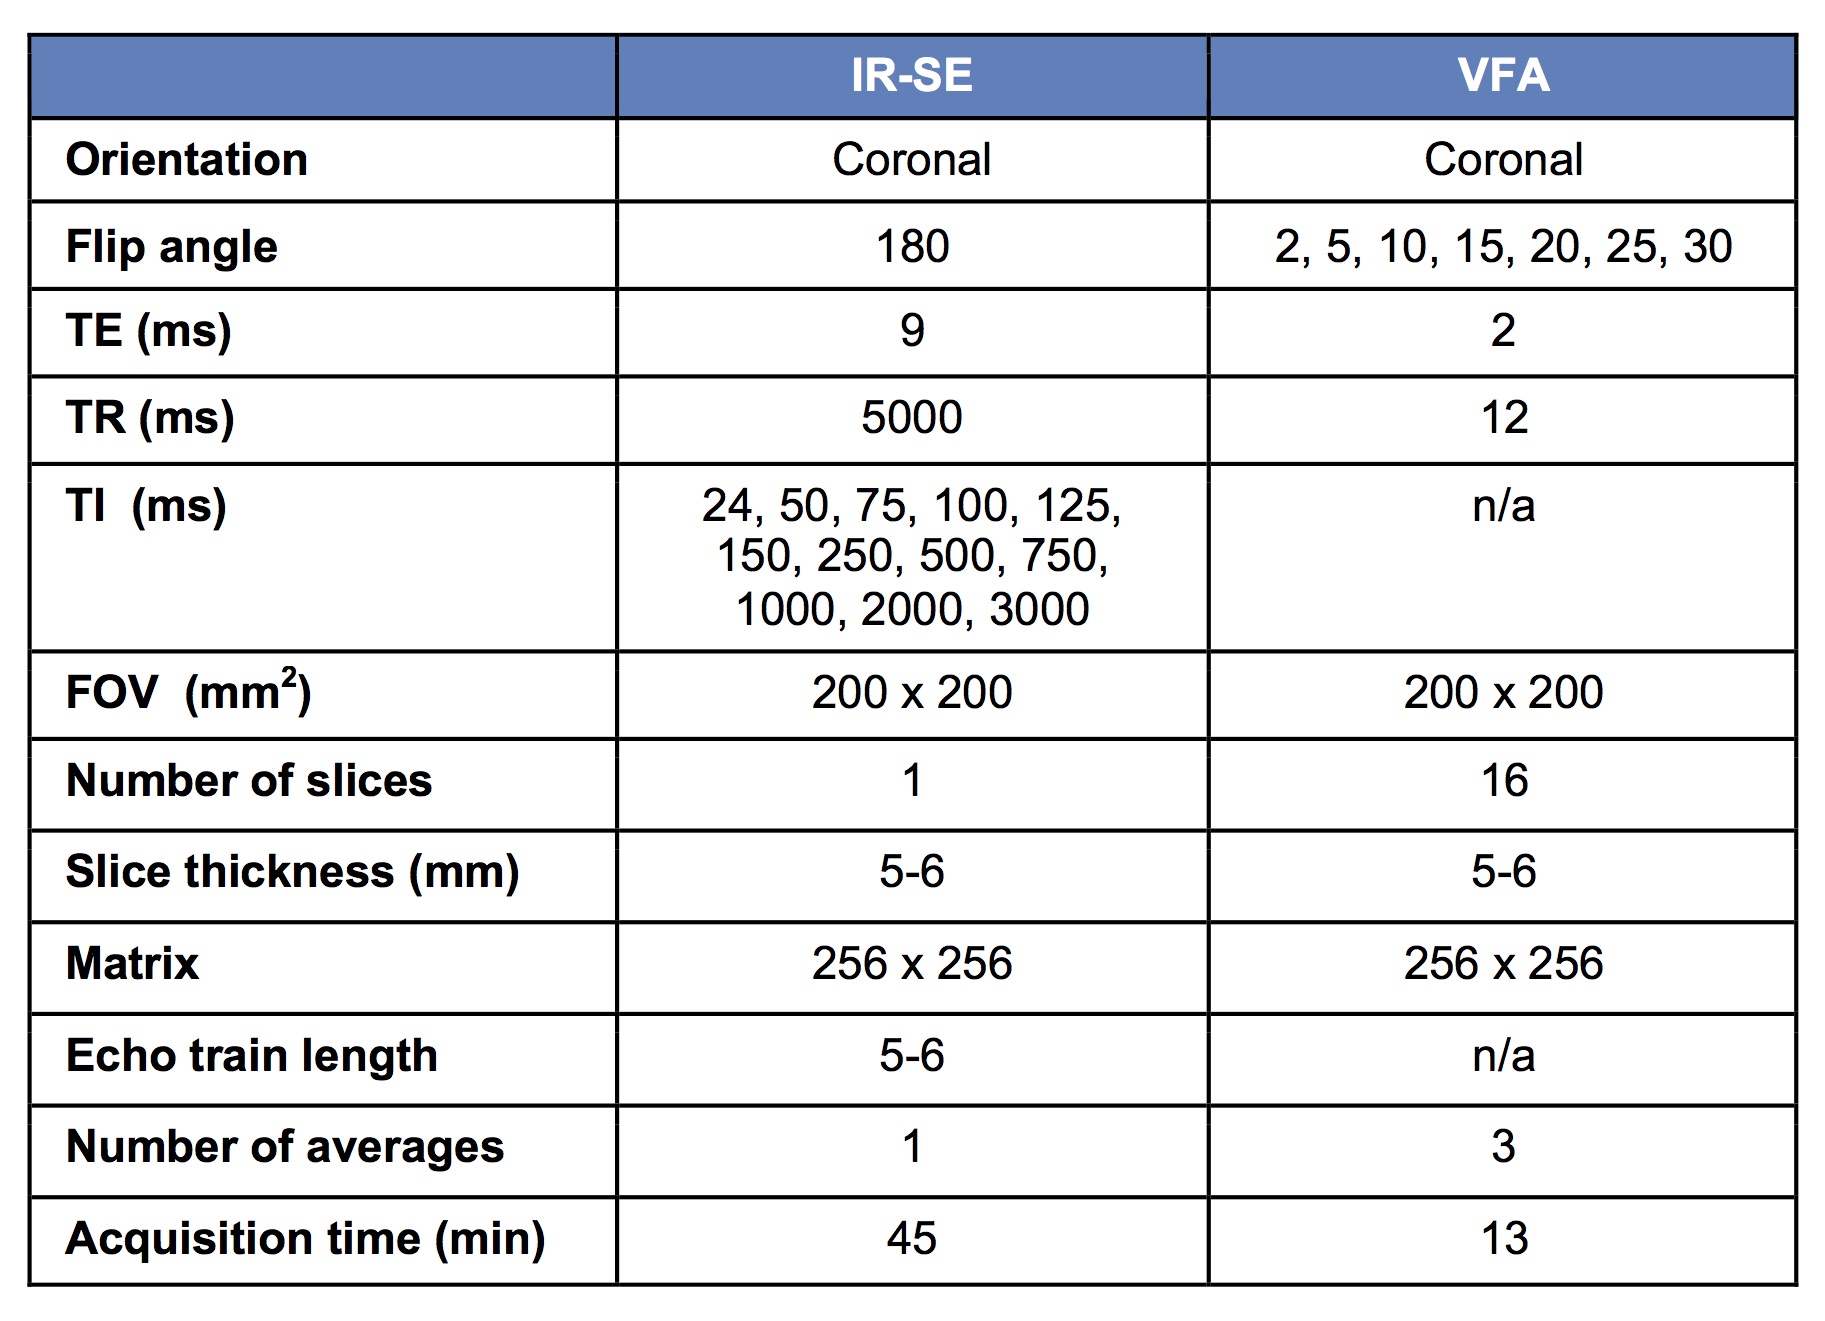
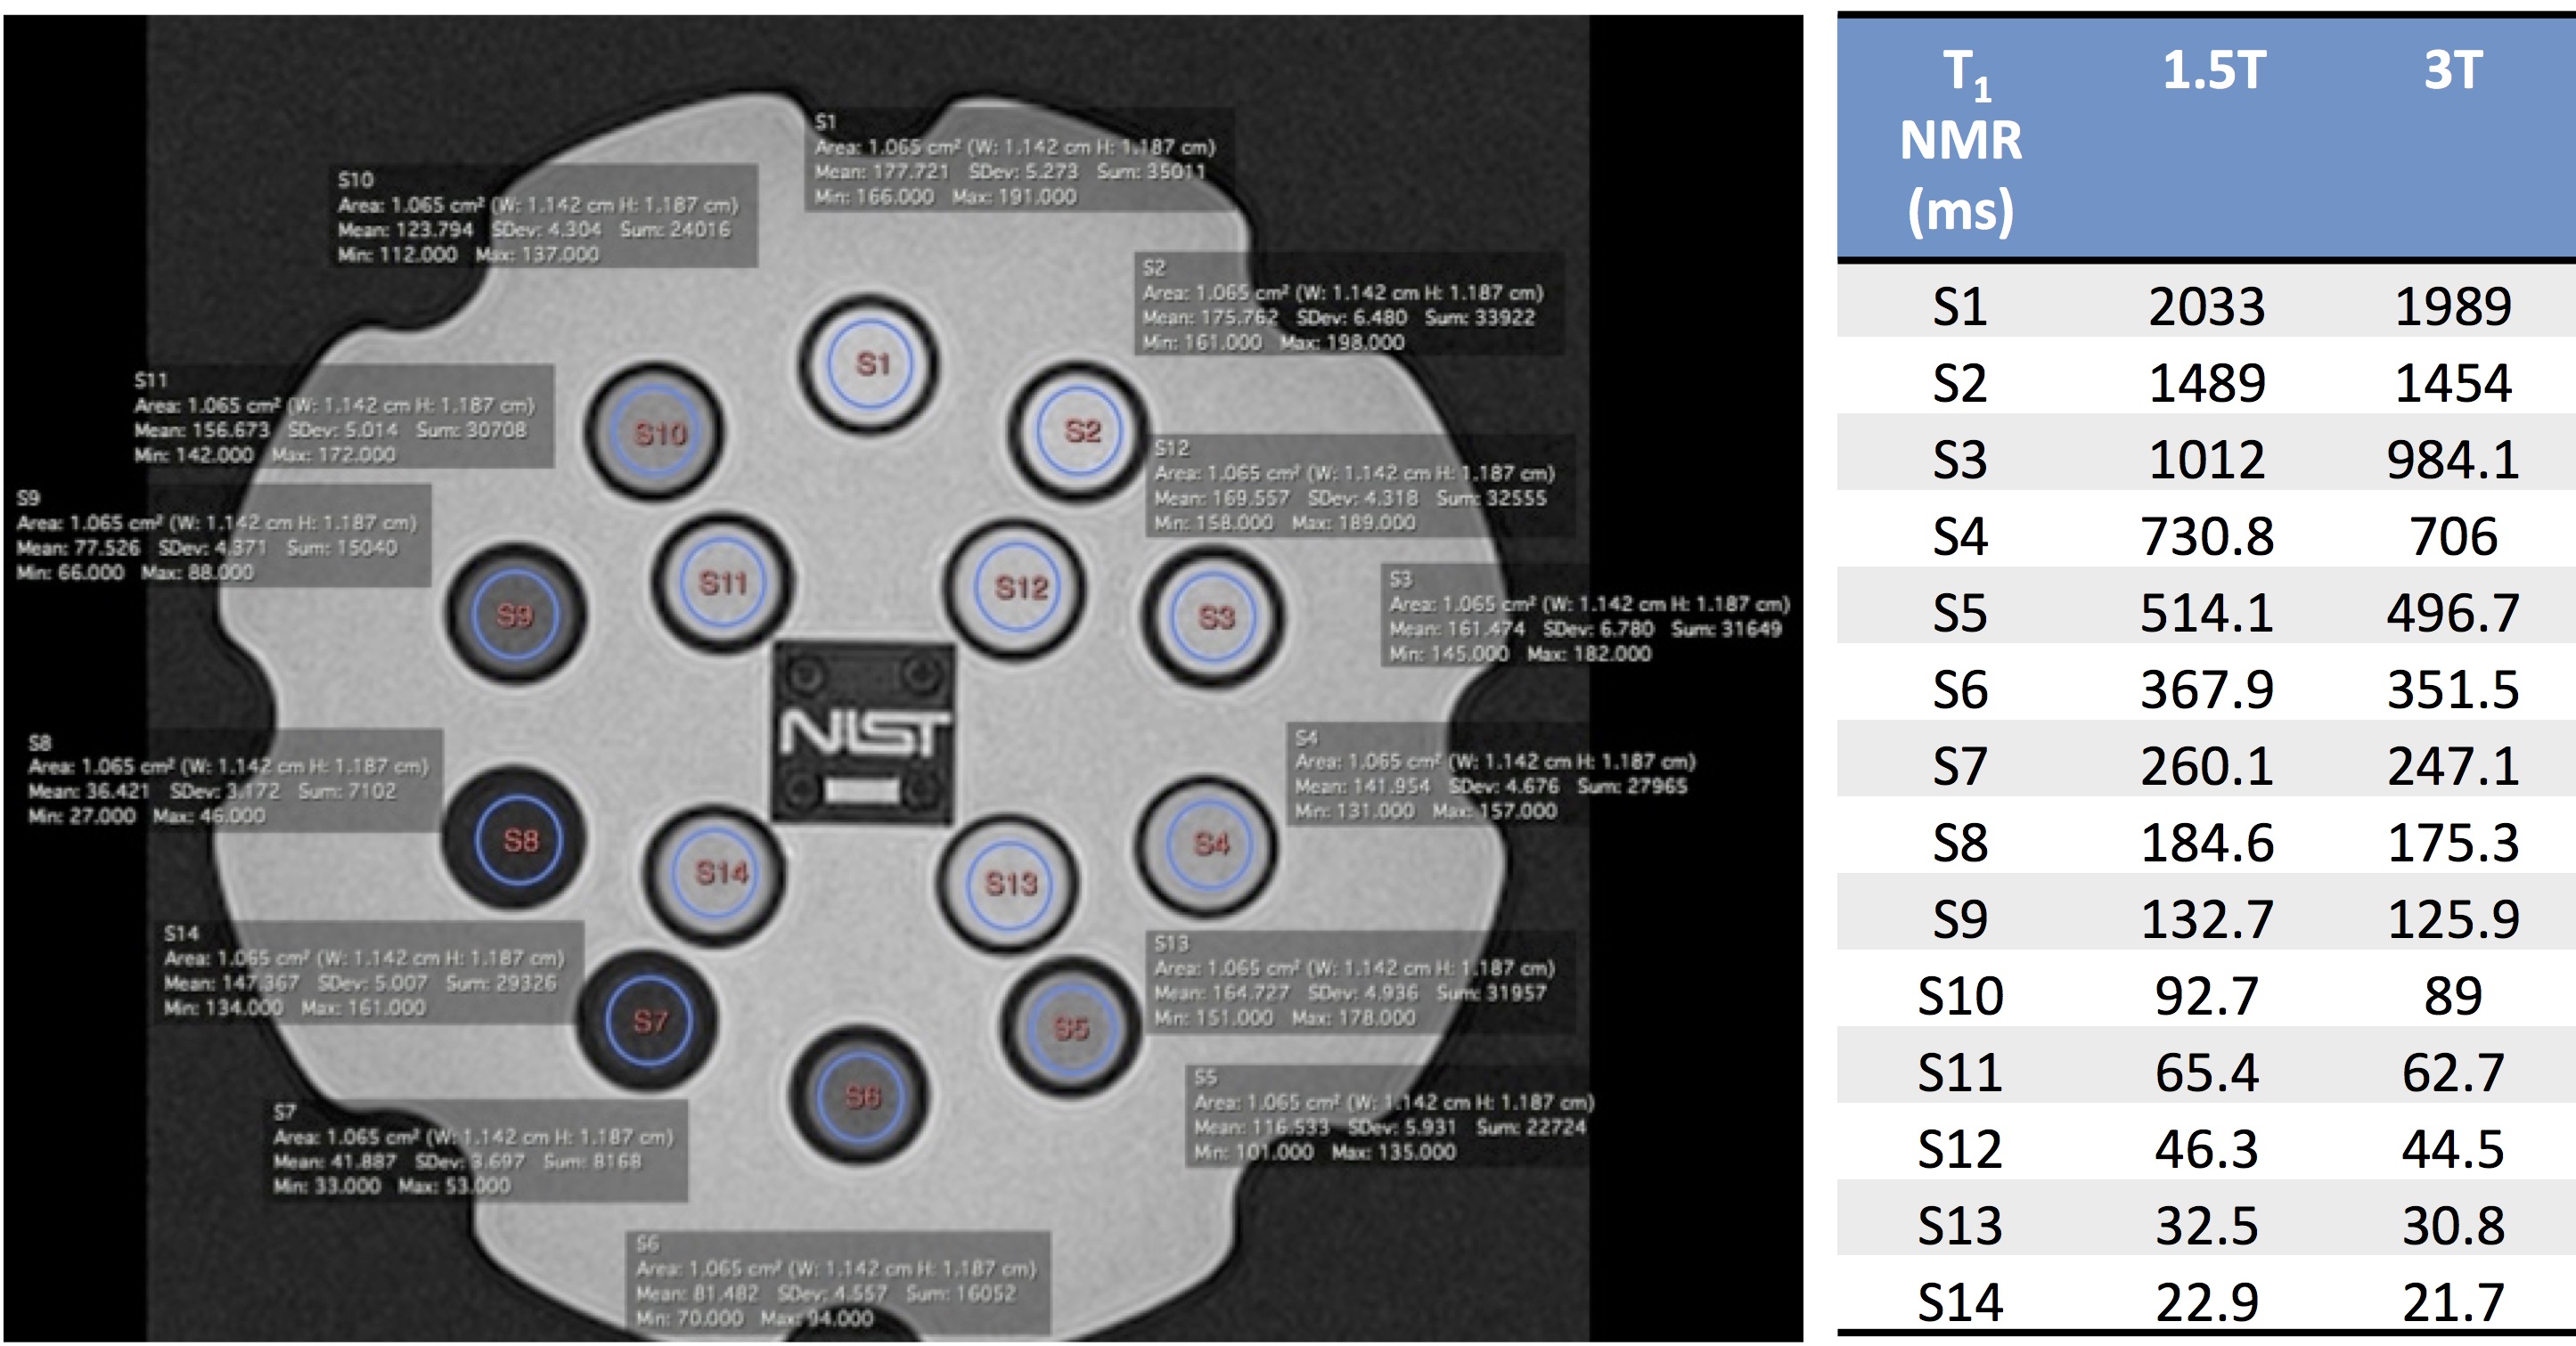
The study included 8 centers that routinely perform DCE-MRI with T1 measurement at 1.5T (2 sites) and/or 3T (7 sites), for different organs/tissues (Table 1). The methods and protocols used for T1 measurement varied among sites, with VFA being the most commonly used sequence (Table 1), due to its capability of covering extensive spatial range in a short amount of time. To assess the variability and accuracy of T1 measurements between platforms/sequences/protocols, we used a dedicated T1 phantom (Fig.1) produced by the National Institute of Standards and Technology (NIST)3. The phantom (Fig 1) contains 14 spherical polypropylene vials of deionized water doped with NiCl2, with T1 values known from previous NMR spectroscopy measurements at 200C3. The phantom was imaged at each site in duplicate (test-retest) sessions. Phantom temperature was measured at the start and end of each experiment. Sites imaged the phantom with the coils employed for their DCE-MRI studies. In addition to the T1 measurement protocols specific to each site, all sites collected data with common IR-SE and VFA protocols (Table 2). Data was analyzed by a single observer who placed circular ROIs in a central slice of each sphere using OsiriX. The mean ROI signal was fitted by central analysis site according to the signal equation for each sequence to obtain T1 values, using MATLAB R2015. For the common VFA and site-specific T1 measurements, accuracy with respect to standard NMR T1 values and test-retest precision were calculated4 (Eqs. 1 and 2).
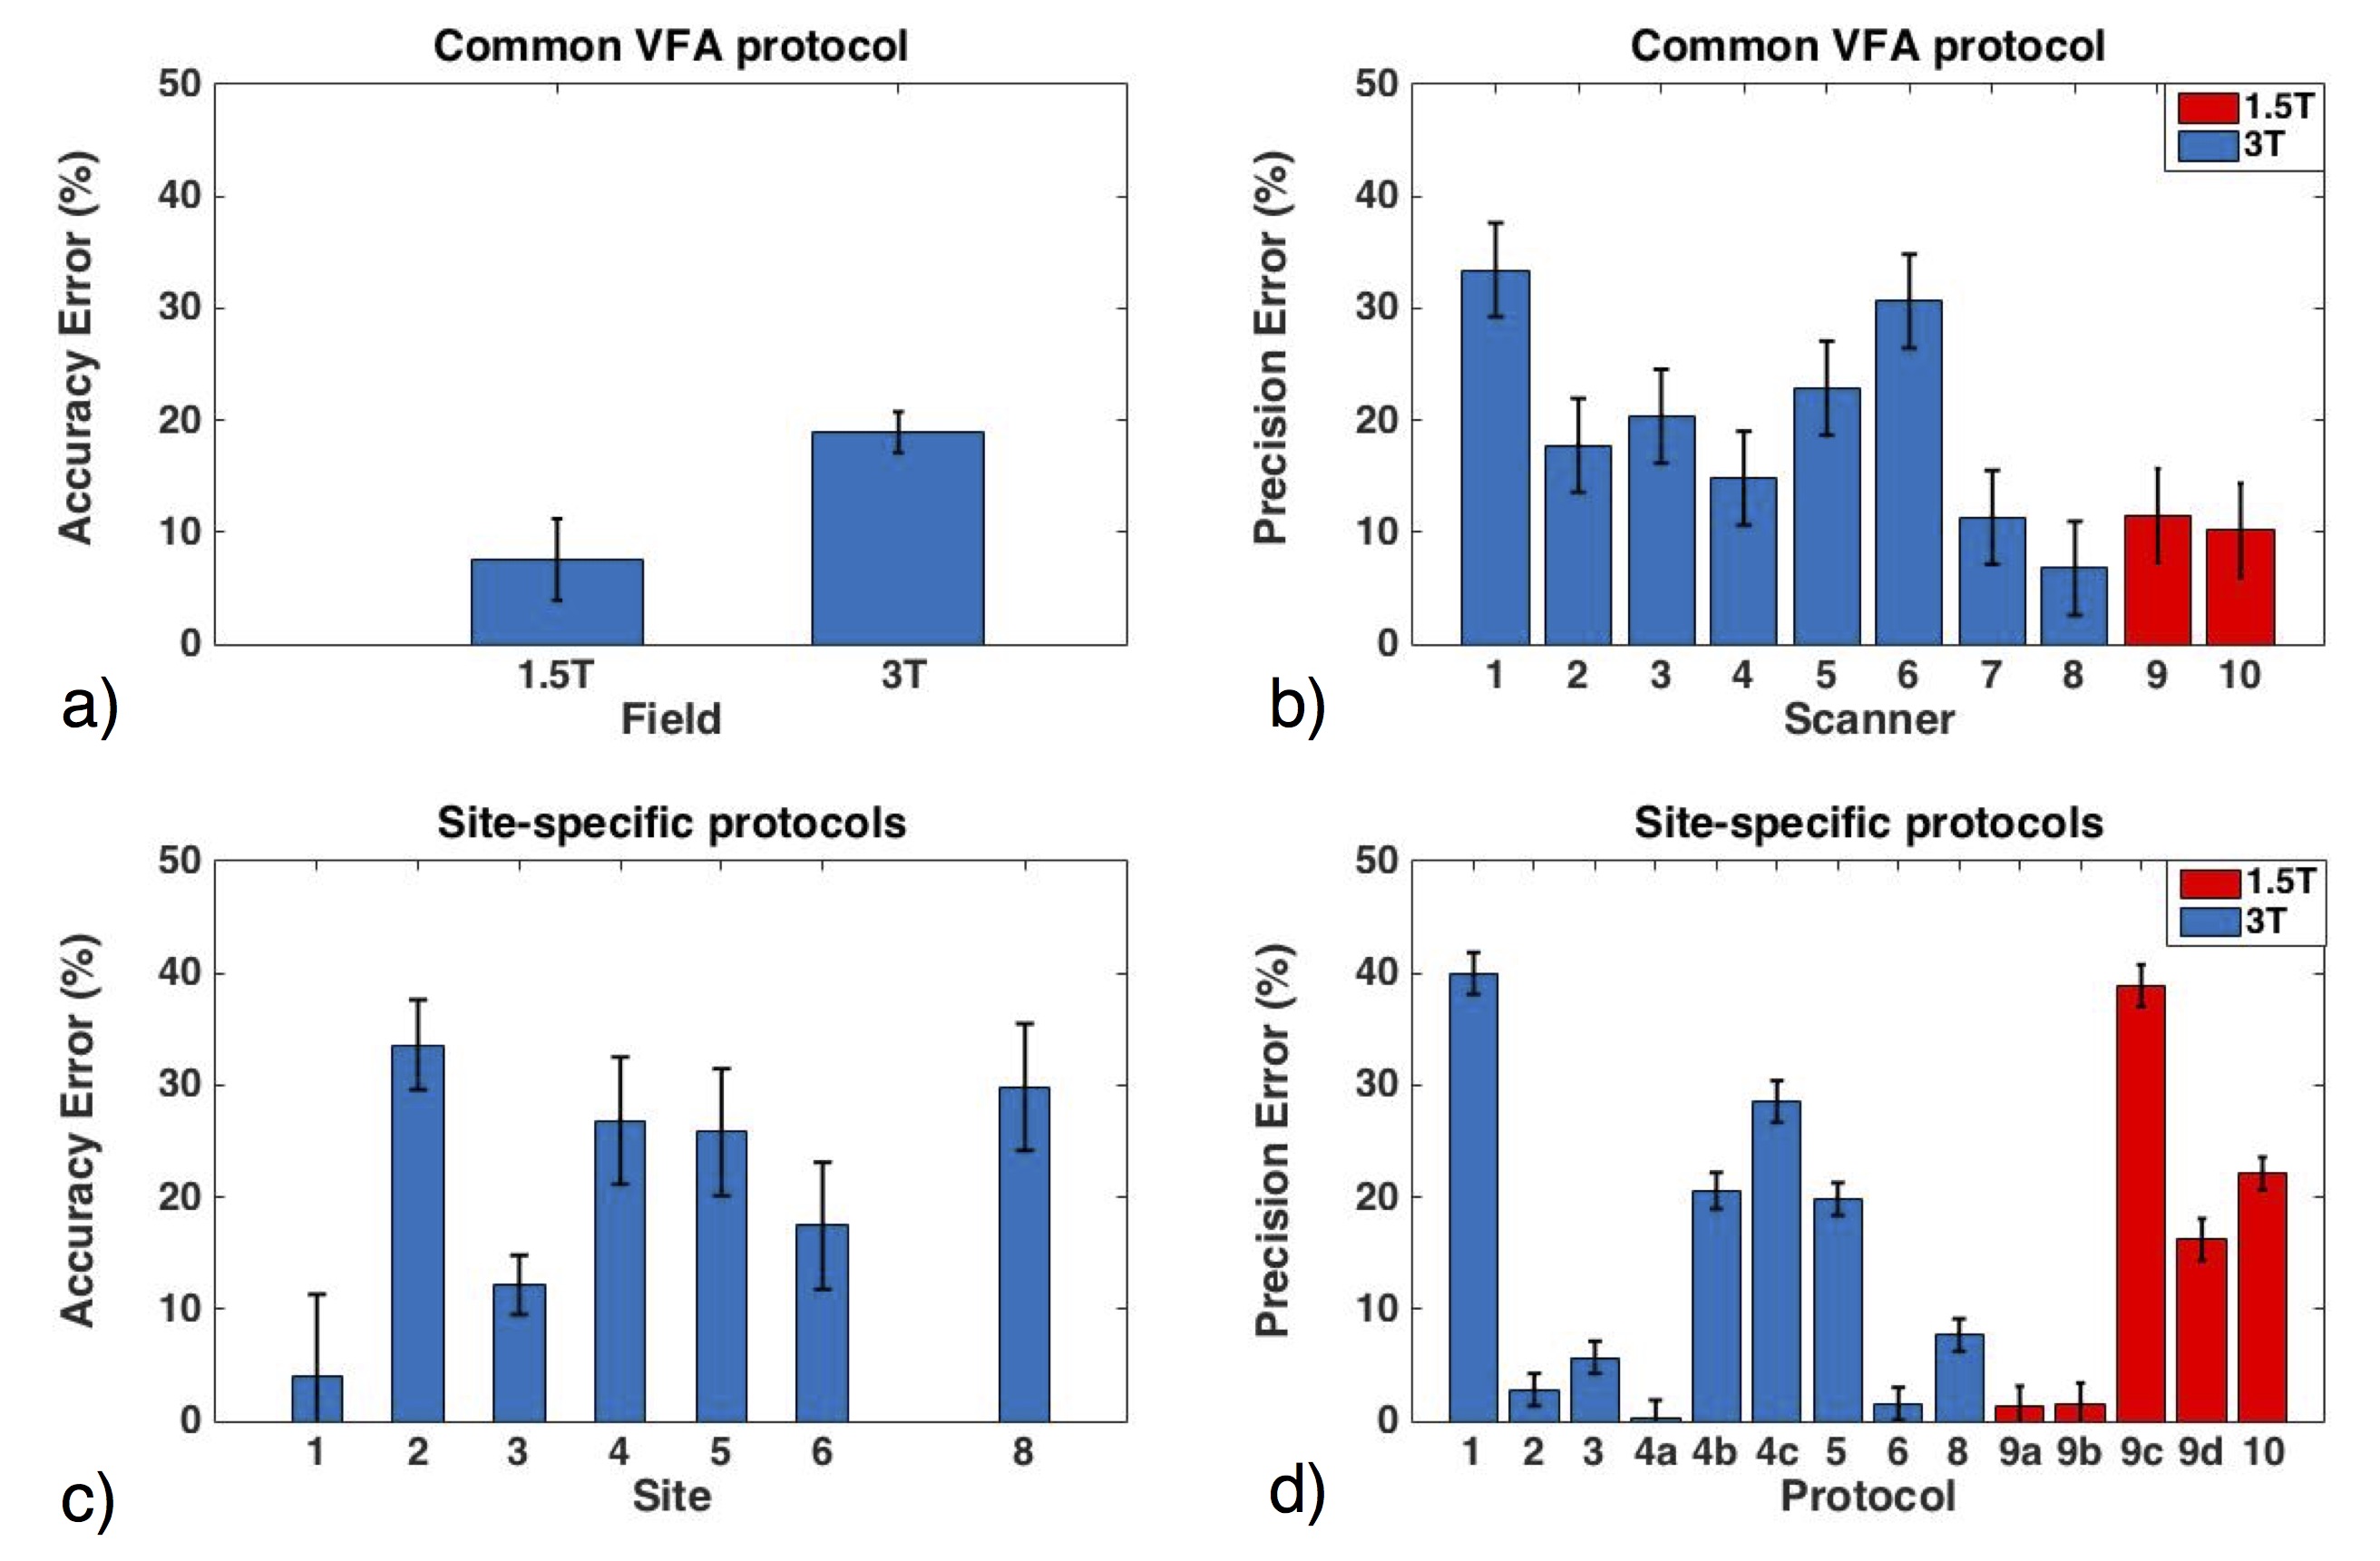
$$ Accuracy Error (%)=100 x |T1 protocol -T1 NMR|/T1 NMR $$ Eq.1
$$ Test-Retest Precision Error (%)= 100 x |T1 test-T1 retest|/ Mean (T1 test ,T1 retest) $$ Eq.2
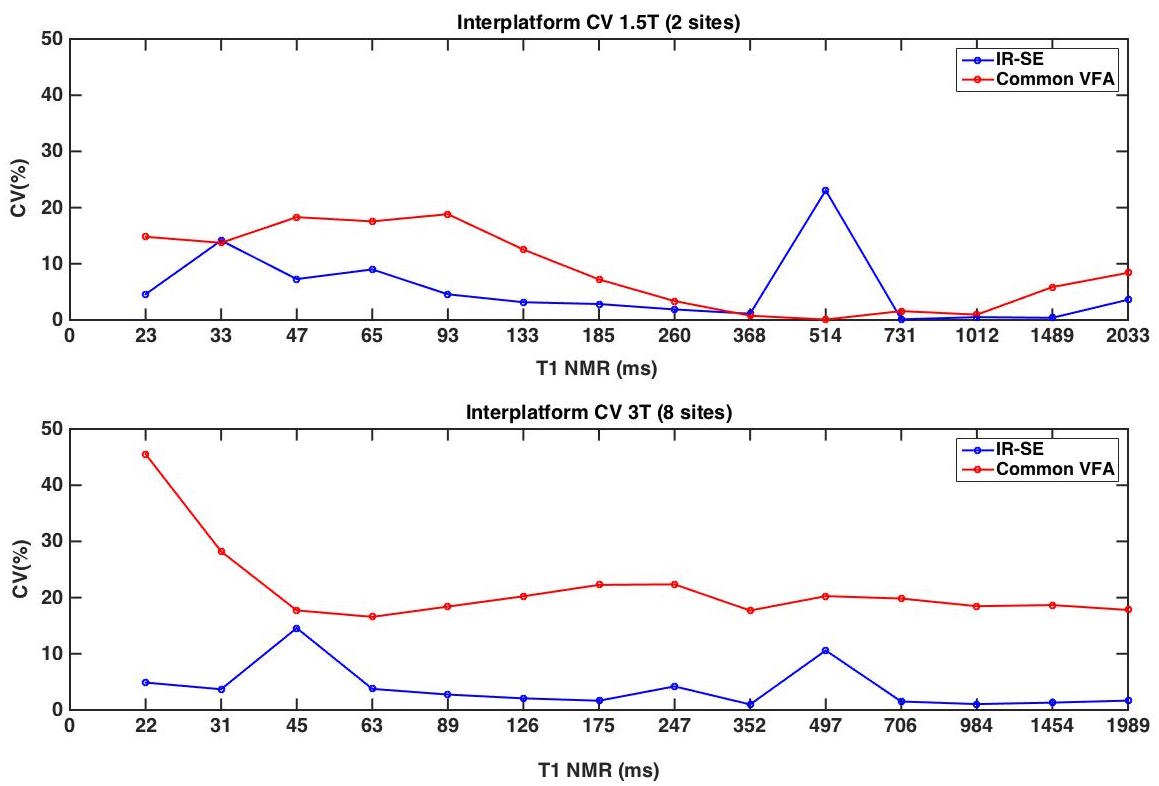
Interplatform reproducibility for the common protocols was assessed by measuring the coefficient of variation (CV). Agreement of IR-SE and reference NMR T1 values was assessed by Lin’s concordance correlation5. In order to compare accuracy and precision across sites, platforms, and protocols, general linear mixed models were used4. Vial, scanner, vendor, site and field strength were included as fixed effects for the common VFA protocol. Protocol and sequence type were included as additional fixed effects for site-specific T1 measurements.
Results
The temperatures recorded in the phantom were 21.1 ± 1.1 0C (18.9-22.6 0C) across all experiments. Interplatform CVs are shown in Figure 2 (mean IR-SE CV=5%, VFA CV=15.3%). Significant Lin’s concordance correlations were observed between IR-SE and NMR T1 (r>.99, p<1x10⁻⁶). The general linear mixed model analysis showed less accuracy (Fig.3.a) at 3T than at 1.5T with the standard VFA protocol (p=0.006). Platform had a significant (p<1x10⁻⁶) effect on test-retest precision (Fig 3 b). Among site-specific protocols, site was the most significant (p=0.0004) predictor of accuracy (Fig.3.c). Test-retest precision error for site-specific protocols (Fig 3.d.) was higher at 3T than at 1.5T for VFA protocols (p<1x10⁻⁴), although VFA brain protocols (with 6 or 7 flip angles) performed better than liver and prostate VFA protocols (with 2 flip angles) (p<1x10⁻⁴). Among protocols, the Look-Locker protocol for the liver had the greatest test-retest precision at both field strengths.Discussion and conclusions
We observed high interplatform variability for the common VFA protocol, especially at higher field strengths. The deviations from reference NMR T1 values of common VFA and site-specific protocols (> 10%) cannot be attributed only to temperature (accounting for <2% error in T1 for the range of temperatures recorded3). The field strength dependence of common VFA accuracy and the platform dependence of VFA test-retest precision suggest an effect of B1 inhomogeneity on VFA T1 measurements consistent with previous in vivo observations6. Site was the most significant predictor of accuracy for site-specific T1 measurements, which suggests that protocol optimization influences T1 accuracy more than choice of sequence. Repeatability was influenced by protocol. The findings of this study suggest modified IR sequences (e.g. Look-Locker) as good methods for repeatable T1 measurement. If more slice coverage is needed, VFA protocols with more flip angles could be used with B1 map correction.Acknowledgements
This study was sponsored by the National Cancer Institute Quantitative Imaging Network (NCI QIN). The sites participating in this QIN Working Group project receive funding for quantitative cancer imaging projects from the following NIH NCI grants: U01 CA172320, U01 CA142565, U01 CA183848, U01 CA166104, U01 CA151261, U01 CA154602, U01 CA151235, U01 CA154601. The work of Octavia Bane was partly supported by the NCI training grant 5T32CA078207-15, and of Mathilde Wagner by Fondation ARC (France) SAE20140601302.References
1. Fennessy FM, Fedorov A, Gupta SN, Schmidt EJ, Tempany CM, Mulkern RV. Practical considerations in T1 mapping of prostate for dynamic contrast enhancement pharmacokinetic analyses. Magn Reson Imaging 2012;30(9):1224-1233.
2. Dale BM, Jesberger JA, Lewin JS, Hillenbrand CM, Duerk JL. Determining and optimizing the precision of quantitative measurements of perfusion from dynamic contrast enhanced MRI. Journal of magnetic resonance imaging : JMRI 2003;18(5):575-584.
3. Keenan KE, Stupic K, Boss M, et al. Multi-site, multi-vendor comparison of T1 measurement using NIST/ISMRM system phantom. In: International Society of Magnetic Resonance in Medicine (ISMRM) 24th Annual Meeting, Singapore, 2016. ISMRM. (3290).
4. Raman FS, Kawel-Boehm N, Gai N, et al. Modified look-locker inversion recovery T1 mapping indices: assessment of accuracy and reproducibility between magnetic resonance scanners. J Cardiovasc Magn Reson 2013;15:64.
5. Lin LI. A concordance correlation coefficient to evaluate reproducibility. Biometrics 1989;45(1):255-268.
6. Stikov N, Boudreau M, Levesque IR, Tardif CL, Barral JK, Pike GB. On the accuracy of T mapping: Searching for common ground. Magnetic resonance in medicine : official journal of the Society of Magnetic Resonance in Medicine / Society of Magnetic Resonance in Medicine 2014.
Figures