1461
Spatial resolution properties of QSM images using MEDI algorithm1Electrical and Computer Engineering, UNIST, Ulsan, Korea, Republic of
Synopsis
We investigated the spatial resolution of the MEDI reconstructed QSM images by deriving an analytical expression of the estimator in terms of the true QSM image. The implication of this expression is that no regularization will be applied to some part of the QSM images if the corresponding magnitude image area contains strong edges and relatively strong regularization will be applied to some part of the QSM images if the corresponding magnitude image area contains low magnitude values. Our simulations with a phantom and a in-vivo QSM image confirm this analysis; Impulse perturbations were suppressed on the area where the magnitude image has low contrasts and impulses were preserved on the area where the magnitude image has high contrast or edges.
Introduction
Quantitative Susceptibility Mapping (QSM) is an image of local tissue magnetic susceptibility by utilizing both magnitude and phase data of MRI. This method has been used in quantifying various materials such as iron [1]. Morphology enabled dipole inversion (MEDI) is a popular algorithm to obtain a QSM image by solving an l1 minimization with novel priors and cost function [2]. However, its theoretical spatial resolution properties have never been studied. In this abstract, we investigated the spatial resolution of the MEDI reconstructed QSM images by deriving an analytical expression of the estimator in terms of the true QSM image.
Methods
MEDI solves the following optimization problem:$$\min_x \| MG x\|_1 \mathrm{~subject~to~} \| W(Dx - b) \|_2^2 \le \epsilon$$where $$$x$$$ is an unknown QSM image, $$$b$$$ is a measured field maps (assuming that $$$b = Dx$$$), $$$D$$$ is a spatially invariant dipole kernel matrix, $$$W$$$ is a diagonal matrix with elements that areproportional to $$$m$$$, which is the magnitude image, and $$$G$$$ is a gradient operator (or finite difference matrix). The matrix $$$M$$$ is defined as follows:$$M = \left\{ \begin{array}{c l}0, & | Gm | \ge \mu \\1, & | Gm | < \mu \end{array} \right.$$where $$$\mu$$$ is a threshold related to the image noise level. Then, the final form of the estimated QSM image is$$\hat{x} = \left[ D^H W^2 D + \frac{G^H \hat{L}^\mathbf{M} G}{\lambda} \right]^{-1} D^H W^2 D x^t$$where $$$x^t$$$ is the true QSM image and $$$\hat{L}^\mathbf{M}$$$ is a diagonal matrix with elements$$\hat{L}^\mathbf{M} = \left\{ \begin{array}{c l}0, & | Gm | \ge \mu \\| \mathbf{M} G \hat{x} |^{-1}, & | Gm | < \mu.\end{array} \right.$$Using the same technique to derive the local impulse (or perturbation) responses ($$$P_j$$$) in [3, 4], we also approximated the local perturbation response as follows:$$P_j = \left[ D^H W^2 D + \frac{G^H \hat{L}^\mathbf{M} G}{\lambda} \right]^{-1} D^H W^2 D e_j$$where $$$e_j$$$ is a local perturbation vector with all zero elements except the $$$j$$$th voxel with a very small value $$$\delta$$$. We conjecture that this perturbation does not affect the values of $$$\hat{L}^\mathbf{M}$$$ much.The implication of this expression is as follows. The spatial resolution of $$$\hat{x}$$$, estimated QSM image, will be determined by the interaction between $$$D^H W^2 D$$$ term and $$$G^H \hat{L}^\mathbf{M} G / \lambda$$$ term. For example, no regularization will be applied tosome part of the QSM images if the corresponding magnitude image area contains strong edgesand relatively strong regularization will be applied to some part of the QSM images if the corresponding magnitude image area contains low magnitude values.Simulation Results
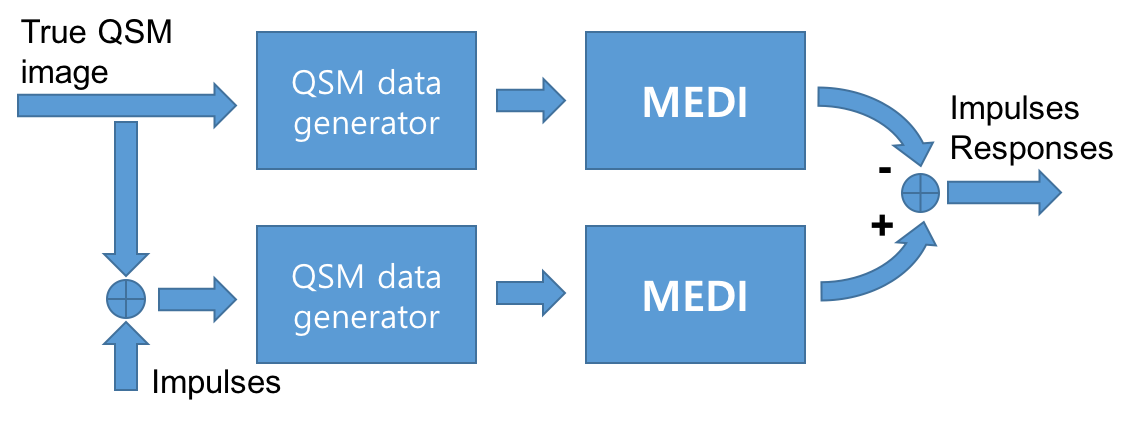
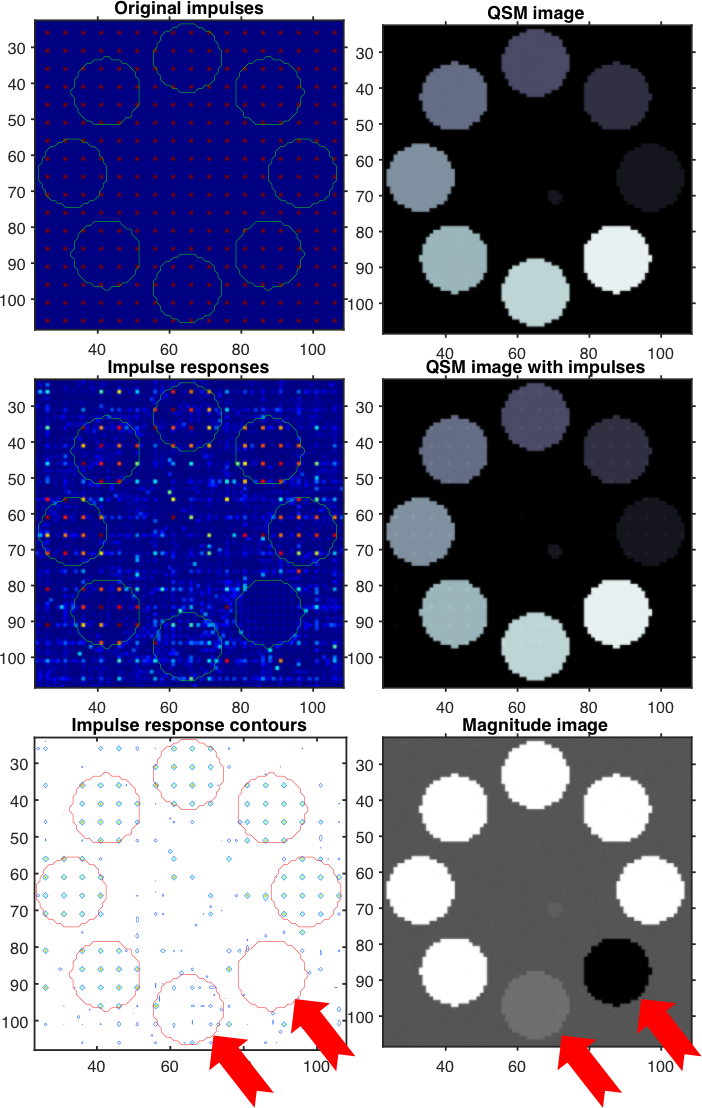
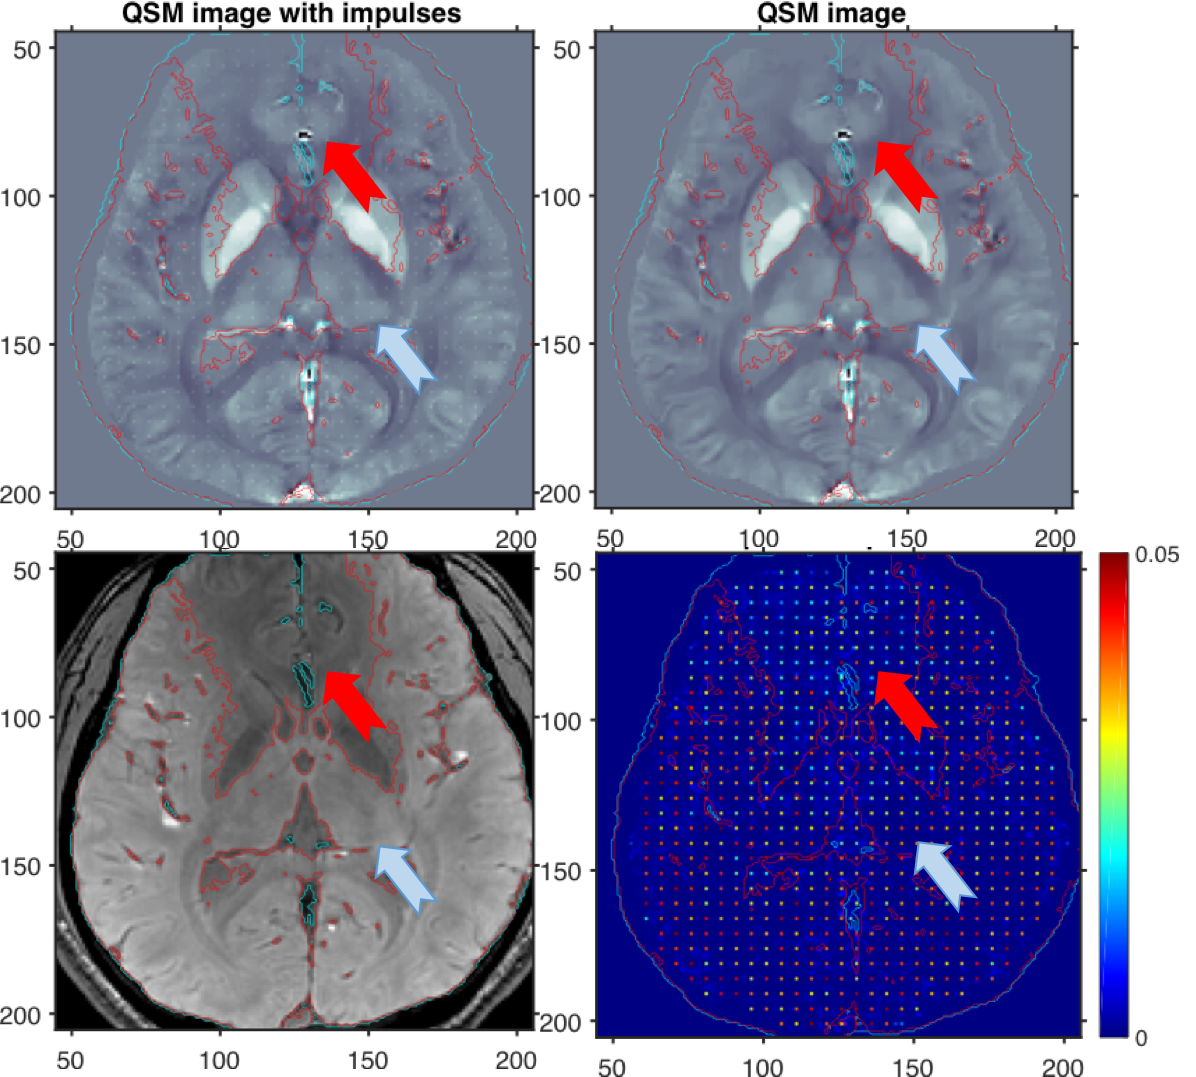
We simulated QSM data generation and MEDI image reconstruction using the MEDI toolbox [5]. For the phantom simulation, Two QSM data were constructed from the ground truth QSM image and the ground truth QSM with small impulse perturbations, respectively. Then, MEDI was used to reconstruct both QSM and QSM with impulses images with the same reconstruction parameters. Impulse responses were obtained by subtracting the reconstructed QSM image from the reconstructed QSM image with impulses as illustrated in Fig 1. Fig 2 clearly shows that impulses were suppressed on the area where the magnitude image has low contrasts as predicted in our analysis (red arrows). Impulses were preserved on the area where the magnitude image has high contrast or edges. We also simulated in-vivo QSM imaging with the in-vivo example in the MEDI toolbox [5]. The reconstructed image was used as a ground truth and we generated two QSM data with the original image and the image with impulse perturbations. Fig 3 also shows that small impulses were attenuated and the edges were blurred more in the area where the magnitude image has low intensity values (red arrows). However, for the area where the magnitude has high intensity, the small impulses were preserved (~0.05) and the edges look sharper (pale blue arrows).Conclusion
We derived an analytical expression to better understand the spatial resolution of QSM images that are reconstructed using MEDI and the simulation results confirmed our analysis. This analysis will be useful to interpret the results from QSM images with better understanding about the spatially varying resolutions and can potentially be used for designing new regularizers considering spatial resolutions.Acknowledgements
This research was supported in part by Basic Science Research Program through the National Research Foundation of Korea (NRF) funded by the Ministry of Science, ICT & Future Planning (NRF-2014R1A1A1007928) and in part by the 2016 Research Funds (1.160047.01) of UNIST (Ulsan National Institute of Science and Technology).
References
[1] Bilgic, Neuroimage 59(3), 2012.
[2] Liu, Neuroimage 59(3), 2012.
[3] Fessler, IEEE Trans. on Image Process 5(9), 1996.
[4] Ahn, IEEE Trans. Med. Imaging 27(3), 2008.
[5] http://weill.cornell.edu/mri/pages/qsm.html
Figures