1459
Adaptive Magnetic Resonance Image signal enhancement using squared eigenfunctions of the Schrodinger operator1Computer, Electrical and Mathematical Science and Engineering (CEMSE) division, King Abdullah University of Sciences and Engineering (KAUST), Thuwal, Saudi Arabia, 2Department of Radiology, University of Gent, Gent, Belgium
Synopsis
The main of challenge of Magnetic Resonance Imaging (MRI) is dealing with high levels of noise which may corrupt the image especially since the noise is almost correlated with the image details. In this regard, we propose a new MRI enhancement method to overcome this limitation. The proposed MRI enhancement method relies on square sub-images enhancement depending on the noise level in each position using spatial adaptation of the Semi-Classical Signal Analysis (SCSA) method, where an enhancement parameter h is subject to a Gaussian distribution. The results show significant improvement in noise removal and preserving small details in the image.
Intoduction
Magnetic Resonance Image (MRI) signal enhancement is one of the most active medical imaging research fields. This is mainly due to the growing challenges related to the newest evolution of MRI technologies seeking the reduction of the acquisition time and the enhancement of the images resolution for potential clinical use. However, high speed MRI image acquisition techniques suffers from high noise level. A new method, namely Semi-Classical Signal Analysis (SCSA), has been proposed by the authors in [1]. This method decomposes the image into the squared eigenfunctions of the Schrodinger operator [2] and then uses a soft threshold, reflected by an appropriate choice of a parameter denoted h, to separate the noise from the image. However the choice of this parameter is not straightforward and depends on the noise level distribution. In this work we propose a new strategy to select the threshold by adapting its value to the noise distribution using a Padded Square Gaussian distributed h (SCSA-PSGh) strategy.Material and Methods
Experiments are performed on one healthy male subject, on a 3T scanner (MAGNETOM Tim-Trio, Siemens Healthcare) equipped with a 32-channel head coil for signal reception. Turbo Flash sequence is used with the following parameters: TR/TE = 250/2.46 ms; matrix size, 256x256 resolution and 33 contiguous slices; FOV: 220mm; voxel size: 0.9x0.9x3 mm3; flip angle:10; and receiver bandwidth set to 320 Hz/pixel. To reduce SNR, two sets of data are acquired: one with Nex =2, considered as an original data set (see images below), and the second set with Nex = 1, and Parallel Imaging (PI) acceleration factor set to 2, taken as noisy data set.Two denoising tests are conducted, with fixed and variable h. In the latter, the noisy image is first divided into sub-images $$$I_{ij}$$$ (Figure. 1) then the SCSA method is applied on each sub-image with the corresponding $$$h_{ij}$$$ which follows a Gaussian distribution.
The denoised sub-image $$$I_{h_{ij}}(x,y)$$$ is defined as follows:
\begin{equation}I_{h_{ij}}(x,y)=\left(\frac{h_{ij}^{2}}{L^{cl}_{2,\gamma}} \displaystyle\sum_{k=1}^{K_{h_{ij}}} \left(-\mu_{k,h_{ij}} \right)^{\gamma}\psi^{2}_{k,h_{ij}}(x,y)\right)^{\frac{1}{1+\gamma}}~~~,~~\quad i,j=1,\cdots,N_{s} ~~, \end{equation}
where
\begin{equation} L^{cl}_{2,\gamma}=\frac{1}{2^{2}\pi}\frac{\Gamma(\gamma+1)}{\Gamma(\gamma+2)} ~~~~,\end{equation}
$$$I_{h_{ij}}(x,y)$$$ is the pixel $$$(x,y)$$$ in the denoised sub-image $$$I_{h_{ij}}$$$. Γ refers to the standard Gamma function. Moreover, $$$\mu_{k,h_{ij}} $$$ and $$$\psi_{k,h_{ij}}$$$ denote the negative eigenvalues with $$$K_{h_{ij}}$$$ is a finite number of negative eigenvalues, $$$\mu_{1,h_{ij}} < \cdots <\mu_{K_{h_{ij}},h_{ij}}< 0$$$ and associated $$$L^2$$$-normalized eigen functions of the operator $$$\mathcal{H}_{2,h_{ij}}\left(I_{ij}\right)$$$ such that:
\begin{equation}\mathcal{H}_{2,h_{ij}}(I_{ij})\,\psi_{k,h_{ij}} = \mu_{k,h_{ij}}\,\psi_{k,h_{ij}} ~~, ~~\quad ~~ k=1,\cdots,K_{h_{ij}} ~~ ,~~ i,j=1,\cdots,N_{s} . \end{equation}
where, $$$\mathcal{H}_{2,h_{ij}}(I_{ij})= -h_{ij}^{2}\Delta - I_{ij}$$$ , with $$$\Delta=\frac{\partial^{2}}{\partial x^{2}}+\frac{\partial^{2}}{\partial y^{2}} $$$ .
Results and Discussion
The image denoising performance has been evaluated using three gold standard metrics: the Structural SIMilarity index (SSIM) to evaluate image details preservation, the Peak Signal to Noise Ratio (PSNR) to estimate the amount of noise removal, and the Global Phase Coherence (GPC) to measure the image sharpness[3]. Figures 2 presents the evolution of the sharpness, SSIM and the PSNR with respect to h while Figure 3 displays the denoised images with fixed and variable h respectively. The results illustrate the good performance of the proposed SCSA-PSGh method which reduces noise while preserving the image details (higher sharpness and better signal-to-noise ratio, especially for hborder=0.5 and hcenter=2.45).Conclusion
The obtained results demonstrate that the proposed signal enhancement algorithm for MRI data is efficient in noise reduction while preserving the image details. Optimization of size of the sub-images is underway for better noise level estimation for a more accurate spatial distribution of the parameter h than the proposed standard Gaussian distribution one.
Acknowledgements
Research reported in this publication was supported by King Abdullah University of Science and Technology (KAUST).
References
1. J. Zhang , T.M. Laleg-Kirati, Stephanie Bogaert, Eric Achten , and Hacene Serrai, "Magnetic Resonance Imaging de-noising using the squared eigenfunctions of the Schrödinger operator: Application to brain MRI data", Accepted in ISMRM 24th Annual Meeting, Singapore, 2016.
2. Z. Kaisserli, T.M. Laleg-Kirati and A. Lahmar-Benbernou, "Image reconstruction using squared eigenfunctions of the Schrödinger operator", Digital Signal Processing Journal, Vol. 40, pp.80–87, 2015.
3. G. Blanchet, L. Moisan, proceedings of the IEEE International Conference on Acoustics, Speech, and Signal Processing (ICASSP), pp. 1065-1068, 2012.
Figures
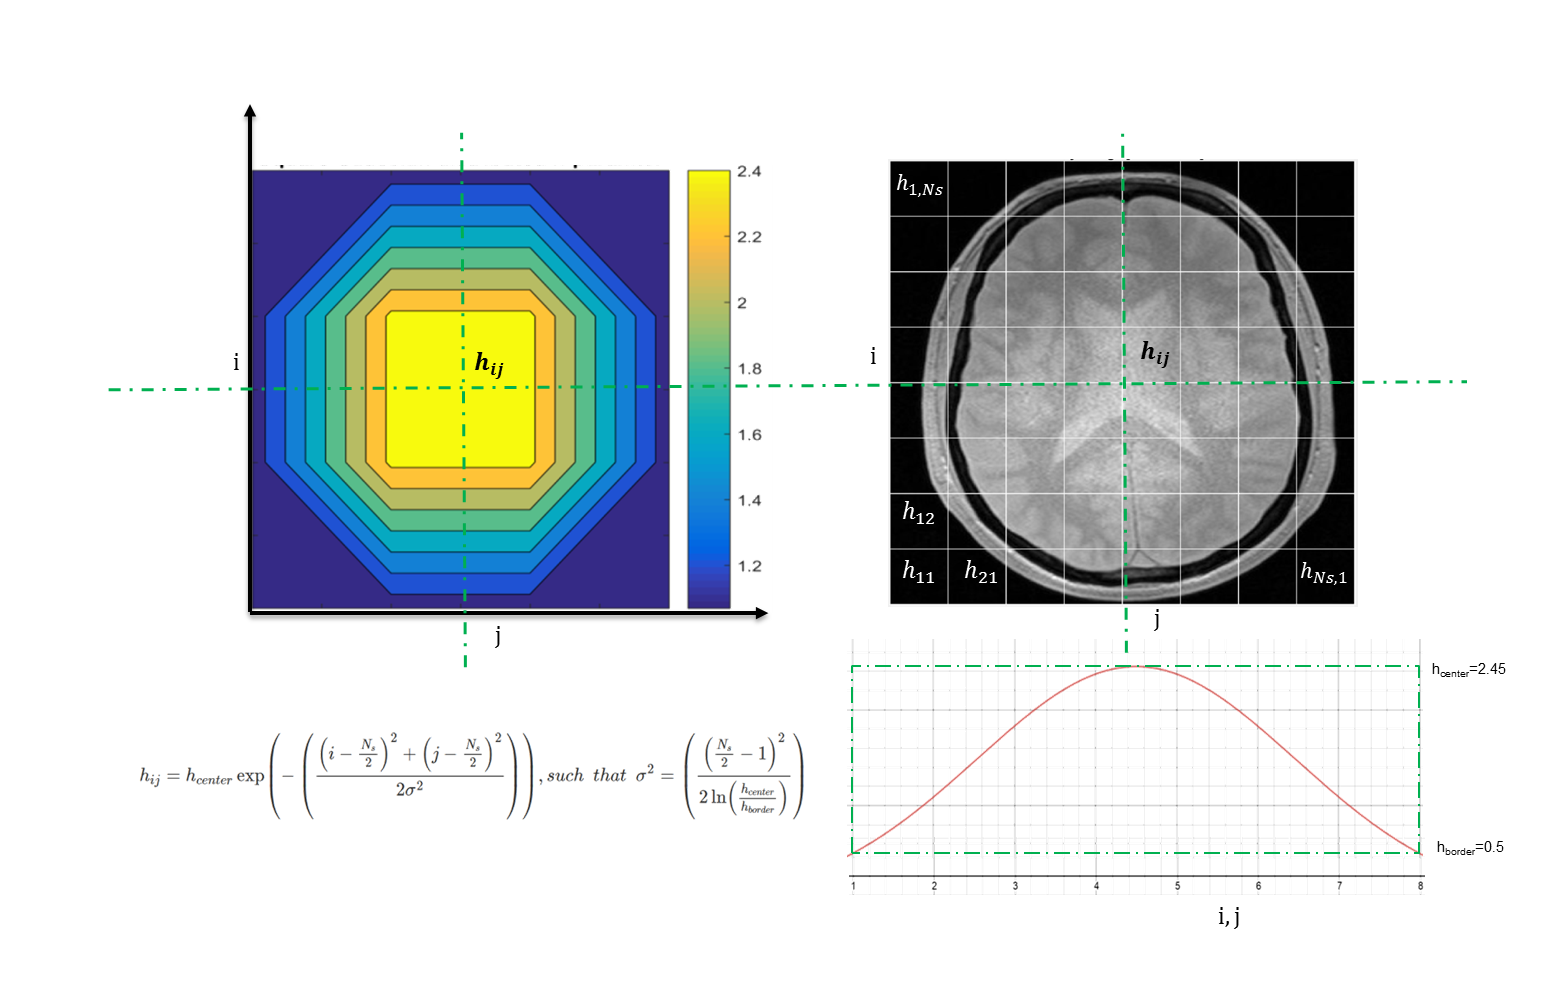
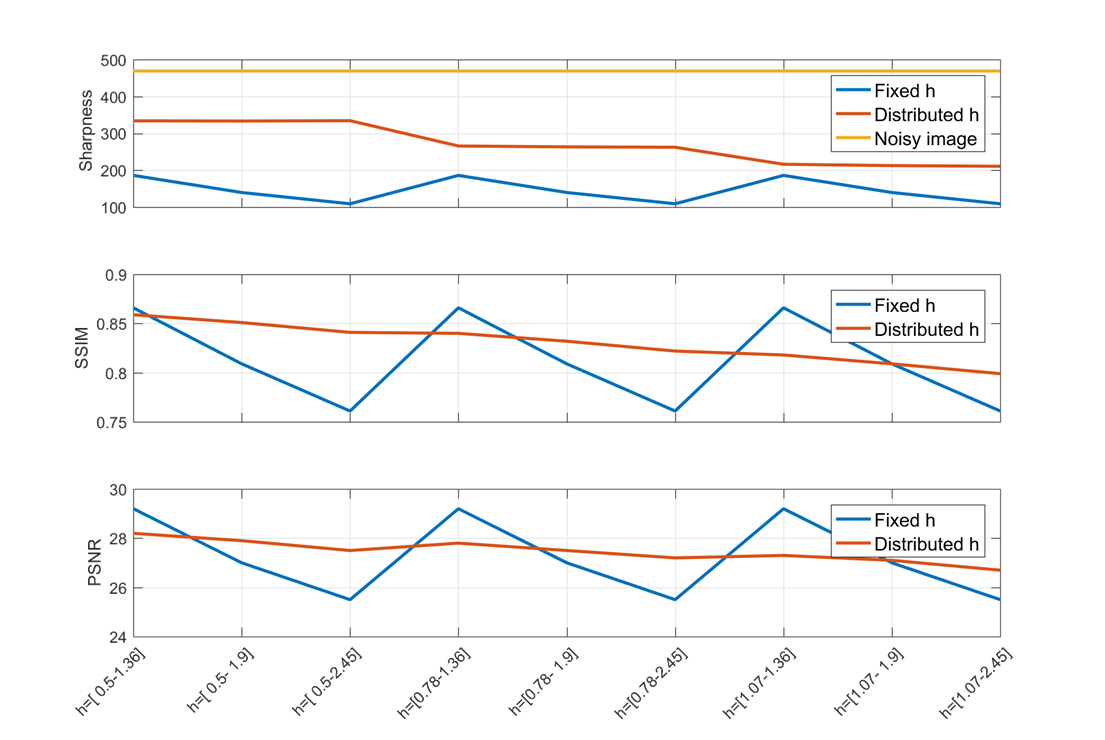
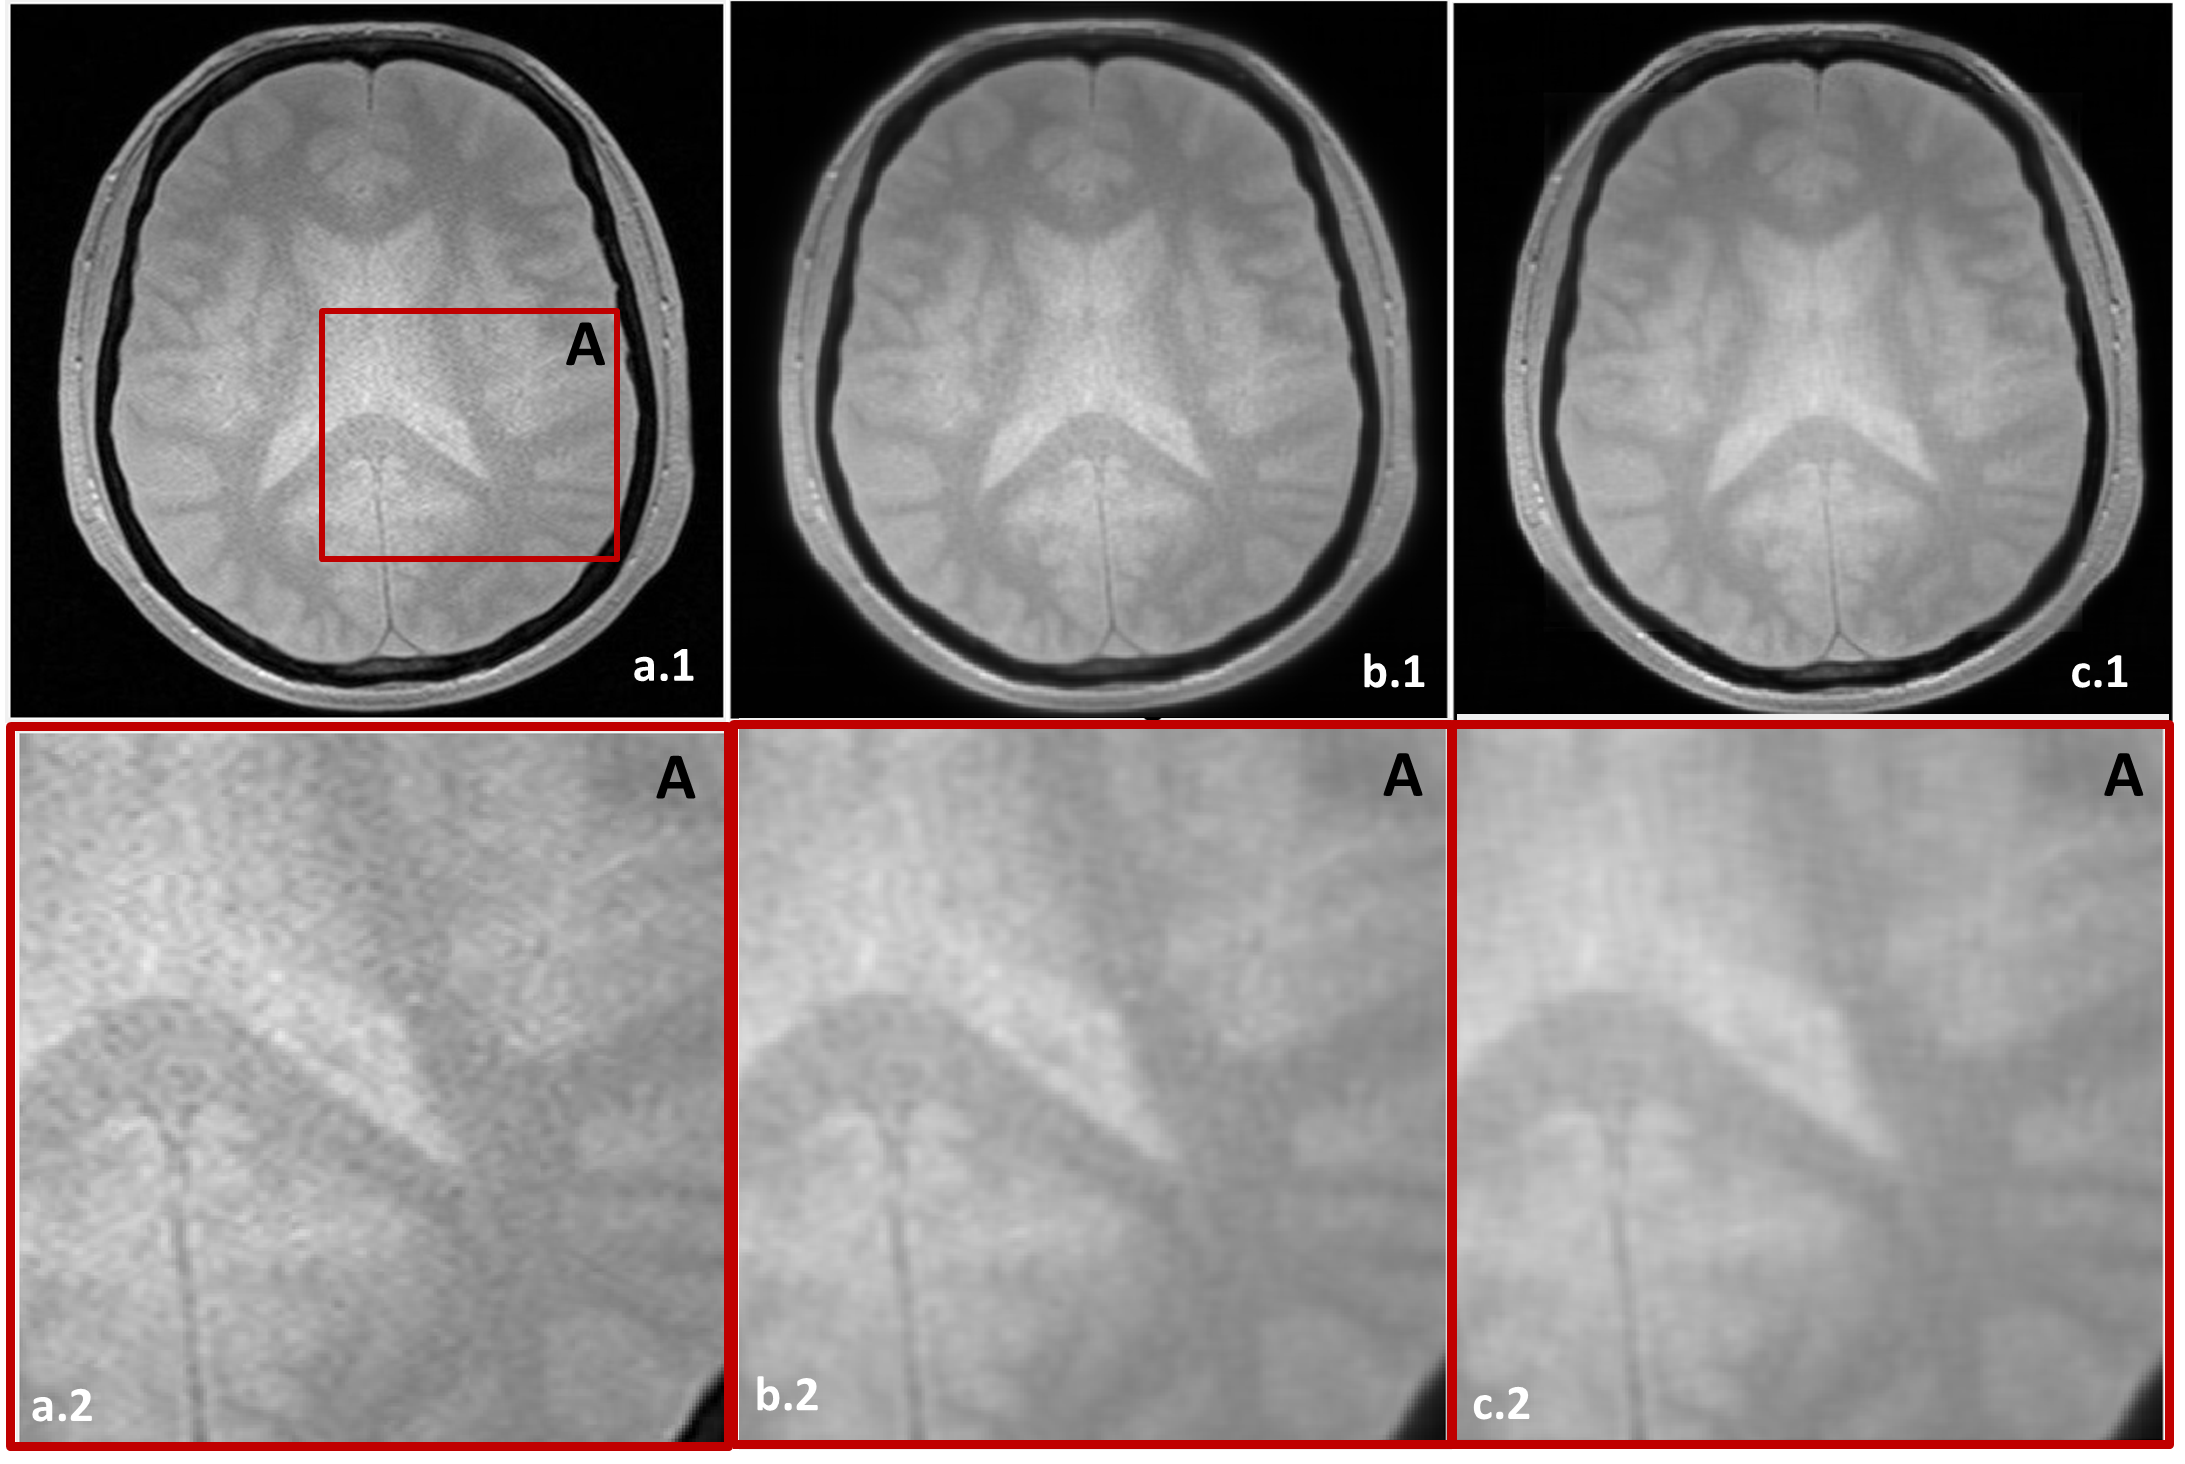
Figure.3. Noisy (a.1), and denoised image with fixed h (b.1) and variable h (c.1), zoom on the region A (displayed on a.1), in the noisy (a.2), and denoised image with fixed h (b.2) and variable h (c.2).