1458
Differences in parameter sensitivities of GESFIDE MR signals generated on realistic angiograms and on idealized cylinders1Electrical engineering, Ecole Polytechnique Montreal, Montreal, QC, Canada, 2Radiology, Harvard Medical School, Massachusetts General Hospital, MA, United States
Synopsis
Idealized models of cylinders for the vasculature are used in several quantitative MRI techniques such as for perfusion, CBV, vessel size and vascular MR fingerprinting. While limitations of these models are recognized, a direct comparison of the predicted MR signal between different cylinder models and those using a real vasculature as substrate has not been done to our knowledge. Here we compare the sensitivity of the MR signal for the GESFIDE sequence for 4 sets of , models of cylinders and 6 realistic angiograms from mouse somatosensory cortex. In general, simulation results are all different between the different angiograms and the different models of cylinders. This suggests that much care should be used in interpreting literature results based on models of cylinders, or as well with models on angiograms, to account for the possibility of biases in the absolute results. Correlations and differences in absolute values, for some parameters, may perhaps be less subject to bias.
INTRODUCTION
Idealized models of cylinders for the vasculature are used in several quantitative MRI techniques such as for blood vessel size1,2 and vascular MR fingerprinting3. While limitations of these models are recognized4,5,6, a direct comparison of the predicted MR signal between different cylinder models and those using a real vasculature as substrate has not been done to our knowledge. Here we compare the sensitivity of the MR signal for the GESFIDE sequence for 4 models of cylinders and 6 realistic angiograms from mouse somatosensory cortex.
METHODS
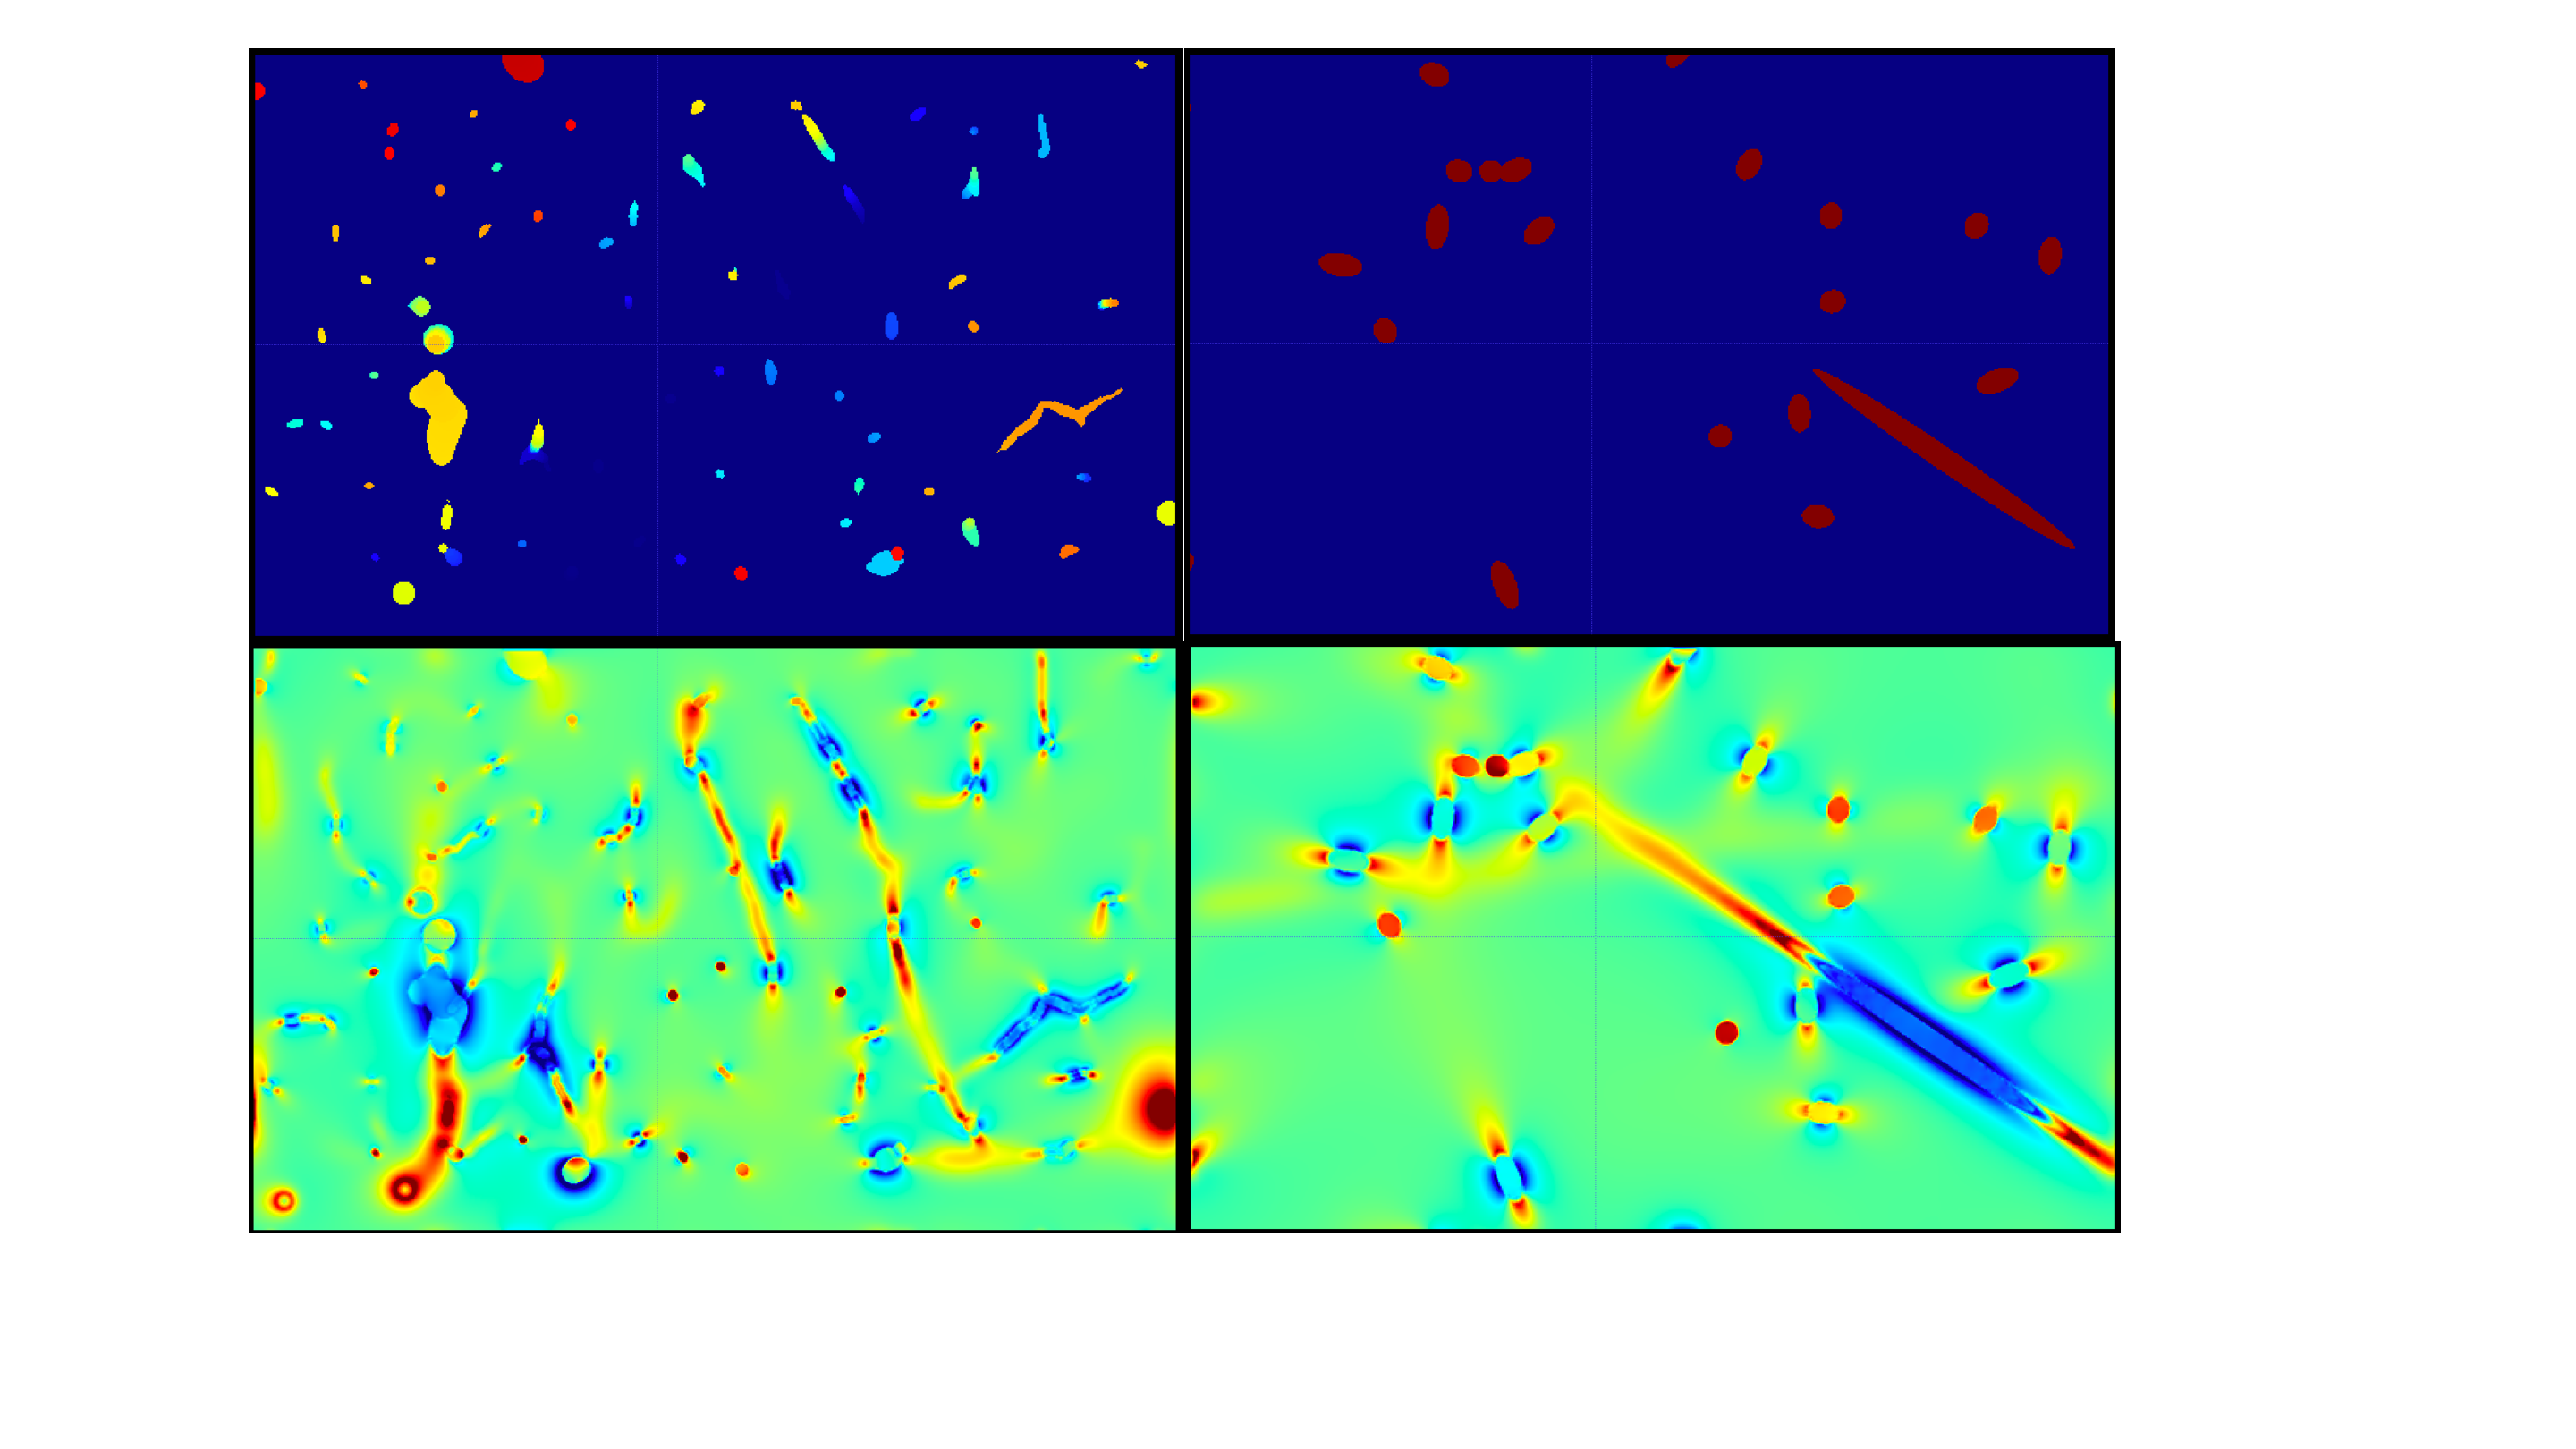
In our earlier work7, Monte Carlo ab initio simulations of the time evolution of the MR signal were designed, to include the most relevant details of the GESFIDE sequence timings and events, 90 and 180 RF pulses, crusher and readout gradients. 6 mouse brain angiograms obtained with two-photon microscopy were used as the substrate for the calculation of the MR signal due to protons diffusing by random walk. These angiograms had 1 um isotropic spatial resolution, occupied a volume of 0.27 ± 0.05 mm3 and the simulations were run at 200 us temporal resolution, at 7 Tesla. 107 protons were used. For each angiogram, 4 models of cylinders were defined, by replacing the real angiogram with cylinders of constant radius, and orientated either along each of 3 orthogonal directions (along B0, along the simulated crusher gradient and along the readout gradient) or by a set of ~40 cylinders with pseudorandom directions kept constant across the models (Fig 1, upper row). The radius (8.0 um), CBV (2.4%) and oxygen saturation (60%) for each cylinder model was set to the average value of the corresponding realistic angiogram, to an accuracy of about 1%. Note that these models all differ slightly due to the varying sizes of the angiograms along the 3 dimensions. The MR signal is the absolute value of the exponential of the phase contribution from all the protons, calculated with standard formulas1,5. Terms contributing to this phase are mainly due to the local magnetic (B) field seen by each proton (Fig 1, lower row), as well as terms for macroscopic B0 inhomogeneity, and the crusher and readout gradients. The contribution of superparamagnetic iron oxide nanoparticles (SPIONs) as a contrast agent was included, and both the pre-injection signal and the signal ratio of post-injection to pre-injection were studied. Note that simulated data during the 180 pulse were simply blanked out as these data points are not typically read by a scanner. Sensitivity of the following parameters was considered, for all the models, while keeping all the other parameters unchanged if possible (usually to a precision of 1% at worst): changes of 20% of mean oxygen saturation, mean radius, mean CBV, T2 in extravascular tissue, the diffusion constant, the SPION concentration, and capillary and vein hematocrits (only for real angiograms). The effect of changing B0 from 7T to 3T was also looked at, as well as an overall macroscopic B0 inhomogeneity.RESULTS
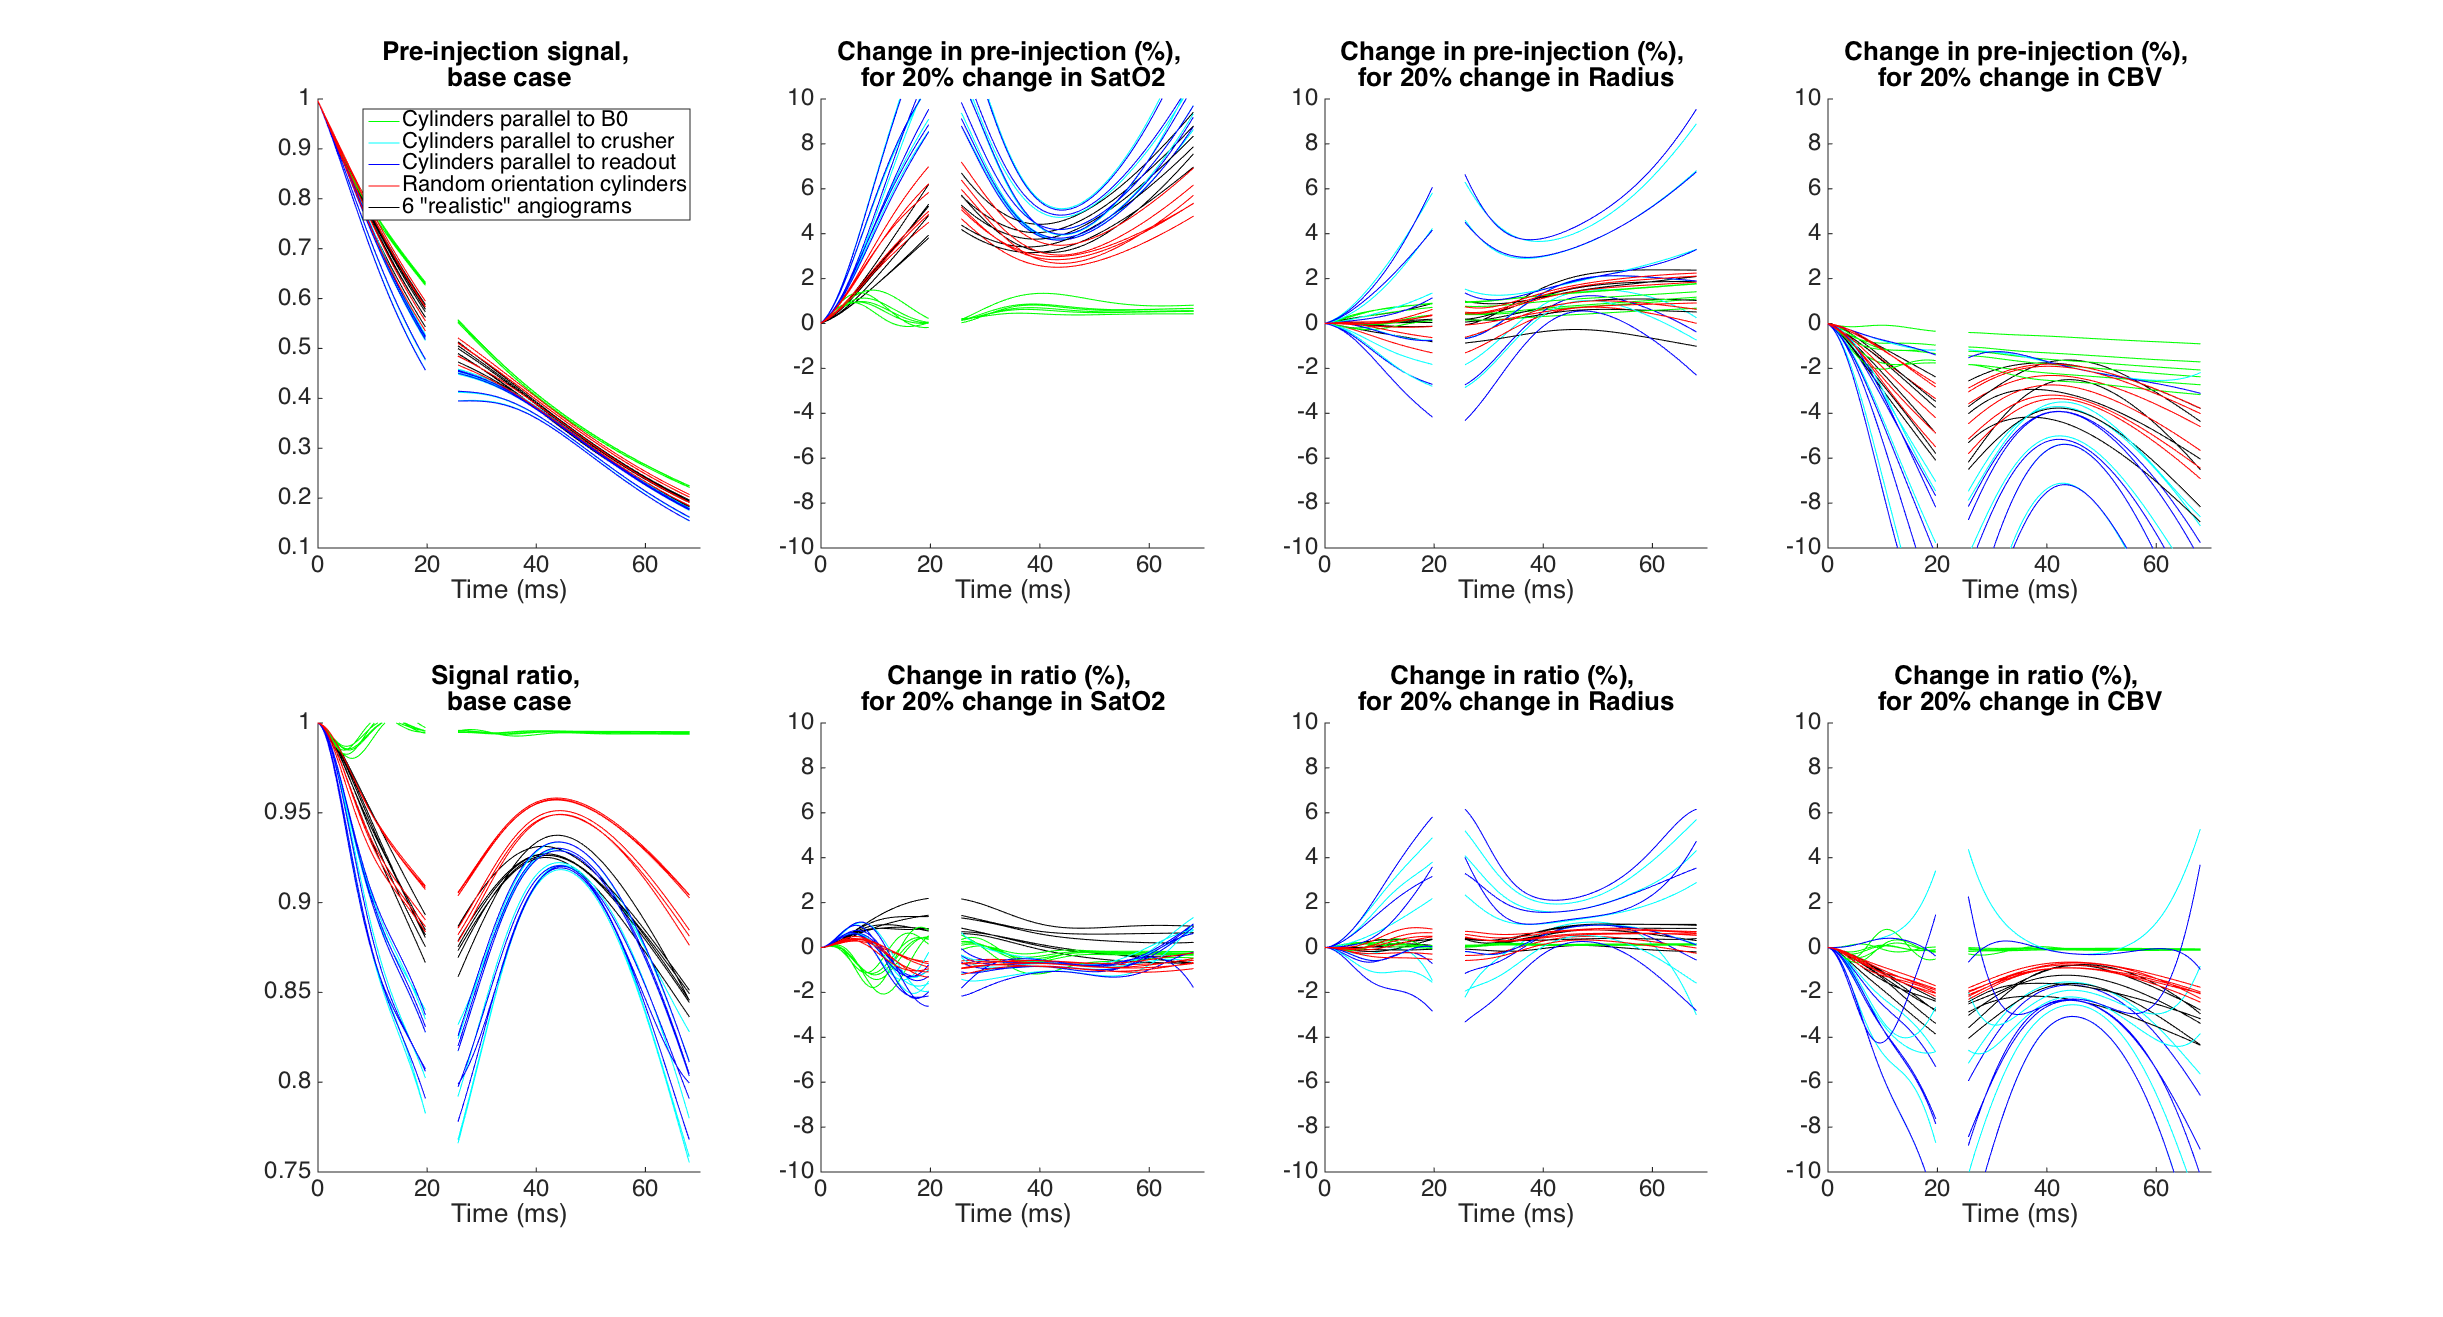
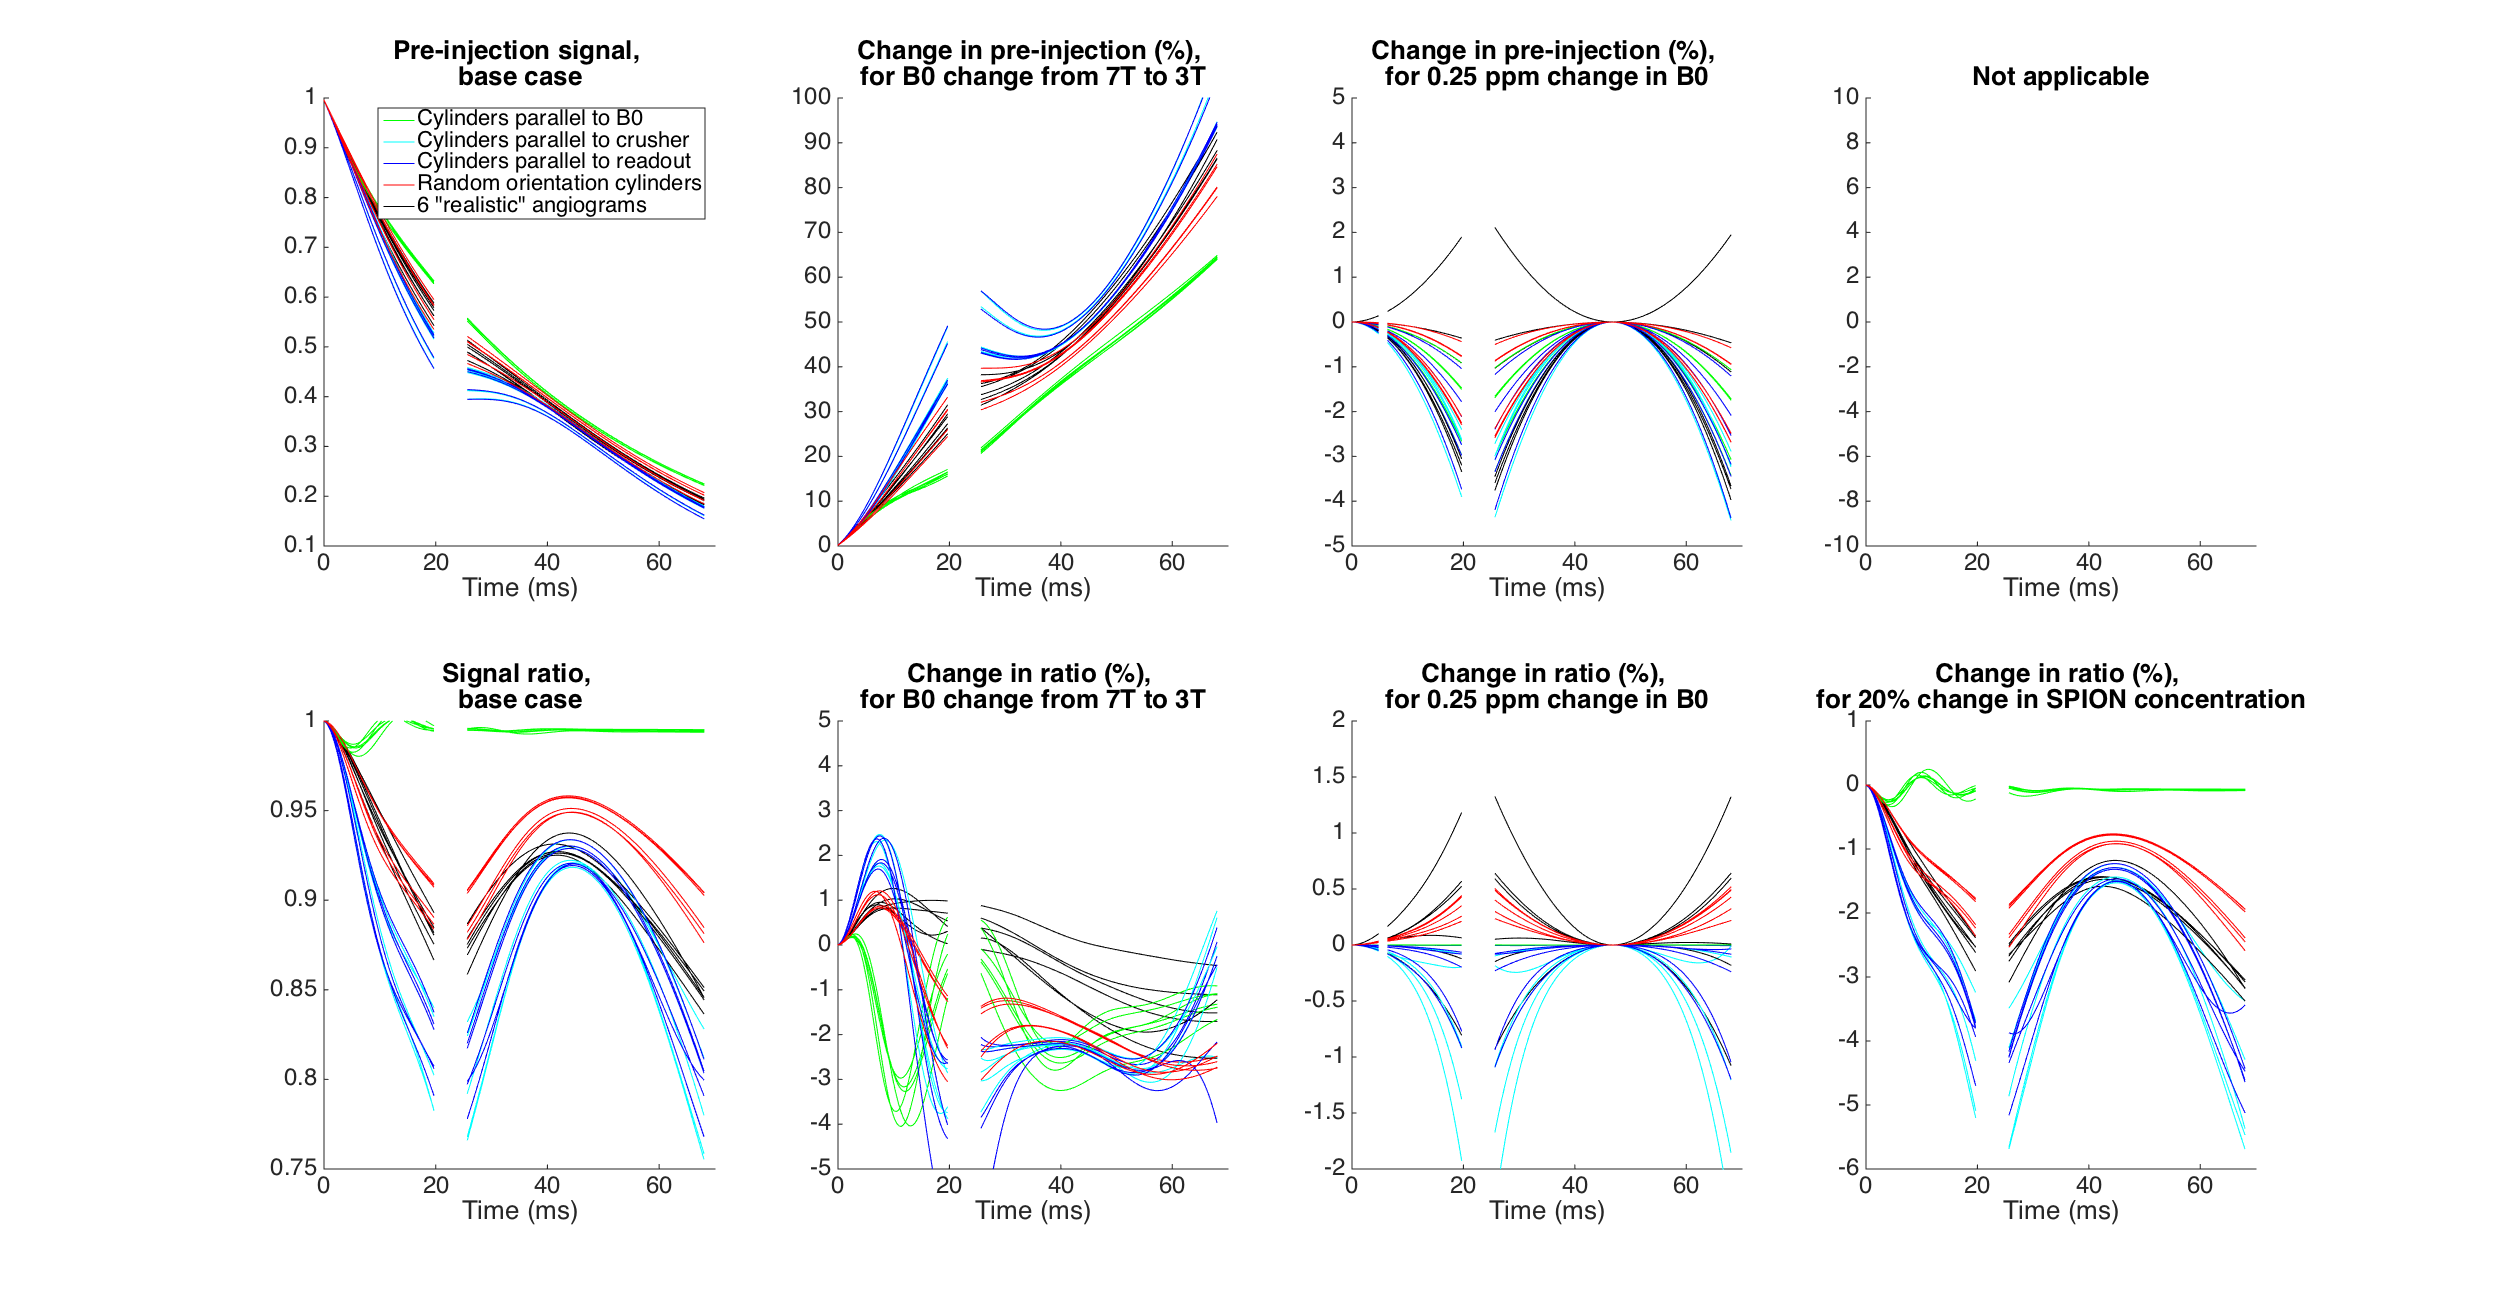
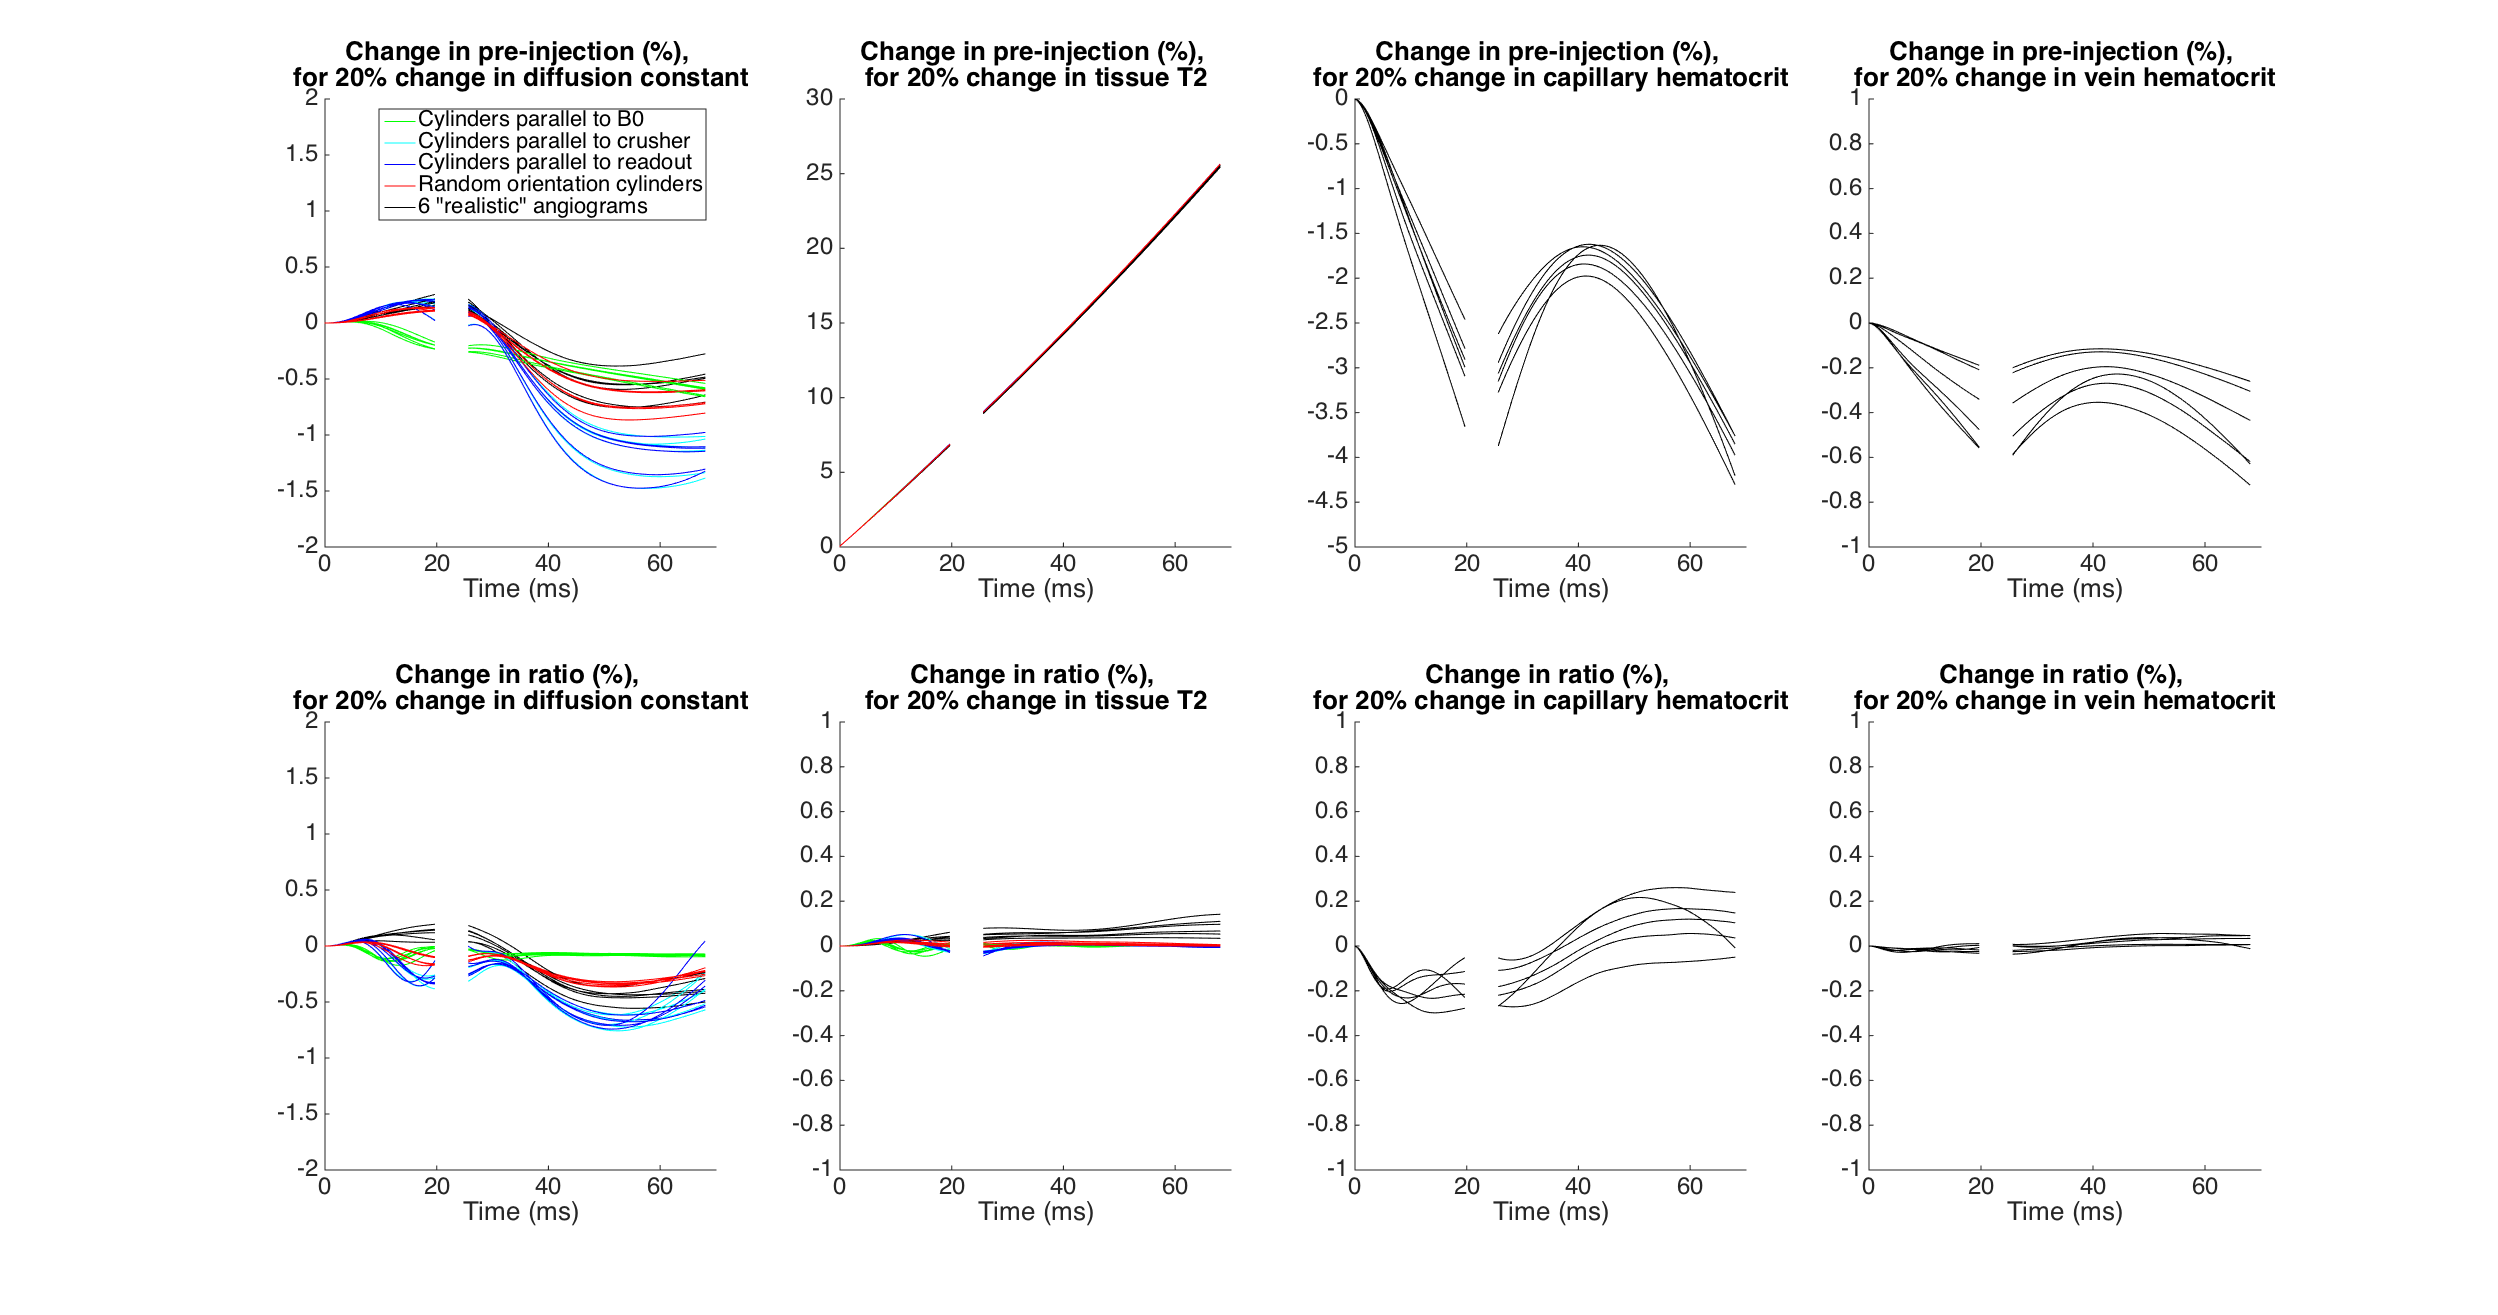
In general, simulation results are all different between the different angiograms and the different models of cylinders (Figs 2,3,4). The 3 sets of models of parallel cylinders produce extreme results, between which the angiogram and random cylinders results are found. We will then focus on comparing the 6 models of random cylinders with the 6 angiograms. Please see figure captions for details. An essential point is that for most of the parameters studied upon which the simulations depend, an attempt to extract the absolute value of such a parameter from experimentally measured GESFIDE MR signals will fail.DISCUSSION
While extracted parameters will generally be biased, the similarities in the signal sensitivities for some of the parameters of the different models suggest that perhaps correlations and differences of these extracted parameters could be used meaningfully.
Studying other MR sequences would be of interest.
The present charts generated with 107 protons were compared to charts with 2*105 protons and no visible differences were noted.
MR signals from random cylinders do not behave like an average of the signals from a number of realistic angiograms.
CONCLUSION
Sensitivities to parameters from simulations with random cylinders and angiograms generally follow similar patterns, but the actual signal values are different. In some instances, even the patterns differ substantially.
This suggests that much care should be used in interpreting MR measurements which are derived from experimental data combined with the use of MR signal simulations.
In future work, we will quantify how much of the signal differences between angiograms and cylinders is due to the heterogeneity in SatO2 values vs that in the vascular diameters.
Acknowledgements
This work was supported in part by an NSERC Discovery Grant, RGPIN-2014-06089, by CIHR Operating Grant 299166 and by R01-EB021018.References
1. Emblem, K. E. et al. Vessel calibre—a potential MRI biomarker of tumour response in clinical trials. Nat. Rev. Clin. Oncol. 11, 566–584 (2014).
2. Troprès, I. et al. Imaging the microvessel caliber and density: Principles and applications of microvascular MRI: MRI of the Microvessel Caliber and Density. Magn. Reson. Med. 73, 325–341 (2015).
3. Christen, T. et al. MR vascular fingerprinting: A new approach to compute cerebral blood volume, mean vessel radius, and oxygenation maps in the human brain. NeuroImage 89, 262–270 (2014).
4. Kiselev, V. G., Strecker, R., Ziyeh, S., Speck, O. & Hennig, J. Vessel size imaging in humans. Magn. Reson. Med. 53, 553–563 (2005).
5. Yablonskiy, D. A. & Haacke, E. M. Theory of NMR signal behavior in magnetically inhomogeneous tissues: The static dephasing regime. Magn. Reson. Med. 32, 749–763 (1994).
6. Boxerman, J. L., Hamberg, L. M., Rosen, B. R. & Weisskoff, R. M. MR contrast due to intravascular magnetic susceptibility perturbations. Magn. Reson. Med. 34, 555–566 (1995).
7. Gagnon, L. et al. Validation and optimization of hypercapnic-calibrated fMRI from oxygen-sensitive two-photon microscopy. Philos. Trans. R. Soc. B Biol. Sci. 371, 20150359 (2016).
Figures