1456
Epilepsy Surgery Followup: Resected Tissue Analysis and Classification1Department of Physics, University of São Paulo, Ribeirão Preto, Brazil, 2Clinical Hospital of the Faculty of Medicine, University of São Paulo, Ribeirão Preto, Brazil
Synopsis
Focal cortical dysplasia (FCD) is one of the main causes of refractory epilepsy. There is no self-sufficient method in order to evidence the presence and location of FCD, making complete diagnosis very difficult. Although some studies have addressed FCD identification, image texture is poorly explored. This study evaluated pre and post-surgical magnetic resonance images (MRI) of epilepsy patients in order to test Machine Learning classifiers and their ability to identify dysplasia using texture features and cortical thickness. Precision and recall scores suggest the capabilities of the proposed methodology in responding to the presence of FCD tissue.
Introduction
Focal Cortical Dysplasia (FCD) is the name used to refer to a dysmorphic neuronal tissue characterized by a number of features, with different clinical and surgical response 1,2. FCD is one of the main causes of refractory epilepsy 3, i.e. anti-epileptic drugs have little or no effect on the patients.
The present study describes the development of new methodologies of image processing resulting in contribution to the identification of FCDs, allowing better clinical analysis and more robust information to be used for surgical planning.
The objective of the study is to use features extracted from structures segmented in pre surgical magnetic resonance images (MRI) in order to classify those structures into healthy or damaged tissue, crossing the classification information with the suspect regions that were removed in the surgery to test the classification. Therefore, post-surgical images provide ground truth FCD identification and location of lesion regions.
Methods
We selected a total of 28 patients with refractory epilepsy that went through surgical intervention. All patients had both pre and post-surgical volumetric 3DT1 images acquired with a magnetic resonance imaging equipment model Achieve Extra Series (Philips, Best, Netherlands) with 3.0 T.
Pre-surgical images were segmented using the software 3D Slicer 4, with an atlas based full parcelation algorithm. We then extracted, from each segmented structure: variance, energy, entropy and homogeneity as defined by Haralick et al. 5, with mean intensity, standard deviation, skewness and kurtosis obtained from the histogram, and cortical thickness estimated as the maximum distance from a point of that structure to the nearest cortex border.
Through registration, post-surgical images were used to identify the resected region of the brain for each patient in the pre-surgical images, and all structures with a least a portion of its volume overlapping with the resected region were labeled as FCD tissue.
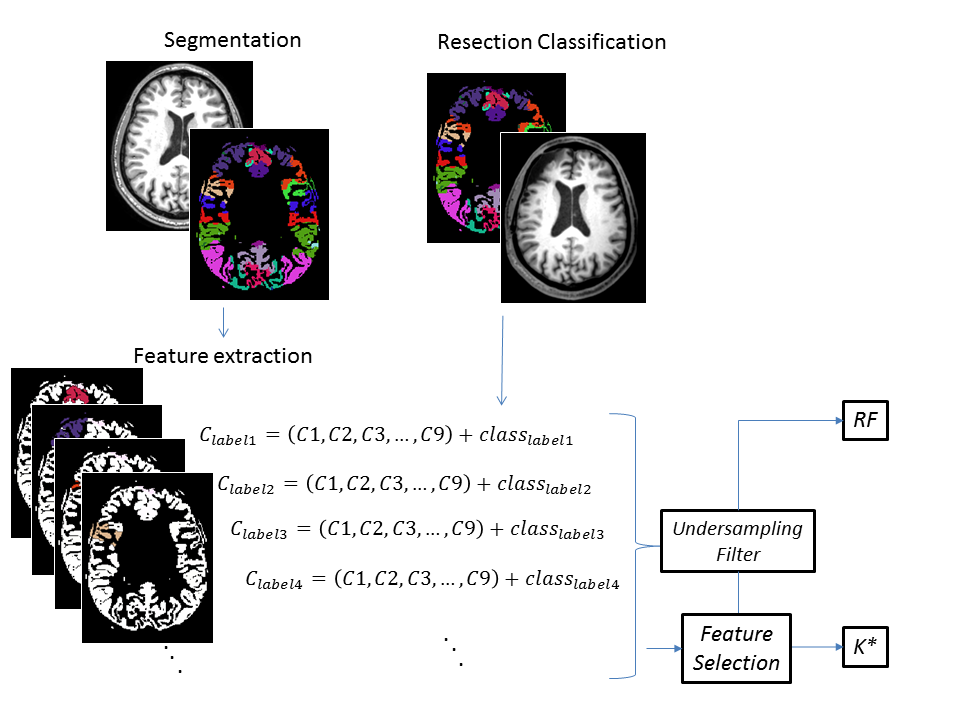
The 9 features and a flag for Positive or Negative presence of FCD for each of the segmented cortical structure compose a classification matrix (Figure 1).
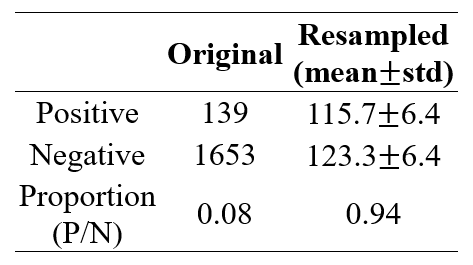
The matrix was partitioned to subsets in a balanced manner to treat the imbalanced class data problem 6,7, as the number of structures from the Positive class is far lower than the number of structures from the Negative class. The partitioning was used to generate 10 groups containing 15% of the original number of samples.
These groups were used to test the ability of the features to identify the presence of FCD using Machine Learning algorithms. The algorithms used were Random Forest (RF) 8 and K Star (K*) 9, using 10 fold cross validation method.
The metrics used for evaluating the performance of the classifiers were Precision and Recall $$Precision=TP/(TP+FP)$$ $$Recall=TP/(TP+FN)$$ where TP=True Positive, FP=False Positive and FN=False Negative.
For the use of the K* classifier, the obtained matrixes were filtered to avoid features with high correlation between each other. The process of elimination of high correlated features is better explained in Results section. Due to the nature of the Random Forest classifier, no feature selection was needed prior to the classification. The entire method is illustrated in Figure 1.
Results
Figure 2 shows class imbalance filter results.
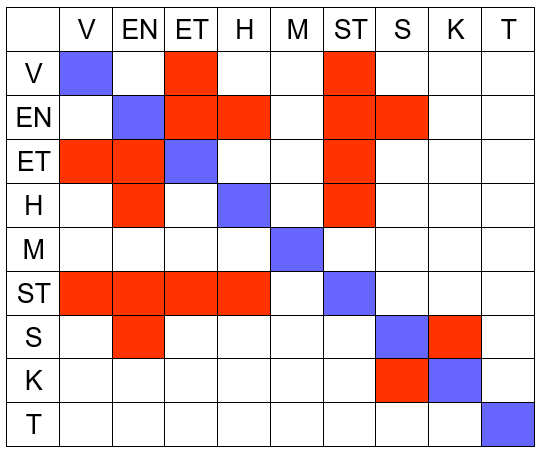
Using the results presented on Figure 3, we chose a set of features that do not have high correlation with each other to be used for K* classification: Entropy, Homogeneity, Mean Intensity, Kurtosis and Cortical Thickness.
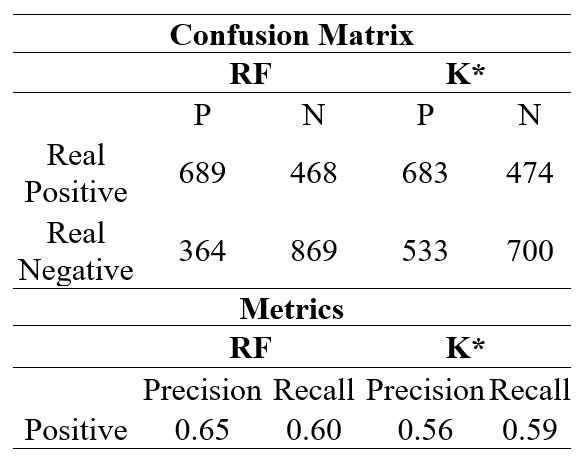
Classification results are presented in Figure 4.
Discussion and Conclusion
Given the Precision and Recall are bigger than 0.5, the results suggest these features are reflecting the presence of FCD in the resected region, with the RF classifier performing a little better than the K* classifier.
The values for precision and recall scores of the evaluated classifiers indicates the possibility of classification using feature extraction on segmented cortical structures, despite the existence of limitations on the presented method.
The use of the resected region as reference may lead to incorrect classification, as the resected region may contain healthy cortical tissue. Furthermore, the use of features extracted for entire cortical structures may lead to small changes in feature that are not representative enough to be distinguished by the classifier, since the volume of the cortical structures is often far greater than the volume of the FCD.
Although normalization and mean removal were applied on the data, it is possible that some patient dependent characteristic of the features extracted are still present. Further investigation is needed in order to apply data classification to test sets containing only data for one patient, without any data from that patient being used on training.
Acknowledgements
The authors would like to thank CAPES and CNPQ for financial support and CIREP for making the data available in accordance to the rules of ethic committee of the HCRP-USP.References
1. N. Colombo, L. Tassi, C. Galli, A. Citterio, G. Lo Russo, G. Scialfa, and R. Spreafico, “Focal cortical dysplasias: MR imaging, histopathologic, and clinical correlations in surgically treated patients with epilepsy.,” AJNR. Am. J. Neuroradiol., vol. 24, no. 4, pp. 724–33, Apr. 2003.
2. M. Hildebrandt, T. Pieper, P. Winkler, D. Kolodziejczyk, H. Holthausen, and I. Blümcke, “Neuropathological spectrum of cortical dysplasia in children with severe focal epilepsies,” Acta Neuropathol., vol. 110, no. 1, pp. 1–11, Jul. 2005.
3. P. Krsek et al., “Different features of histopathological subtypes of pediatric focal cortical dysplasia.,” Ann. Neurol., vol. 63, no. 6, pp. 758–69, Jun. 2008.
4. S. Pieper, “3D Slicer,” in Proc IEEE Int Symp Biomed Imaging, 2004, vol. 2, pp. 632–635.
5. R. Haralick, K. Shanmugam, and I. Dinstein, “Textural features for image classification,” IEEE Trans. Syst. Man. Cybern. vol. 3, no. 6, pp. 610-21, 1973.
6. N. Japkowicz, “Learning from imbalanced data sets: a comparison of various strategies,” AAAI Work. Learn. from Imbalanced Data Sets, pp. 10–15, 2000.
7. J. Van Hulse, T. M. Khoshgoftaar, A. Napolitano, and R. Wald, “Feature selection with high-dimensional imbalanced data,” ICDM Work. 2009 - IEEE Int. Conf. Data Min., pp. 507–514, 2009.
8. L. Breiman, “Random forests,” Mach. Learn., pp. 5–32, 2001.
9. J. G. Cleary and L. E. Trigg, “K*: An Instance-based Learner Using an Entropic Distance Measure,” Mach. Learn. Work. Then Conf., vol. 5, pp. 1–14, 1995.
Figures