1455
Automatic nonlinear transformation of 7T MRI brain image to Talairach stereotaxic space1Cleveland Clinic, Cleveland, OH, United States
Synopsis
Transforming MRI brain images into Talairach space will greatly facilitate the comparison of neuroimaging research results across subjects and applications of atlas to research subjects and clinical patients. We developed an automatic processing pipeline based on nonlinear registration to transform 7T MRI brain images to Talairach space. The pipeline utilized matching scores derived from brain parcellation for quality assurance (QA). The pipeline was tested on subjects including five controls, three MS patients and three ALS patients. The results showed that the method generated better results than the automatic Talairach transformation provided by AFNI. The QA scores were also comparable to those computed from 3T MRI brain images in our previous study.
Introduction
Transforming MR brain images into Talairach space will greatly facilitate the comparison of neuroimaging research results across subjects and applications of atlas to research subjects and clinical patients. The original Talairach transformation used manually identified landmarks and piece-wise linear transformations1. Revised Talairach transformations were developed to automatically identify landmarks and to apply improved transformation for better accuracy2,3. An alternative solution has also been invented to transform brain images from MNI space to Talairach space4,5. The methods mentioned above are all linear based and their limited degree of freedom restricts the accurate matching of brains from multiple subjects in the Talairach space. Nonlinear methods provide much higher degree of freedom and thus have the potential to make a better matching in the Talairach space. However, on the other hand, the exact same freedom can potentially lead to bigger mismatch. To take the advantage and avoid the pitfall, we developed an automatic processing pipeline based on nonlinear registration to transform brain images to Talairach space. The pipeline depended on matching scores derived from brain parcellation for quality assurance (QA). We had tested the pipeline on 3T MRI data in previous study6. In this study, we tested an updated version of the pipeline on 7T MRI data.Methods
Data Collection
Five healthy controls, three multiple sclerosis (MS) patients and three amyotrophic lateral sclerosis (ALS) patients were scanned under an IRB-approved protocol on a 7T Siemens scanner (Erlangen, Germany). For T1-weighted data acquisition, magnetization-prepared 2 rapid acquisition gradient echoes (MP2RAGE; sagittal orientation) WIP (WIP 900, Siemens) was used. The scan parameters were as follows: 192 slices, resolution = 0.75 mm3-isotropic, TR/TE = 6000/3.0 ms, TI1/TI2 = 700/2700 ms, flip angle = 4°/5°, GRAPPA factor = 3 and scan time = 9.58 min.
Data Analysis
Data was processed through the pipeline in four steps. In step 1), subject’s brain image was registered to a Talairach template using symmetric image normalization (Syn) in Advanced Normalizaiton Tools (ANTS) 7 after brain extraction by FSL8. The Talairach template was generated by transforming a typical health control’s brain (outside testing dataset) using the manual Talairach procedure in AFNI9. In step 2), we used FreeSurfer10 to segment the subject’s brain into 35 ROIs in cortical gray matter, 36 ROIs in white matter and 8 ROIs in subcortical gray matter for both hemispheres. Brain parcellation was also applied to the Talairach template. In step 3), The ROIs in each of the above sections are converted into Talairach space by using the registration transformation obtained in step 1). In step 4), we computed Dice coefficient and volume ratio to measure the volume overlapping of the registered ROIs to the Talairach template ROIs.
Method Comparison
The parcellated brains generated in step 2) are also transformed into Talairach space by auto Talairach conversion provided by AFNI and overlapping scores were calculated. In AFNI’s auto Talairach conversion process, the same extracted brains by FSL were used and AFNI’s brain extraction step was skipped.
Results
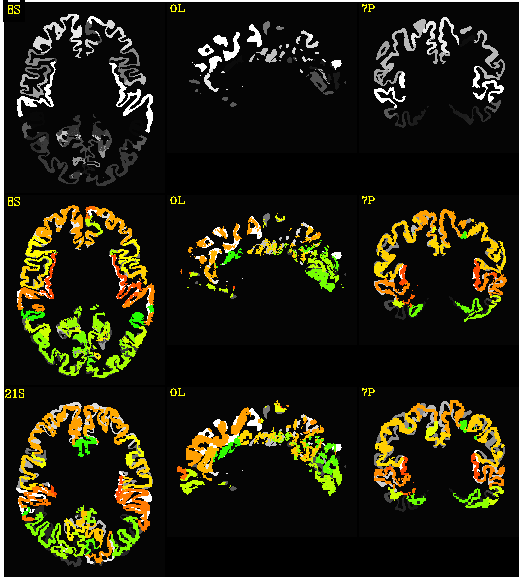
Qualitative and quantitative results are shown in figure 1 and figure 2 respectively. Figure 1 shows the cortical ROIs of the Talairach template brain and the Talairach transformed cortical ROIs of a control subject. The first row shows the cortical ROIs of the Talairach template. Second row and third row show the cortical ROIs of the control subject transformed in Talairach coordinates by ANTS and AFNI respectively in color, overlapping on the Talairach template. The figure clearly demonstrates the second row ROIs produced by ANTS has better matching than the third row ROIs generated by AFNI. The QA scores, as the quantitative matching measure for controls and patients are shown in the table of figure 2. The 7T nonlinear pipeline is substantially better than the automatic Talairach transformation provided in AFNI for all brain regions.Conclusion and discussion
We have presented a processing pipeline to automatically transform 7T brain images from individual subjects into Talairach space with automatically generated quality assurance scores. Results on five normal controls, three MS patients and three ALS patients all showed the update pipeline was on par with the 3T results presented previously and was substantially better than the automatic Talairach method provided by AFNI.
We considered the brain parcellation results from FreeSurfer as the “gold standard” and relied on it to compute QA scores in this study. Current version of FreeSurfer and AFNI do not have ability to process voxel size of 0.75 mm3-isotropic. Resolution was downgraded to 1.0 mm3-isotropic in all processing steps except nonlinear registration and transformation using ANTS.
Acknowledgements
This work was supported by the Imaging Institute, Cleveland Clinic.
Authors acknowledge technical support by Siemens Medical Solutions.
References
[1] Talairach J, Tournoux P (1988) , New York; Stuttgart-New York.
[2] Collins DL, et al.(1994) , J Comput Assist Tomogr. 18(2):192-205.
[3] Nowinski WL, et al. (2006), J Comput Assist Tomogr. 30(4):629-641.
[4] Brett M, et al. (2001), NeuroImage 13(6):S85.
5] Lancaster JL, et al. (2007), Bias. Hum Brain Mapp. 28(11):1194-1205
[6] Li M, et al. (2013), Salt Lake City, Utah.
[7] Avants BB, et al. (2008), Med Image Anal 12(1):26-41. .
[8] Jenkinson M, et al. (2012), NeuroImage. 62(2):782-790.
[9] Cox RW.(2012), NeuroImage. 62(2):743-747.
[10] Fischl B (2012), NeuroImage. 62(2):774-781.
Figures