1448
QEMDIM : Quality Evaluation using Multi-DIrectional Filter for no-reference MR image1School of Electrical and Electronic Engineering, Yonsei University, Seoul, Korea, Republic of
Synopsis
This paper proposes a new image quality assessment (IQA) for no-reference MRI, Quality Evaluation using Multi-DIrectional filters for MRI (QEMDIM), that is obtained from difference of statistical features between test images and numerous pre-scanned images in Mean Subtracted Contrast Normalization (MSCN) coefficient and Multi-Directional Filtered Coefficients (MDFC). the proposed method is capable of detecting various types of artifact and can be applied to clinical applications as well as being used to evaluate the performance of MRI hardware and software
Introduction
Evaluation of the overall quality of MR images is a difficult task because there are so many factors to affect the MR image reconstruction. These factors can generate various types of distortions which degrade image quality and prevent clinicians from diagnosis. Moreover, it is more difficult to evaluate in vivo images because there are no reference images to compare with them. Therefore, it is important to accurately evaluate the overall quality of no reference-MR, which is image quality assessment (IQA). Generally, automatic IQA methods can be classified into two types: full-reference (FR) IQA and no-reference (NR) IQA1. One of the NR-IQA methods is image statistics-based2 techniques used, which is known as one of the most accurate method. The results of Statistics-based IQA are obtained from a difference of quality-aware features between undistorted images and testing (distorted) image in various domain such as wavelet3, DCT4 and spatial domain5, 6. In this abstract, we propose a new NR-IQA method for MRI, Quality Evaluation using Multi-DIrectional filters for MRI (QEMDIM), using spatial domain. The quality-aware features are obtained in mean subtracted contrast normalization (MSCN) and multi-directional filtered coefficients (MDFC). The quantitative correlation values of QEMDIM are higher than 0.96 with FR-IQAs into synthetically distorted images. In addition, comparing QEMDIM with subjective scoring of in vivo images, the results of correlation were higher than those of conventional NR-IQAs.Methods
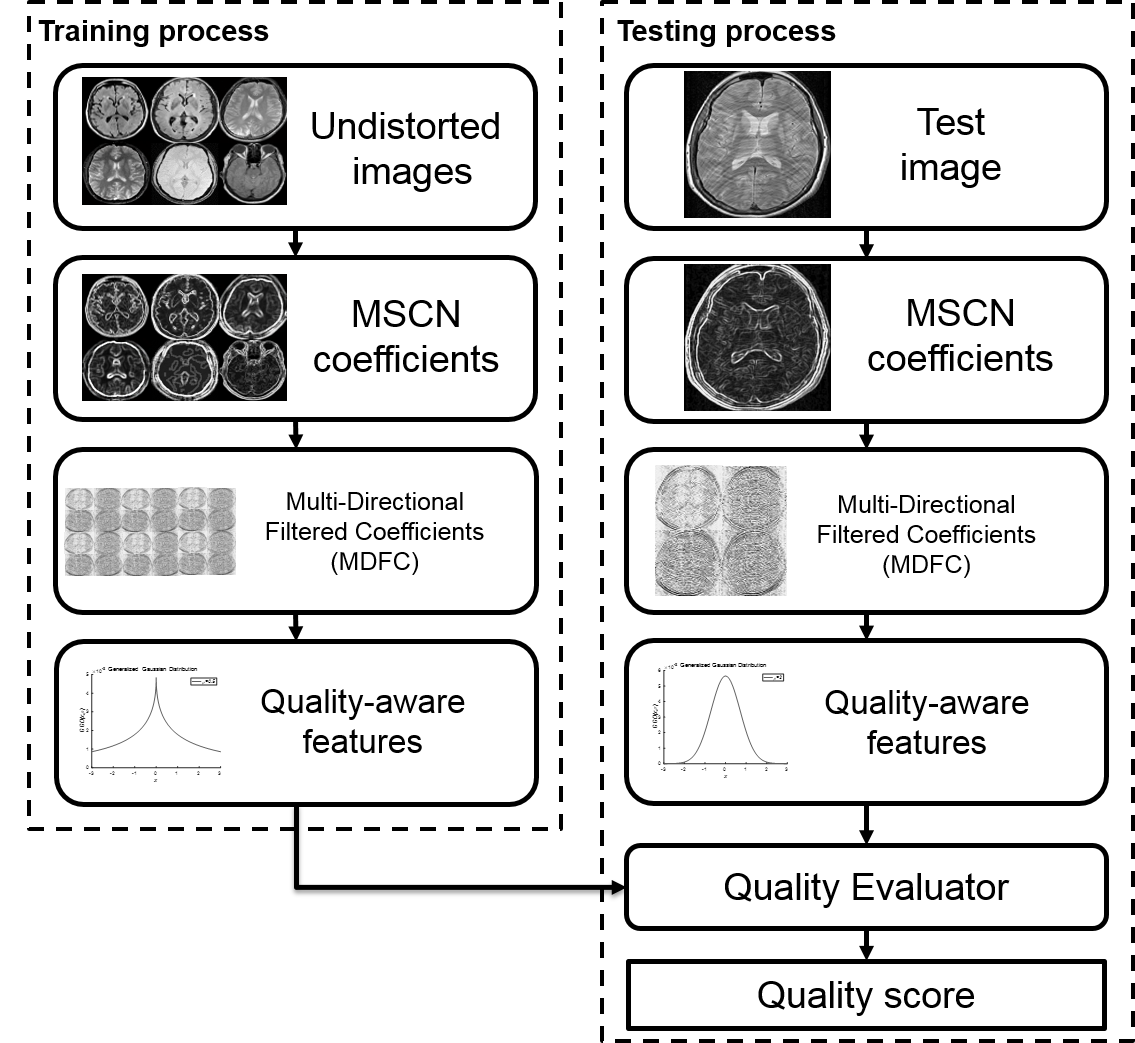
MR image statistics represent that the energy spectrum of MSCN coefficients have the form of a generalized Gaussian distribution (GGD).7 $$f(x;\alpha,\beta)=\frac{\alpha}{2\beta\Gamma(1/\alpha)}exp\left(-\left(\frac{\mid x\mid}{\beta}\right)^\alpha\right)$$ $$$\alpha$$$ and $$$\beta$$$ are the shape parameters of the GGD function. Each energy spectra of undistorted and distorted image have a different shape parameter. For example, the spectrum of Gaussian noise is wider than that of undistorted image. These differences can be obtained by fitting the spectrum to GGD function. We define the shape parameters as the quality-aware features. The relationship between these parameters is $$\beta=\sigma\sqrt{\frac{\Gamma(1/\alpha)}{\Gamma(3/\alpha)}}$$ Here, $$$\sigma$$$ is the standard deviation and $$$\Gamma(x)$$$ is the Gamma function $$\Gamma(x)=\int_{0}^{\infty}t^{x-1}e^{-t}dt,\space\space\space x>0$$ MSCN coefficients, the truly spatial domain, are more perception-friendly domain and have low computation time than co-ordinate domain such as wavelet and DC. The MSCN coefficient is $$\hat{I}(x,y)=\frac{I(x,y)-\mu(x,y)}{\sigma(x,y)+C}$$ where $$$x\in\left\{1,2,3,...,N\right\}$$$ and $$$y\in\left\{1,2,3,...,M\right\}$$$ are spatial indices and $$$I(x, y)$$$ is magnitude of the image. The terms $$$\mu$$$ and $$$\sigma$$$ are mean and standard deviation of $$$I(x, y)$$$. The quality-aware features are obtained in MSCN coefficients using generalized Gaussian ration (GGR) function7, which is made up of the shape parameters. The MSCN coefficients can detect non-directional distortions because of their 2D-circle subtraction. However, the common distortions in MRI like motion artifact have directional structure. Therefore, we propose multi-directional filtered coefficients (MDFC) for evaluation of directional distortions. MDFCs are calculated from various steps. Firstly, we make multi-directional filters, $$$W_{G}$$$ , a 2D Gaussian low-pass filter. Next multi-directional gradient vectors can be defined as $$HD_{1}=\begin{bmatrix}-1&1\end{bmatrix},HD_{2}=\begin{bmatrix}-1&1\end{bmatrix}^T,HD_{3}=\begin{bmatrix}-1&0\\0&1\end{bmatrix},HD_{4}=\begin{bmatrix}0&-1\\1&0\end{bmatrix}$$ $$$HD_{1}$$$, $$$HD_{2}$$$, $$$HD_{3}$$$, $$$HD_{4}$$$ are vertical, horizontal, and two diagonal gradient filters, respectively. Multi-directional filters are generated by convolution between $$$HD_{k}$$$ and $$$W_{G}$$$ $$DF_{k}=W_{k}*HD_{k}$$ From above equation, multi-directional filters $$$DF_{k}$$$ are generated and convoluted with the MSCN coefficients Finally, MDFC coefficients are calculated from $$FC_{k}=M(x,y)*DF_{k}(n,m)$$ Since directional coefficients have GGD regularity9, the quality-aware features can be extracted from MDFCs. A total of 10 parameters, 2 shape parameters form the MSCN coefficients and 8 shape parameters from four regions of MDFCs are obtained from one patched image.
The quality evaluator is calculated from $$$D=\sqrt{(P_{r}-P_{e})^T(P_{r}-P_{e})}$$$ where $$$P_{r}$$$ and $$$P_{e}$$$ are the quality-aware features of the training databases and distorted images, respectively. In our experiments, database was provided T2-FLAIR brain images from ADNI8. Figure 1 shows entire processes of QEMDIM.
Results
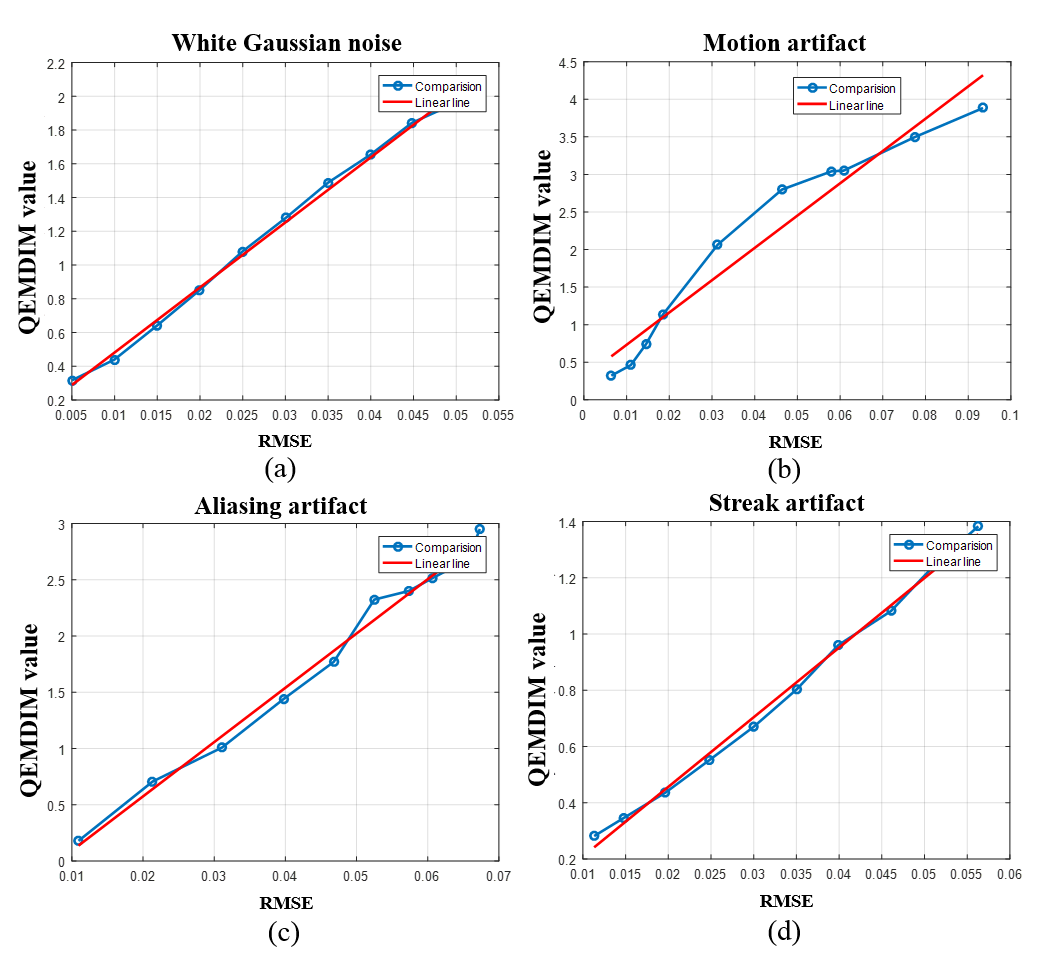
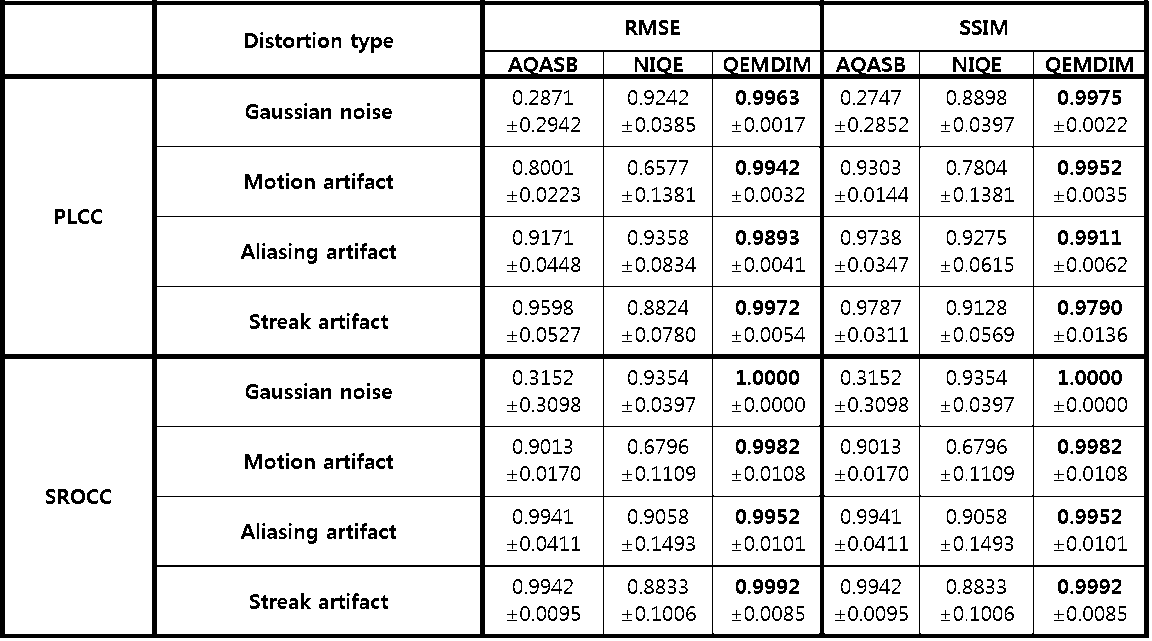
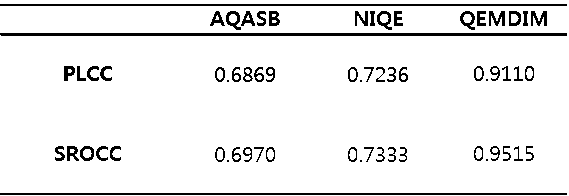
Total 2000 subjects were used as training databases and 100 subjects as testing data. The matrix size was 256X256 and TR=9000ms, TE=50ms, and FA=150. To assess performance of QEMDIM, each 10 synthetically distorted images, gaussian noisy (SNR=46~26dB), motion artifacts (motion ratio 5%~50% of total acq. Time), aliasing artifact and streak artifact (reduction factor=1.3~4), were used for IQA in each T2-FLAIR images. The results of conventional NR-IQAs (AQASB10, NIQE6) and QEMDIM were correlated with FR-IQAs (RMSE, SSIM) using PLCC and SROCC. Figure 2 and 3 shows that results of QEMDIM have linear correlation with FR-IQAs and Figure 4 shows that the performances of QEMDIM are higher than other NR-IQAs in all-types of distortions. Figure 5 also shows that the results of QEMDIM are higher than other NR-IQA in correlation with subjective scoring which is evaluated by 9 researchers into 10 in vivo images.Acknowledgements
This research was supported by the National Research Foundation of Korea (NRF) grant funded by the Korean government (MSIP) (2016R1A2R4015016).References
1. E. P. Simoncelli and B. A. Olshausen, “Natural image statistics and neural representation,” Annu. Rev. Neurosci., vol. 24, no. 1, pp. 1193–1216, 2001.
2. Z. Wang and A. Bovik, “Reduced- and No-Reference Image Quality Assessment,” IEEE Signal Process. Mag., vol. 28, no. 6, pp. 29–40, Nov. 2011.
3. A. K. Moorthy and A. C. Bovik, “Blind Image Quality Assessment: From Natural Scene Statistics to Perceptual Quality,” IEEE Trans. Image Process, vol. 20, no. 12, pp. 3350–3364, Dec. 2011.
4. M. A. Saad, A. C. Bovik, and C. Charrier, “Blind Image Quality Assessment: A Natural Scene Statistics Approach in the DCT Domain,” IEEE Trans. Image Process., vol. 21, no. 8, pp. 3339–3352, Aug. 2012.
5. A. Mittal, A. K. Moorthy, and A. C. Bovik, “No-Reference Image Quality Assessment in the Spatial Domain,” IEEE Trans. Image Process., vol. 21, no. 12, pp. 4695–4708, Dec. 2012.
6. A. Mittal, R. Soundararajan, and A. C. Bovik, “Making a 'Completely Blind' Image Quality Analyzer,” IEEE Signal Process. Lett., vol. 20, no. 3, pp. 209–212, Mar. 2013.
7. K. Sharifi and A. Leon-Garcia, “Estimation of shape parameter for generalized Gaussian distributions in subband decompositions of video,” IEEE Trans. Circuits Syst. Video Technol., vol. 5, no. 1, pp. 52–56, Feb. 1995.
8. C. Jack, M. Bernstein, N. Fox, P. Thompson, G. Alexander, D. Harvey, B. Borowski, P. Britson, J. L. Whitwell, C. Ward, A. Dale, J. Felmlee, J. Gunter, D. Hill, R. Killiany, N. Schuff, S. Fox-Bosetti, C. Lin, C. Studholme, C. DeCarli, Gunnar Krueger, H. Ward, G. Metzger, K. Scott, R. Mallozzi, D. Blezek, J. Levy, J. Debbins, A. Fleisher, M. Albert, R. Green, G. Bartzokis, G. Glover, J. Mugler and M. Weiner, "The Alzheimer's disease neuroimaging initiative (ADNI): MRI methods", J. Magn. Reson. Imaging, vol. 27, no. 4, pp. 685-691, 2008.
9. L. Liu, Y. Hua, Q. Zhao, H. Huang, and A. C. Bovik, “Blind image quality assessment by relative gradient statistics and adaboosting neural network,” Signal process-image commun., vol. 40, pp. 1–15, 2016.
10. B. Mortamet, M. A. Bernstein, C. R. Jack, J. L. Gunter, C. Ward, P. J. Britson, R. Meuli, J.-P. Thiran, and G. Krueger, “Automatic quality assessment in structural brain magnetic resonance imaging,” Magn. Reson. Med., vol. 62, no. 2, pp. 365–372, 2009.
Figures