1447
Harmonization for cortical thickness across sites in multi-center MRI study1Brain Decoding Research Center, Northwestern Polytechnical University, Xi'an, People's Republic of China, 2Department of Diagnostic Radiology, the First Affiliated Hospital of Xi’an Jiaotong University, Xi’an, People's Republic of China, 3MR Research China, GE Healthcare, Beijing, People's Republic of China, 4Department of Radiology, Xijing Hospital, the Fourth Military University, Xi'an, People's Republic of China, 5Department of Diagnostic Radiology, Xi'an Children Hospital, Xi’an, People's Republic of China, 6Department of Radiology, Xi'an Gaoxin Hospital, Xi'an, People's Republic of China, 7CT MR Department, the People's Hospital of Shaanxi Province, Xi'an, People's Republic of China
Synopsis
Cerebral cortex encodes crucial information of brain development, cytoarchitecture and function. However, varying data acquisition conditions at different centers could hamper group-wisely statistical analysis. This study aims to test the consistency of cortical thickness in the human brain across four sites and harmonize the deviations. Our results showed that variation of cortical thickness across sites were regionally independent, and deviation across centers could be reduced by linear regression method at a global scale, while the variations across subjects were well preserved. Those results suggest that our method has the promise in harmonizing cortical thickness measures in multi-center study.
Introduction
Crucial information of brain development1, cytoarchitecture2, and cognitive functioning3 are embedded in cerebral cortex. Cortical features, such as thickness, are thus of great research and clinical interest. However, the availability and launch of numerous projects based on multi-center magnetic resonance imaging (MRI) datasets4 give rise to the problem that varying MRI data acquisition conditions due to the equipment and environment setting could hamper conducting a direct study on these datasets in a group-wise manner. Although many previous studies can be found in the literatures which studied image-based consistency in multi-center datasets and proposed methods to harmonize the deviation5, few works were reported to focus on more sophisticated morphological features of brain structures. This work aims to study the impact of the cross-center impact on cortical thickness derived from T1-weighted MRI data and propose a method to harmonize the deviation and enhance the reliability of multi-center studies on cortical thickness.Methods
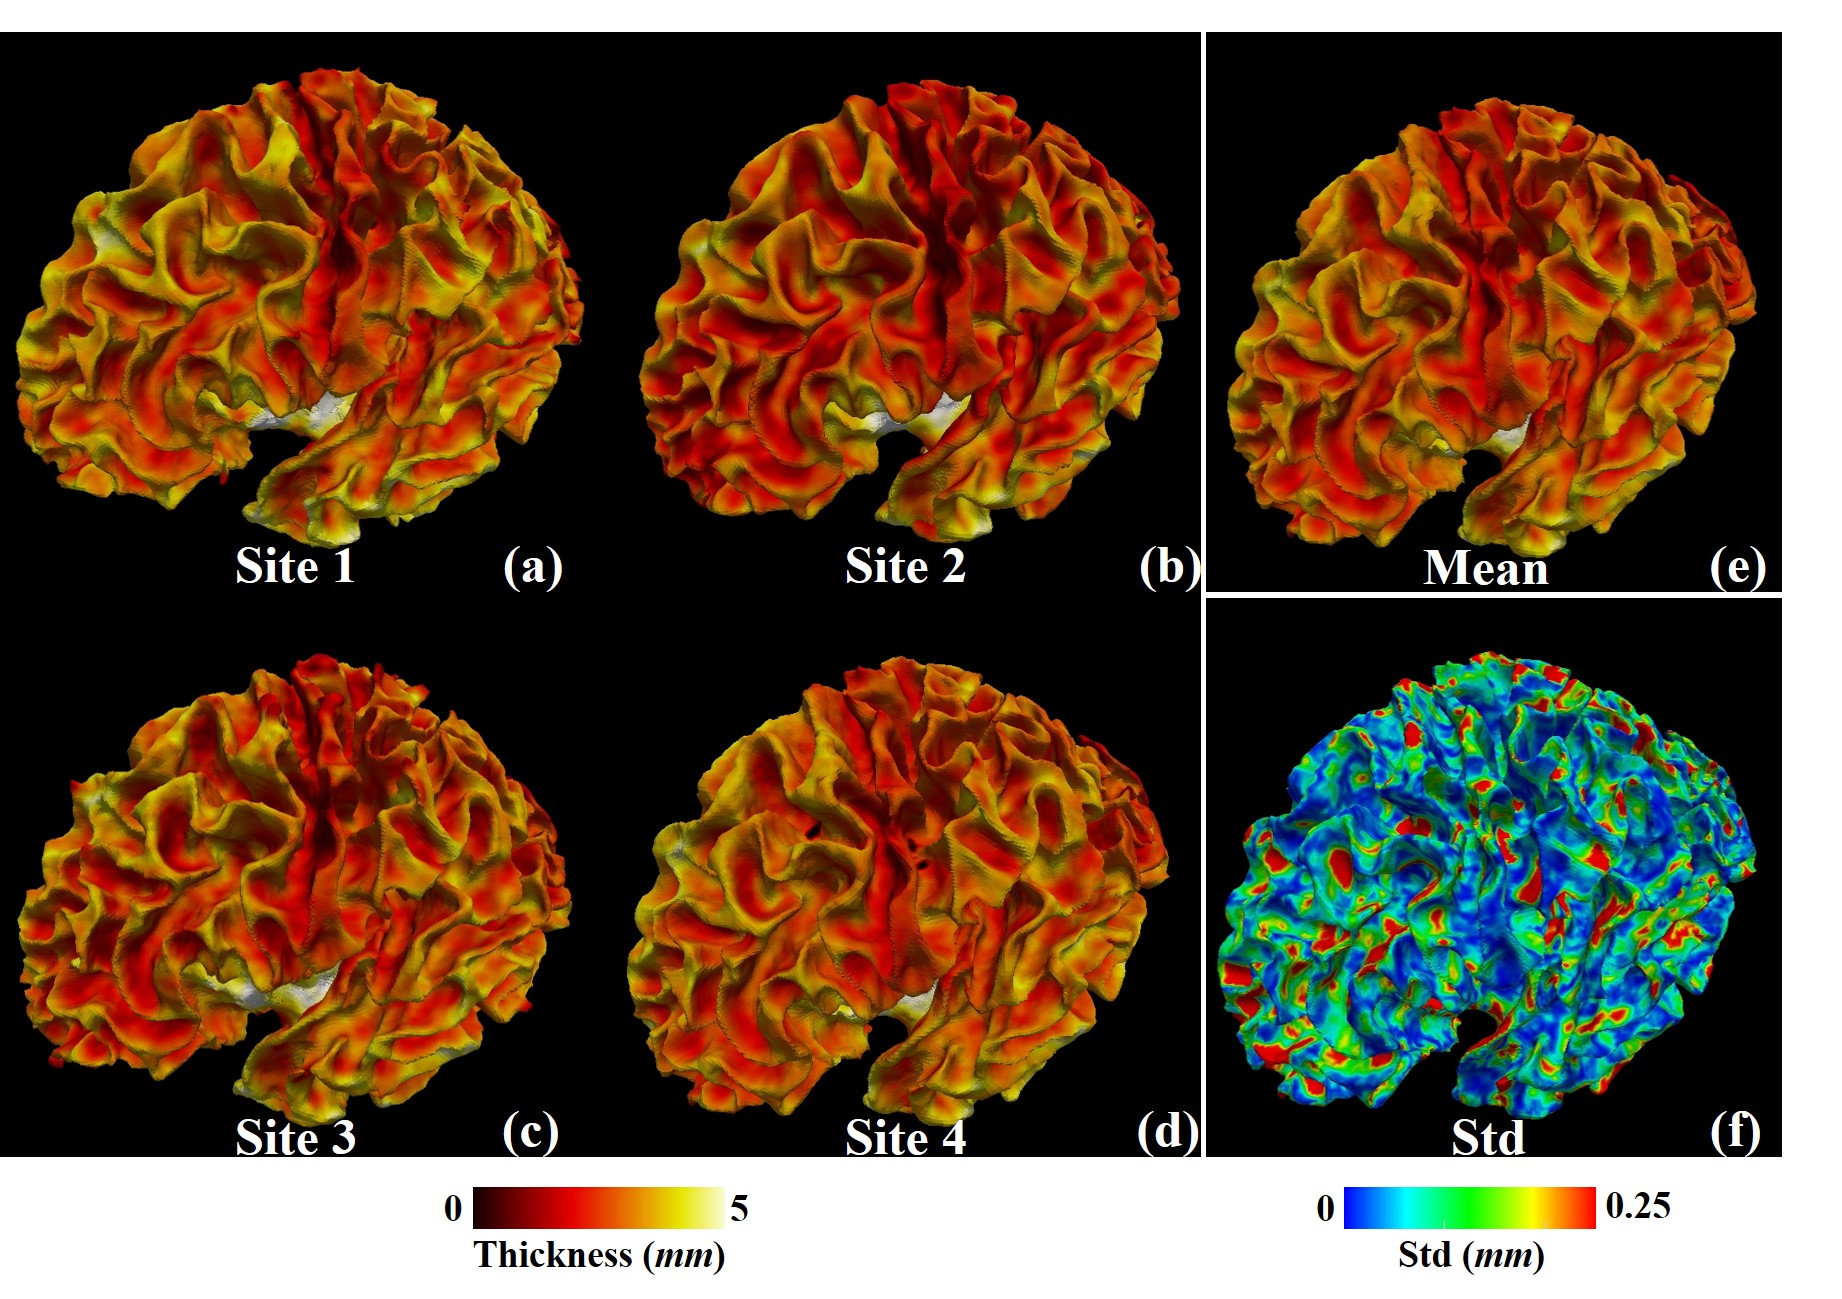
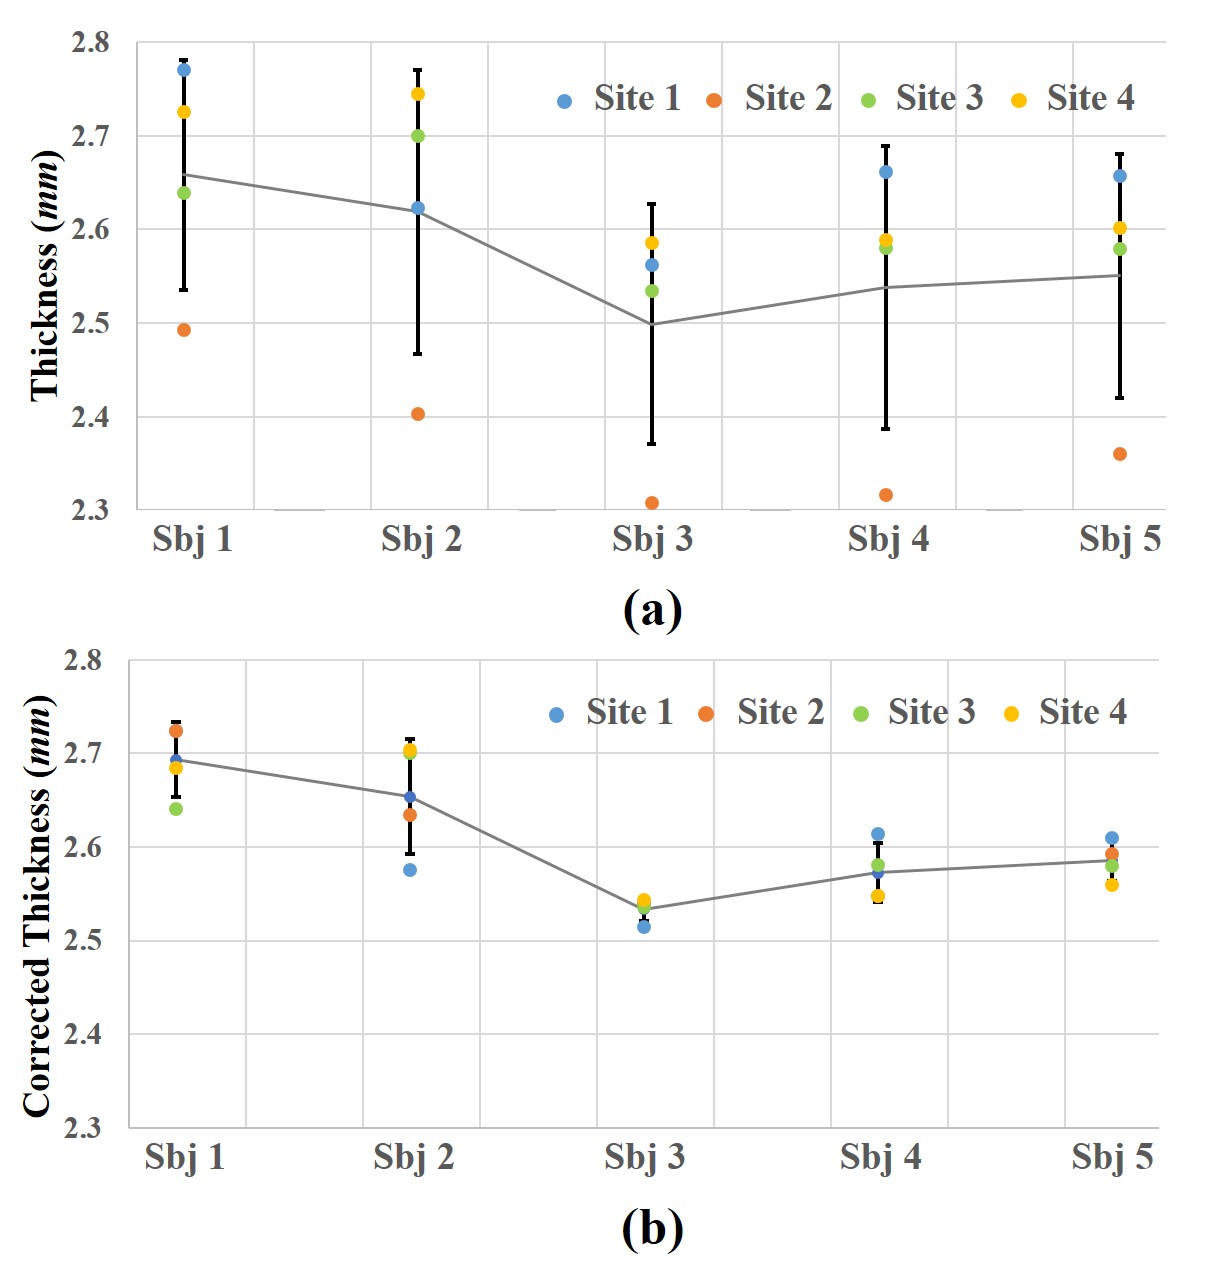
The Institutional Review Board approved this study and all the written informed consents were obtained. Participants. 5 healthy young adults (male; age range, 21~23 years) participated in the MR imaging of brain. Each participant underwent T1-weighted MRI scans in four different Sites, respectively. MR Protocols. All the scans were performed using four 3T MR scanners (Site1 and Site2: GE MR750; Site 3: PHILIPS Ingenia; Site 4: SIEMENS Skyra) in four local hospitals. Three-dimension T1 weighted images (3D T1WIs) were acquired with the same voxel size of 1×1×1 mm3. For the GE site, flip angle=15º; TR/TE=8.3/3.2 ms. For the PHILIPS site, flip angle=8º; TR/TE=7.6/3.7 ms. For the SIEMENS site, flip angle=25º; TR/TE=20/4.9 ms. Data preprocessing and statistical analysis. Cortical thickness map was computed and mapped to white matter triangular mesh surface via standard preprocessing steps in FreeSurfer toolkit (http://surfer.nmr.mgh.harvard.edu/). Spherical Demon toolkit6 was used to align surfaces of the same subjects from different centers in a common spherical space. The vertices on the surface were resampled, such that all surfaces have the same number of vertices and vertex correspondence (Figure 1(a)-(d)). This work aims to harmonize the deviation of cortical thickness measures of different centers. We used mean cortical thickness averaged over all cortical vertices for each subject (Figure 2(a)). By selecting the thickness curve of Site 1 as the baseline, offsets of other Sites were estimated by aligning their thickness curves to the base line via the linear regression method. Interclass correlation coefficient (ICC) was used to compare the consistency of cortical thickness among sites before and after correction.Results
R coefficient of ICC measuring the consistency of four sites in terms of mean cortical thickness values was 0.31 while it was 0.73 after correction. The standard deviation values over the four sites for the five patients were 0.12, 0.15, 0.13, 0.15 and 0.13, respectively (Figure 2(a)). After correction, they were 0.04, 0.06, 0.01, 0.03 and 0.02, respectively (Figure 2(b)).Discussion
Cross-site standard deviation map on one subject in Figure 1(e) demonstrated that this deviation was not regionally dependent, such that harmonizing cortical thickness could be performed at a global scale. The comparison in Figure 2(a) shows the clear variation of cortical thickness values from different sites. As cortical thickness were measured on the boundaries of white matter, gray matter and non-brain tissues, this variation could be induced by disagreement between intermediate results, such as tissue segmentation. To investigate the impact of tissue segmentation, we computed Dice’s coefficient among the white matter volume images as well as the gray matter ones of the same subjects across centers after aligning them in the same space via linear registration method, i.e., FLIRT (http://fsl.fmrib.ox.ac.uk/). On average, Dice’s coefficients were 0.90±0.03 and 0.85±0.05, respectively, suggesting that tissue segmentation results were consistent across centers, and it could hardly be the leading contributor to the cross-center deviation, which could be related the variation of equipments and settings. The comparison of standard deviation bars and he between Figure 2(a) and (b) as well as the improved ICC consistency coefficients demonstrated that the alignment via linear regression method at a global scale could effectively reduce cross-center deviation. Moreover, the cortical thickness variation across subjects, which could be represented by the pattern of mean thickness curve in Figure 2(a), was preserved in Figure 2(b) after correction, demonstrating that it will be reliable to conduct group studies on the corrected cortical thickness values.Conclusion
The deviation of T1-weighted MRI based cortical thickness across different centers was regionally independent. This deviation could be harmonized by linear regression model at a global scale while meaningful data structure, such as cross-subject variation, was well preserved.Acknowledgements
This work was supported by the National Key Research and Development Program of China (2016YFC0100300), National Natural Science Foundation of China (No.81171317, 81471631, 31500798 and 31671005), and the 2011 New Century Excellent Talent Support Plan of the Ministry of Education, China (NCET-11-0438).References
1. Dubois J, Benders M, Borradori-Tolsa C, Cachia A, Lazeyras F, Leuchter HV, Sizonenko SV, Warfield SK, Mangin JF, Hüppi PS. 2008. Primary cortical folding in the human newborn: anearly marker of later functional development. Brain A J Neurol. 131:2028–2041.
2. Fischl B, Rajendran N, Busa E, Augustinack J, Hinds O, Yeo BTT, Mohlberg H, Amunts K, Zilles K. 2008. Cortical Folding Patterns and Predicting Cytoarchitecture. Cereb Cortex . 18:1973–1980.
3. Thompson PM, Hayashi KM, Sowell ER, Gogtay N, Giedd JN, Rapoport JL, de Zubicaray GI, Janke AL, Rose SE, Semple J, Doddrell DM, Wang Y, van Erp TGM, Cannon TD, Toga AW. 2004. Mapping cortical change in Alzheimer’s disease, brain development, and schizophrenia.Neuroimage. 23, Supple:S2–S18.
4. Van Essen DC, Smith SM, Barch DM, Behrens TEJ, Yacoub E, Ugurbil K, WU-Minn HCP Consortium. 2013. The WU-Minn Human Connectome Project: an overview. Neuroimage. 80:62-79.
5. Mirzaalian H, Ning L, Savadjiev P, Pasternak O, Bouix S, Michailovich O, Grant G, Marx CE, Morey RA, Flashman LA, George MS, McAllister TW, Andaluz N, Shutter L, Coimbra R, Zafonte RD, Coleman MJ, Kubicki M, Westin CF, Stein MB, Shenton ME, Rathi Y. 2016. Inter-site and inter-scanner diffusion MRI data harmonization.Neuroimage. 135:311-23.
6. Yeo BTT, Sabuncu M, Vercauteren T, AyacheN, FischlB, GollandP. 2008. Spherical Demons: Fast Surface Registration.Med. Image Comput. Comput. Assist. Interv. 11(1):745–753.
Figures