1446
Quantification of iron liver with clinical MRI protocols1Sorbonne University, Université de technologie de Compiègne CNRS UMR 7338 Biomechanics and Bioengineering, Compiègne, France, 2Echosens, R&D Department, France, 3Radiology, ACRIM, Polyclinique Saint Côme de Compiègne, France
Synopsis
Iron quantification has been assessed through the development of magnetic resonance sequences. The purpose is to improve the existing MRI iron protocols to better diagnose the degree of hemochromatosis. Five volunteers with healthy livers underwent four protocols for the quantification of iron overloads concentration (IOC). The results have demonstrated that existing clinical protocols could be improved to provide spatial distribution of iron within one slice and all over the entire liver volume. IDEAL-IQ® could be the best protocol to have IOC volume representation with a short time of acquisition and standard deviation values associated to mean IOC data.
PURPOSE
Over the last decade, the iron quantification has been assessed through the development of specific magnetic resonance (MR) sequences1. These methods, used in clinical practice, allow the determination of liver composition (fat, iron, inflammation, …). However, these manufacturer’s tools revealed limitations such as high standard deviation values, no volume iron map, etc... Thus, the purpose is to improve the existing MRI iron protocols to better diagnose the degree of hemochromatosis.METHODS
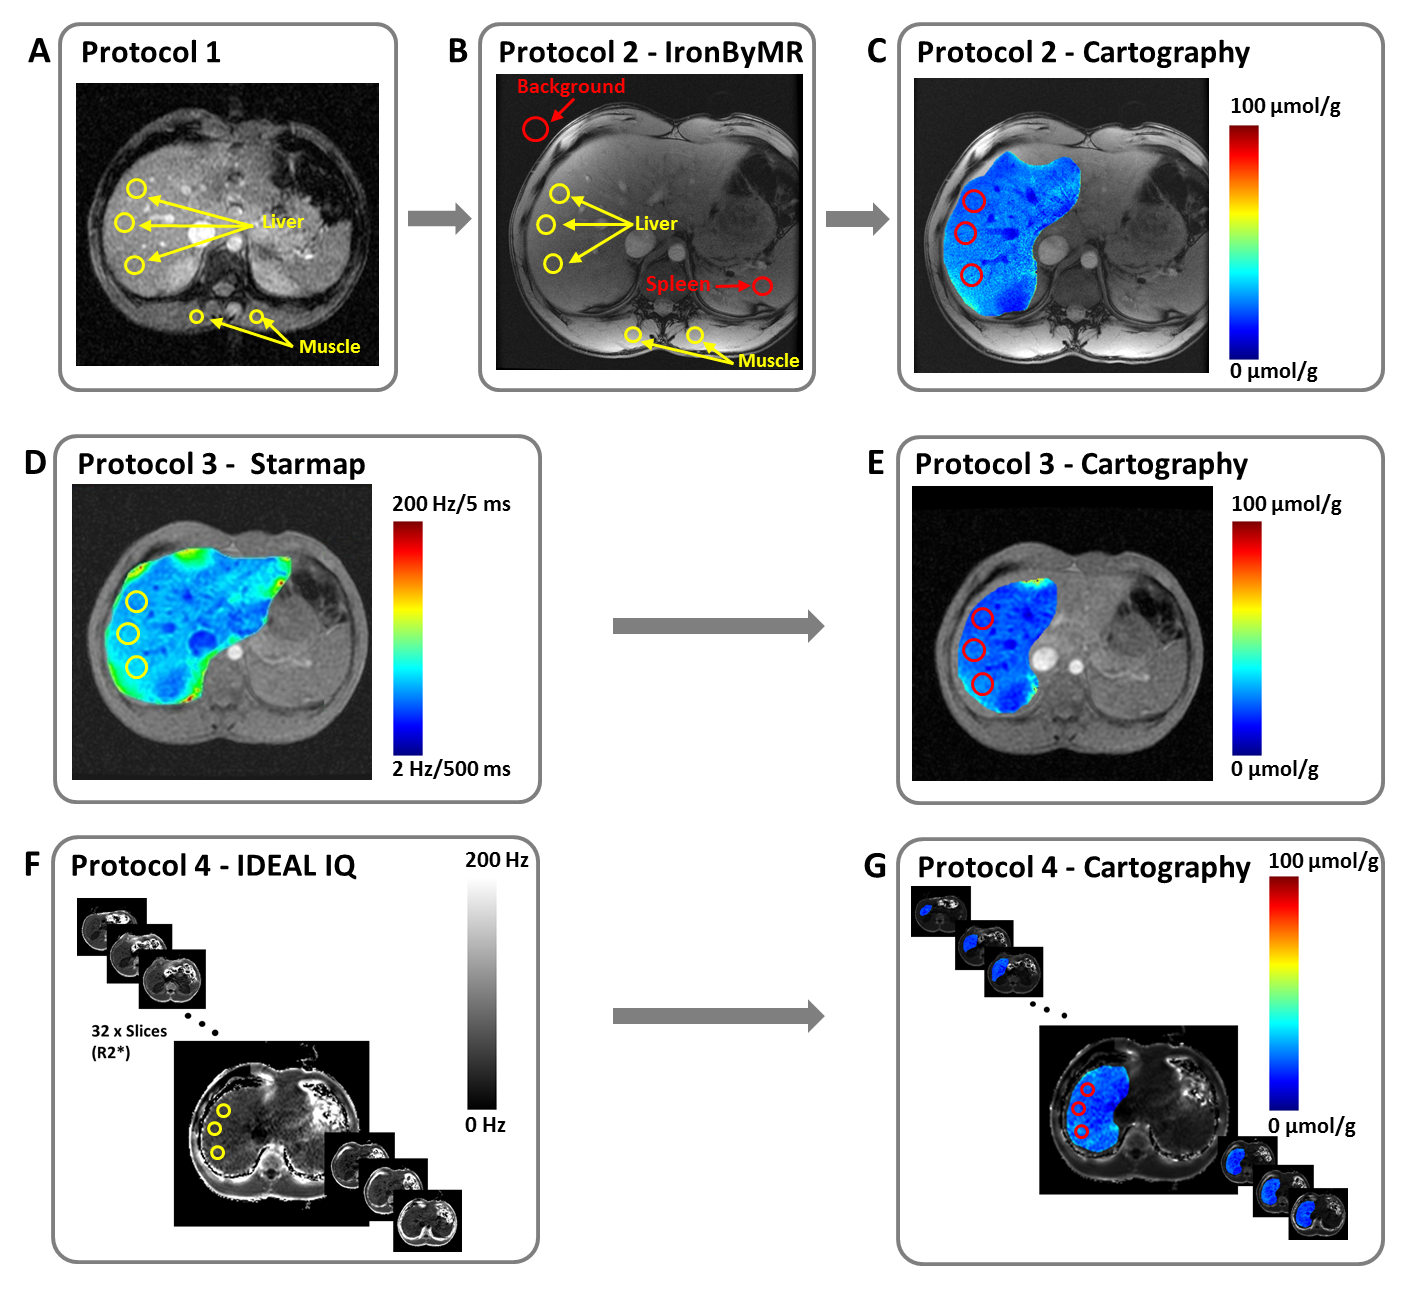
Five volunteers with healthy livers underwent four MRI (1.5T GE) protocols for the quantification of iron overloads concentration (IOC). Protocol 1 (P1), developed by Gandon1, is composed of five gradient echo (GRE) sequences with fixed repetition time (TR), different echo times (TE) and different flip angles (FA). P1 provides a local IOC value, corresponding to the means of three liver regions of interest (ROI), based on the IOC ratio between paraspinal muscles and liver tissues (figure 1A). P1 method provides a high standard deviation (about 20 µmol/g) for the IOC value. Protocol 2 (P2), clinically called IronByMR2, is composed of one GRE sequence (TR=120ms, 8 TE multiples of 2.4ms and FA=20°). P2 is an improvement of P1 taking into account the noise background and allowing the spleen iron measurement within one ROI (figure 1B). However, P2 did not provide standard deviation value for liver and spleen iron measurements. In this study, improvements of both Gandon’s protocols (P1 and P2) have been performed to provide cartography of iron within the liver (figure 1C). This spatial distribution was obtained by applying an exponential fit to in phase and out phase acquisitions, to have the T2* image. Subsequently, the Wood equation3 has been applied.
Protocol 3 (P3) is a General Electric tool, called Starmap®, which provides a spatial distribution of iron liver3, represented by a scale in Hz/ms unit (figure 1D). Starmap® is based on GRE sequence (TR=52.8ms, FA=25°) with 16 TE from 1.176ms to 21.816ms. However, this method is time consuming because ROIs must be manually placed, and repeated, for each selected slices. Moreover, P3 did not give IOC standard deviation values within ROIs. In this work, P3 has been improved to automatically copy the ROIs from one slice to another one. Post treatment was also performed to provide the iron map scale in µmol/g unit to compare the IOC data with other protocols (figure 1E).
Protocol 4 (P4) is also a GE tool, called IDEAL-IQ®4, based on a GRE sequence (TR=11.5ms, FA=7°) with 6 TE from 2.4ms to 9.6ms. This sequence is usually applied to show the spatial distribution of fat fraction for the entire liver volume. In this study, R2* (1/T2*) images (figure 1F) were used to simultaneously provide (Wood equation) the corresponding iron cartographies for the entire liver (figure 1G).
RESULTS
The IOC data obtained with the four protocols are compared within the same ROIs in the same slice location. The mean values of IOC_P1 and IOC_P2 are 20 ± 20 µmol/g and 26.25 µmol/g. These local measurements are in the same range as the IOC data (32.87 ± 3.82 µmol/g) located within the cartography (figure 1C). This last estimation is slightly higher than IOC_P1, IOC_P2, IOC_P3 (26.24±3.02µmol/g) and IOC_P4 (24.01±2.87µmol/g). This overestimation could be due to the number of TE which are different between P2 (8 TE) and P3 (16 TE). In addition, the noise taken into account could also provide higher IOC values compared to the other protocols.DISCUSSION
The four protocols revealed similar IOC values which are in agreement with the literature 1,2,3 for healthy livers (<36 µmol/g). This study has demonstrated that existing clinical protocols could be improved to provide spatial distribution of iron within one slice or all over the entire liver volume. These developments will give a better diagnosis of hemochromatosis stage.CONCLUSION
IDEAL-IQ® could be the best protocol to have IOC volume representation with a short time of acquisition and standard deviation values associated to mean IOC data.Acknowledgements
No acknowledgement found.References
1. Gandon Y, Olivié D, Guyader D, et al. Non-invasive assessment of hepatic iron stores by MRI. Lancet (London, England) 2004;363(9406):357–62.
2. Boulic Y, Kiani A, Bardou-Jacquet A, et al. Quantification of Liver Iron Overload and Steatosis at 3T. RSNA 2013.
3. Wood J, Enriquez C, Ghugre N, et al. MRI R2 and R2* mapping accurately estimates hepatic iron concentration in transfusion-dependent thalassemia and sickle cell disease patients. Blood 2005;106(4):1460–1465.
4. Kuhn J, Hernando D, Munoz-del-Rio A, et al. Effect of Multipeak Spectral Modeling of Fat for Liver Iron and Fat Quantification: Correlation of Biopsy with MR Imaging Results. Radiology 2012;265(1): 133–142.
Figures