1444
Comparison of MP2RAGE-based morphometry methods for anorexia nervosaBénédicte Maréchal1,2,3, José Baiao Boto4, Gkinis Georgios5, Nadia Ortiz5, Karl-Olof Lövblad4, François Lazeyras6, Maria Isabel Vargas4, Alexis Roche1,2,3, and Tobias Kober1,2,3
1Advanced Clinical Imaging Technology, Siemens Healthcare HC CEMEA SUI DI PI, Lausanne, Switzerland, 2Department of Radiology, CHUV, Lausanne, Switzerland, 3LTS5, EPFL, Lausanne, Switzerland, 4Department of Neuroradiology, Geneva University Hospital, Geneva, Switzerland, 5Department of Psychiatry, Geneva University Hospital, Geneva, Switzerland, 6Department of Radiology and Medical Informatics, University of Geneva, Geneva, Switzerland
Synopsis
We explore the sensitivity of a morphometry tool to detect anorexia-related brain atrophy in MP2RAGE images. We compare volumetry resulting from two previously reported morphometry strategies on 16 patients with clinical suspicion of anorexia and identify both similarities and differences in brain atrophy evaluation.
Purpose
Accurate classification and segmentation of brain tissue using MR imaging is a key challenge for automated volumetric assessment. Major limitations of MRI-based classification techniques arise from limited signal-to-noise (SNR) and contrast-to-noise ratios (CNR) as well as from partial-volume effects. As reported in [1], the uniform MP2RAGE series provides additional gray/white-matter contrast and reduced B1 bias and several groups have proposed strategies to perform automated morphometry based on MP2RAGE series [2,3]. In this work, we expand on our previous study, which compared skull-stripping performances across these strategies [4], by assessing the volumes of key neuroanatomical structures in a cohort of patients with clinical suspicion of anorexia nervosa, most of them with lower-than-normal body mass indices (BMI). We compare both strategies with regard to the detection of brain atrophy in anorexic patients, a finding that has previously been demonstrated by several groups [5-7].Material and methods
This study was approved by the local ethical committee and included 16 patients (15 females, 1 male; mean age, 29.5 years, range, 16.2-74.5 years, BMI=14.9±3.2 kg/m2), presenting consecutively for brain MRI with clinical suspicion of anorexia nervosa. Three subgroups were formed: 1 (all patients, n=16), 2 (BMI<18.5 kg/m2, n=13), and 3 (BMI<16 kg/m2, n=10).All patients were scanned at 3T (Magnetom Prisma, Siemens, Erlangen, Germany) using the MP2RAGE sequence (TI1/TI2=700/2500ms, TR=5000ms, voxel size=1x1x1.2mm3, TA=8:22min with a 64-channel coil).
Automated segmentation of brain structures was performed with the MorphoBox prototype [8] following two distinct strategies:
- Strategy 1 uses the product of the second inversion (Fig. 1A) and uniform (Fig. 1B) MP2RAGE images as suggested by Fujimoto et al. (2) for the skull-stripping step. Subsequently, it uses the uniform image for the tissue classification and brain segmentation steps.
- Strategy 2 uses the denoised uniform MP2RAGE image (Fig. 1C) as described in [3] using a regularization constant of 70 throughout the whole MorphoBox pipeline
Both strategies result in computing volumes of GM, WM and CSF, basal ganglia, hippocampus and lateral ventricles normalized by the total intracranial volume (TIV) (Fig. 1 D-E).
Finally, for the purpose of inter-subject comparison, all estimated volumes are transformed into z-scores adjusted for age and gender using a database of healthy controls as reference (306 subjects with normal BMI, 51% males; mean age, 66.4 years; range, 19-90 years).
Statistical significance of the difference between z-scores, absolute volumes and normalized volumes obtained by the two methods was assessed by paired t-tests.
Results
All normalized and absolute volumes obtained with Strategy 1 were significantly different from those obtained with Strategy 2. As shown in Fig. 2, Strategy 1 estimates significantly higher volumes of gray and white matter and lower CSF and ventricular volumes (p-value<0.001). Significant differences between z-scores obtained by the two strategies were found across all three groups for total GM (p-value=0.002, 0.002, 0.005 for group 1, 2, 3, respectively) but only for groups 2 and 3 for ventricle volumes (p-value<0.001) (see Fig. 3). As illustrated in Fig. 4, both strategies appear to detect brain atrophy, yet with different patterns: Strategy 1 detected a strong GM atrophy together with a moderate WM atrophy, while Strategy 2 detected a strong WM atrophy but no GM atrophy.Discussion
Our results show both similarities and discrepancies between two MP2RAGE processing strategies for brain atrophy evaluation in anorexic patients, and stress the need to further develop the methodology of MP2RAGE-based brain morphometry. There are, however, two reasons to think that Strategy 1 is the most reliable. First, we previously showed that Strategy 1 achieves more accurate skull-stripping than Strategy 2 [4]. Secondly, the denoising step involved in Strategy 2 introduces some intensity bias, which is likely to confuse tissue classification, while Strategy 1 performs tissue classification from the uniform, bias-free image [1]. These facts help to explain the false perception, illustrated in Fig. 1 F-G, that Strategy 1 estimates larger cerebral volumes than Strategy 2. When compared to an age- and gender-matched group of controls, anorexic patients with abnormal BMI show decreased total brain and GM volumes which may be caused by loss of structural brain constituents and/or dehydration [6]. Since brain changes are completely or partially reversible when body weight returns to normal [5], further research will focus on assessing whether the MP2RAGE-based morphometry tool can reliably follow-up such patients.Acknowledgements
No acknowledgement found.References
1. J. P. Marques, T. Kober, G. Krueger, W. van der Zwaag, P.-F. Van de Moortele, and R. Gruetter, “MP2RAGE, a self-bias-field corrected sequence for improved segmentation and T1-mapping at high field.,” Neuroimage, vol. 49, no. 2, pp. 1271–81, Jan. 20102. K. Fujimoto, J. R. Polimeni, A. J. W. van der Kouwe, M. Reuter, T. Kober, T. Benner, B. Fischl, and L. L. Wald, “Quantitative comparison of cortical surface reconstructions from MP2RAGE and multi-echo MPRAGE data at 3 and 7T,” Neuroimage, vol. 90, pp. 60–73, 2014.
3. K. R. O’Brien, T. Kober, P. Hagmann, P. Maeder, J. Marques, F. Lazeyras, G. Krueger, and A. Roche, “Robust T1-weighted structural brain imaging and morphometry at 7T using MP2RAGE.,” PLoS One, vol. 9, no. 6, p. e99676, 2014.
4. Falkovskiy, P., Maréchal, B., Yan, S., Jin, Z., Qian, T., O'Brien, K., Meuli, R., Thiran, J.P., Krueger, G., Kober, T. and Roche, A., Quantitative comparison of MP2RAGE skull-stripping strategies. Proc. Intl. Soc. Mag. Reson. Med. 24 (2016)
5. Swayze VW, 2nd, Andersen AE, Andreasen NC, Arndt S, Sato Y, Ziebell S. Brain tissue volume segmentation in patients with anorexia nervosa before and after weight normalization. Int J Eat Disord 2003;33(1):33-44
6. Hoffman GW, Jr., Ellinwood EH, Jr., Rockwell WJ, Herfkens RJ, Nishita JK, Guthrie LF. Cerebral atrophy in anorexia nervosa: a pilot study. Biol Psychiatry 1989;26(3):321-324
7. Boghi A, Sterpone S, Sales S, et al. In vivo evidence of global and focal brain alterations in anorexia nervosa. Psychiatry Res 2011;192(3):154-159
8. Schmitter D, Roche A, Maréchal B et al. An evaluation of volume-based morphometry for prediction of mild cognitive impairment and Alzheimer’s disease. Neuroimage Clinical 2015; 77-17
Figures
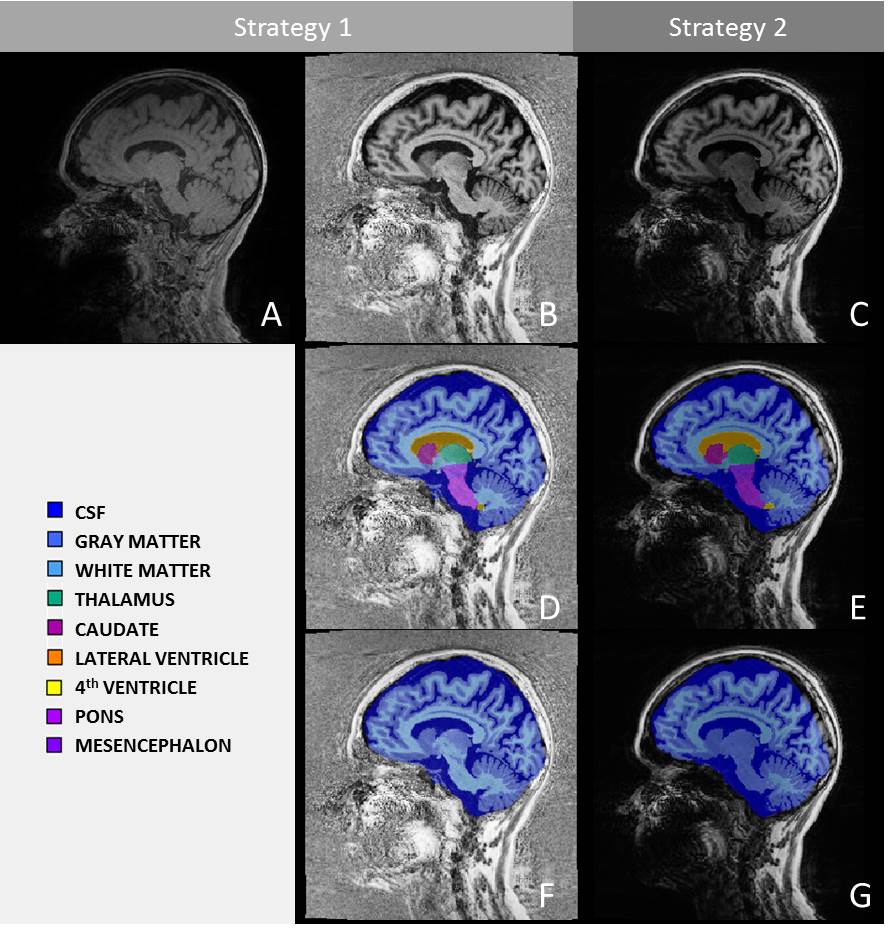
Figure 1. Sagittal slice of MP2RAGE second inversion contrast (A), uniform (B) and denoised-uniform (C) series from a 45yo female anorexic patient (BMI = 16.23kg/m2) with overlaid segmentation (middle) and GM/WM/CSF classification (bottom) results using Strategy 1 (D-F) and Strategy 2 (E-G)
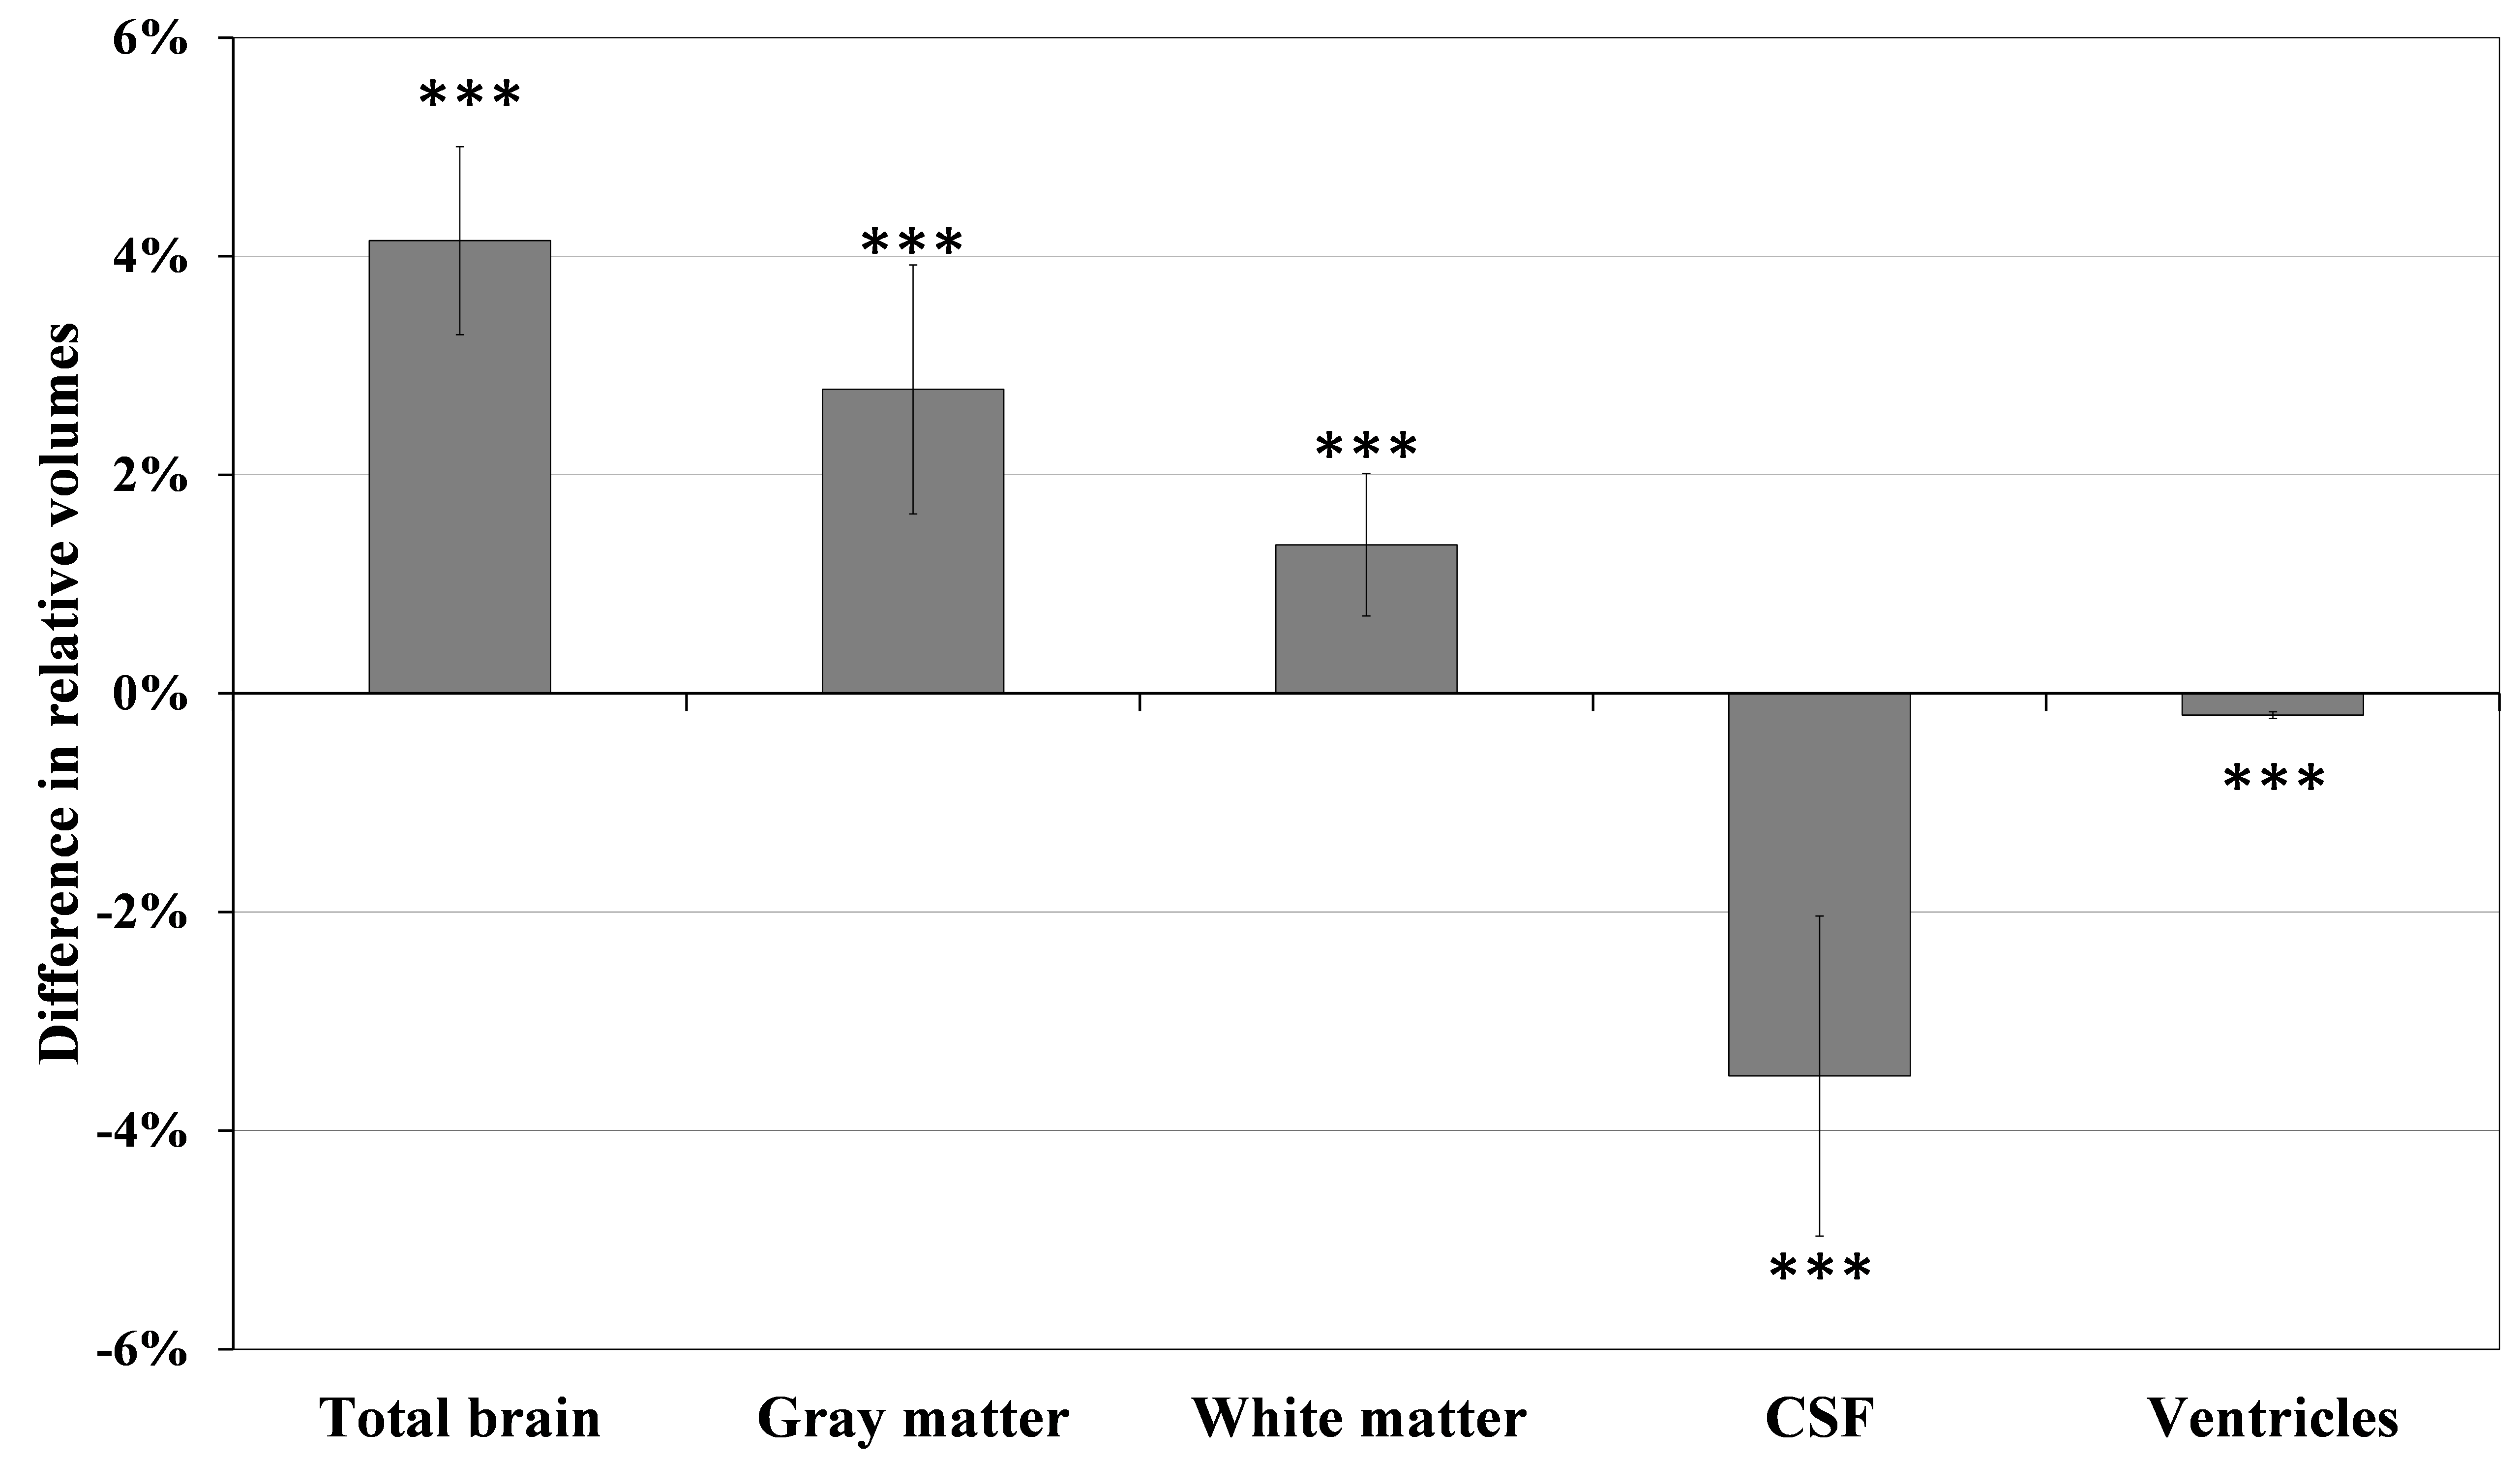
Figure 2. Volumetric differences (in % of TIV) between the two strategies (strategy1 – strategy2) for total brain, GM, WM and CSF volumes as well as the volume of the ventricles averaged across all patients. Results are shown as mean difference ± 95% confidence interval. Note statistically significant differences indicated by the 95% CI error bars not crossing the x axis.
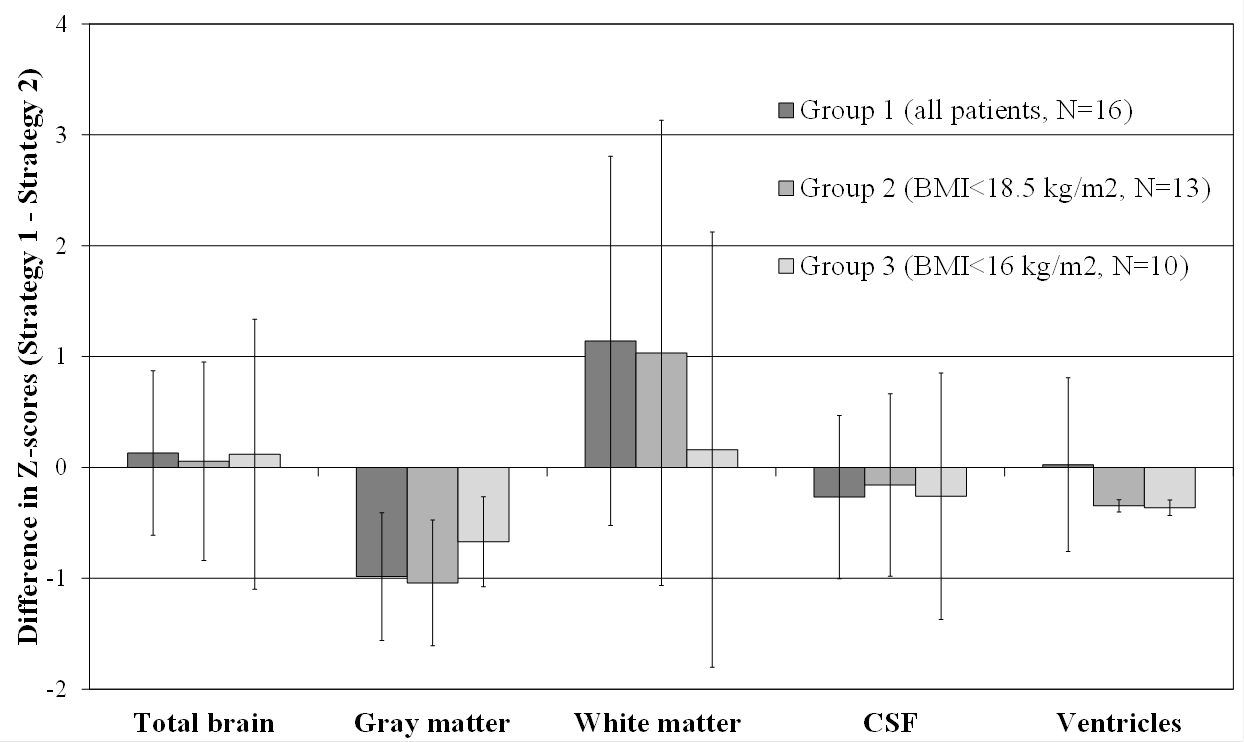
Figure 3. Results of the paired t-tests performed in group 1 (all patients), group 2 (subgroup with BMI<18.5 kg/m2), and group 3 (subgroup with BMI<16kg/m2). Results shown are mean difference in z-scores ± 95% confidence interval (CI). Note statistically significant differences indicated by the 95% CI error bars not crossing the x axis.
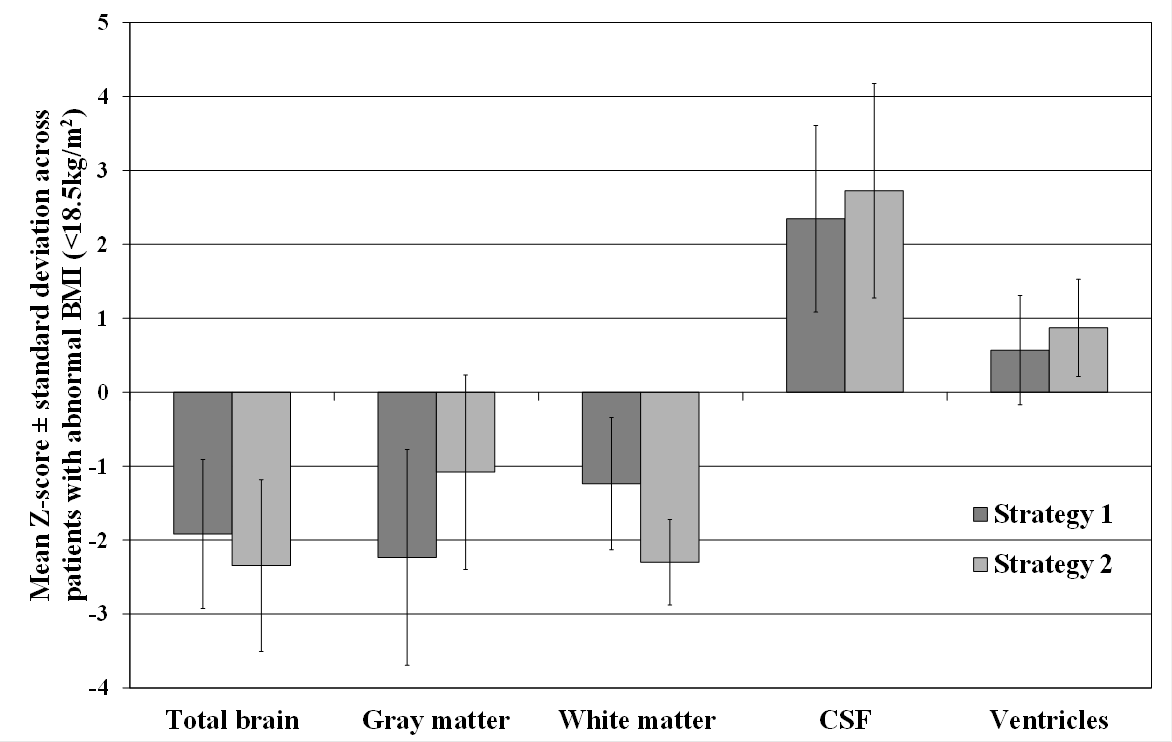
Figure 4. Z-scores for total brain (GM + WM), GM, WM and CSF volumes as well as volume of the ventricles obtained by both strategies and averaged across anorexic patients with abnormal BMI (<18.5kg/m2). Results are shown as mean z-score ± standard deviation.