1442
Improved image texture features by Gaussian mixture models of grey-level co-occurrence matrices1Department of Radiation Sciences, Umeå University, Umeå, Sweden, 2Akademiska Hospital, Uppsala, Sweden
Synopsis
Image texture features based on gray-level co-occurence matrices (GLCMs) are useful in e.g. the analysis of MR images of tumours. However, the features can be quite sensitive to the number of grey-levels in the analysed image, in particular if the region of interest is small. In this work we propose a new method for computing the GLCM, based on Gaussian mixture models. The results show that the new method improves the estimation of the GLCM and at the same time eliminates the difficult task of selecting the number of grey-levels.
Introduction
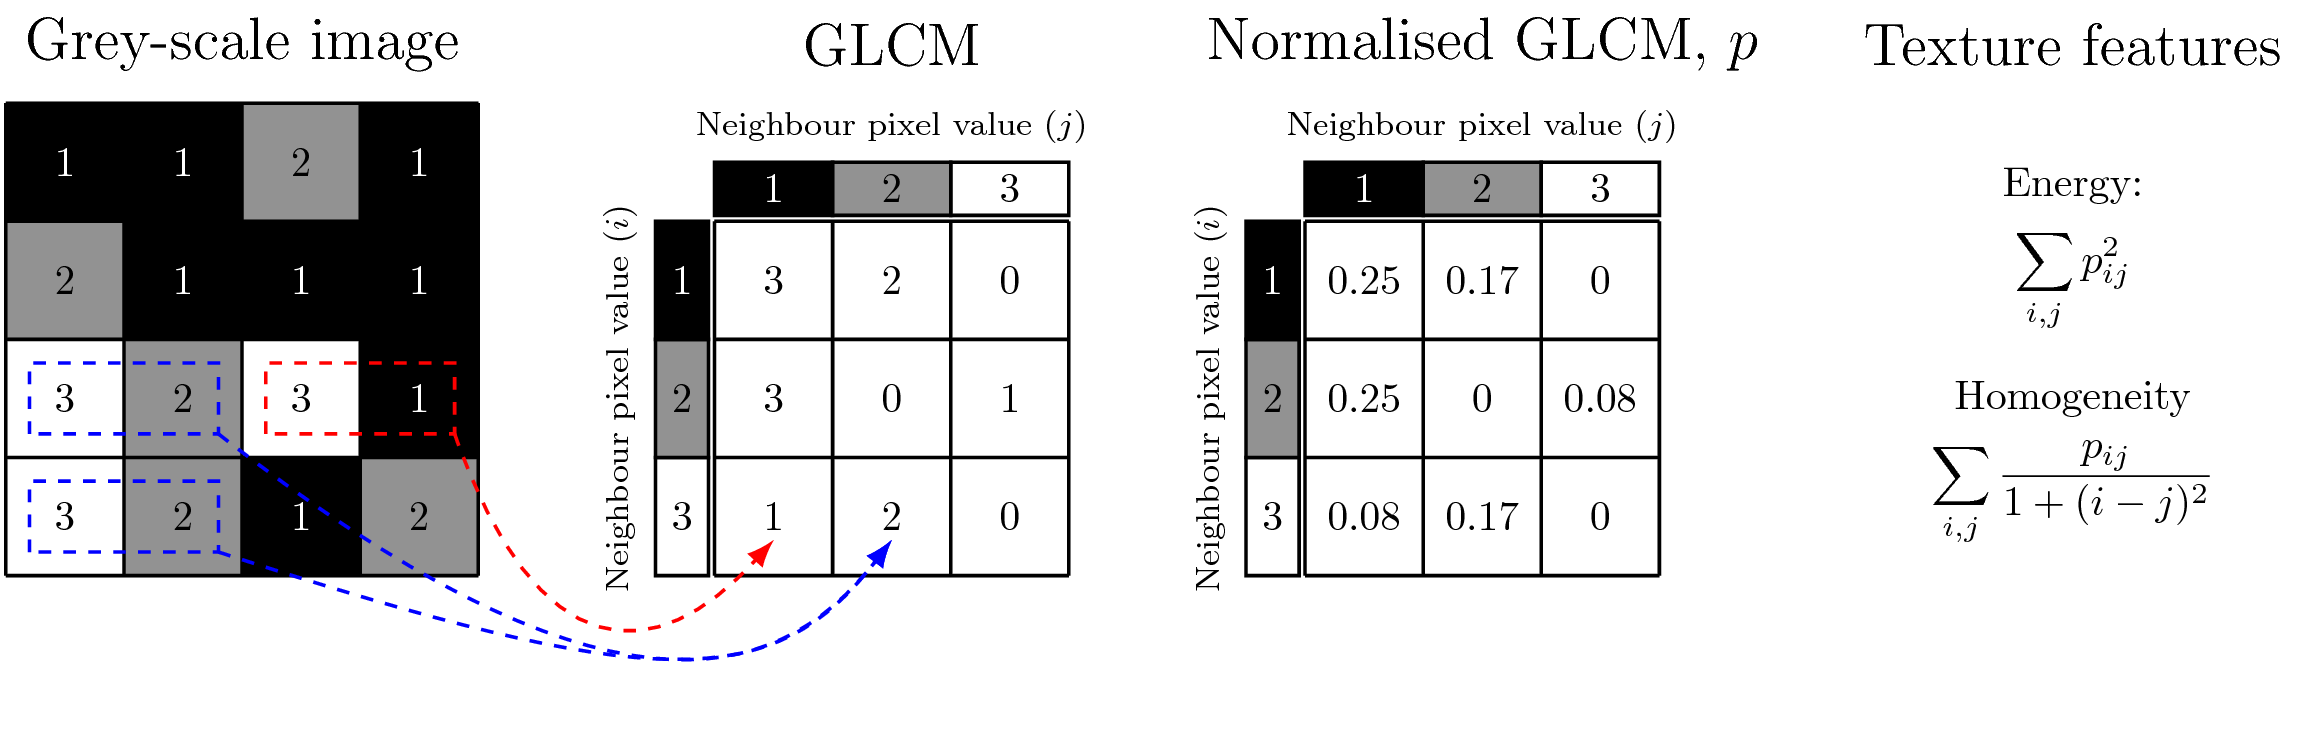
The extraction and analysis of texture features from magnetic resonance (MR) images has become increasingly popular. A common approach is to use the Haralick texture features1, computed from grey-level co-occurrence matrices (GLCMs), as illustrated in Figure 1. These features have been used successfully in many medical applications in MR. For instance, in cancer they have been used in applications with brain tumours2, breast cancer3 and the liver5.
The Haralick features are, however, sensitive to the size of the region-of-interest (ROI). In particular, when the ROI is small, the resulting GLCM will be poorly specified, and the derived feature values will also be of low quality. More specifically, problems occur when few samples in a ROI must specify many bins in a GLCM.
The purpose of this work is to introduce and investigate a novel approach to construct GLCMs that do not require binning in the GLCM. Instead, a continuous GLCM is constructed by the use of a Gaussian mixture model (GMM).
Methods
We used the Kylberg Texture Dataset v.1.05 to investigate the proposed approach. This image data set contains 28 texture classes with 160 images in each class.
We used 100 images from each texture class to generate a reference GLCM, that was used to compare the generated GLCM from the proposed method.
The current approach is to generate a GLCM using some arbitrary predefined number of bins, illustrated in Figure 1. We constructed multiple GLCMs, with the number of bins ranging from 4 to 256. This was repeated for several ROI sizes, ranging from $$$5\times 5$$$ to $$$100\times100$$$.
The continuous GLCM was constructed by fitting a Gaussian mixture model to the 2-dimensional point cloud of grey-levels corresponding to the neighbouring pixels in an ROI. The number of mixture components was determined by a cross-validation procedure that maximised the likelihood of the kernel parameter $$$\sigma$$$6.
The performance of the proposed procedure was evaluated by computing the relative root mean squared error (RMSE), $$\textrm{error} = \frac{\|G_{\textrm{ref}} - G\|_F}{\|G_{\textrm{ref}}\|_F},$$ where $$$\|\cdot\|_F$$$ denotes the Frobenius norm, $$$G_{\textrm{ref}}$$$ the reference GLCM and $$$G$$$ a computed GLCM, using either the current or the proposed approach. Further, two common Haralick texture features (Energy and Homogeneity) were evaluated in terms of the relative RMSE.
Results
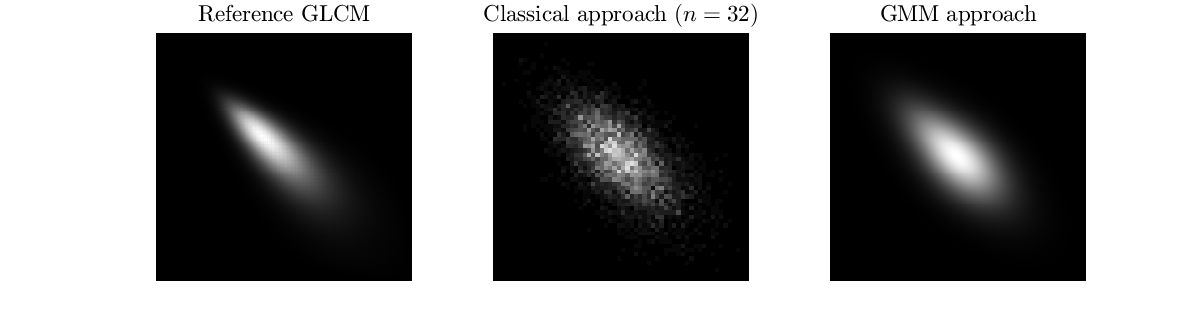
Figure 2 illustrates GLCMs for the texture class blanket1 from the Kylberg data set. The reference GLCM, the current GLCM and the proposed GMM are shown in Figure 2.
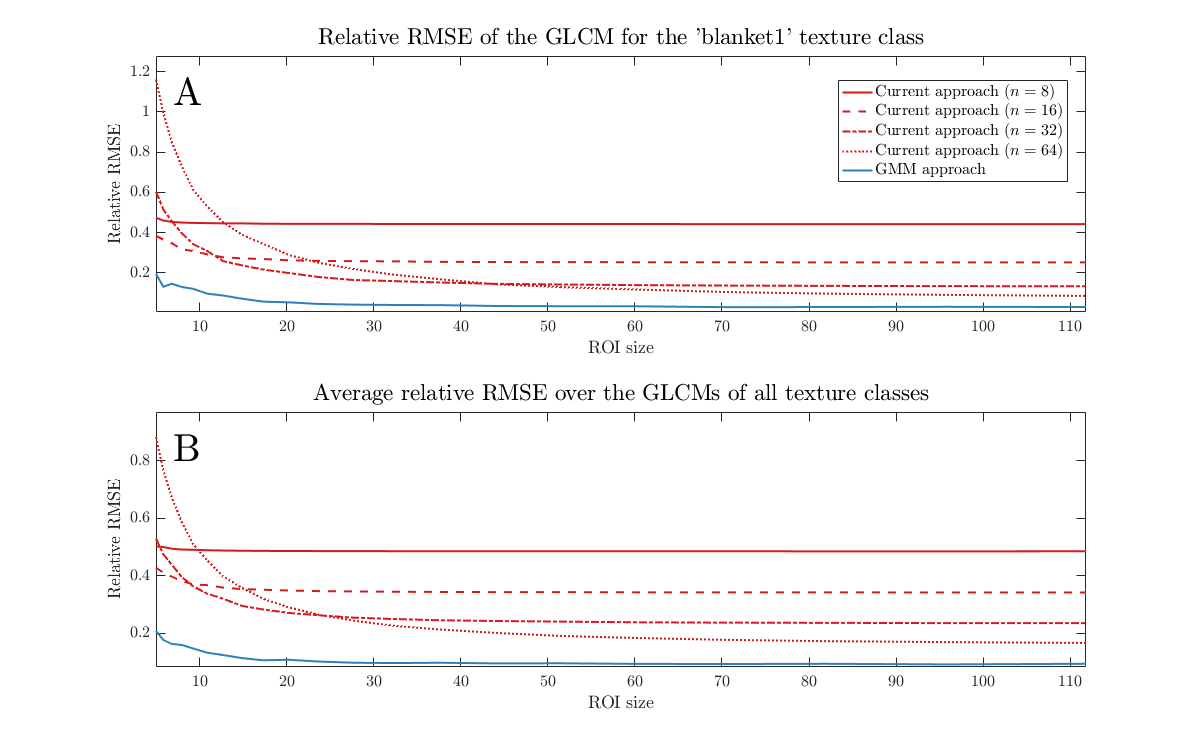
In Figure 3A, the relative RMSE is plotted as a function of the ROI size for the GMM approach (blue curve) and four different values of the number of grey-levels ($$$n$$$) for the current approach (red curve). Similar results, with smallest errors from the GMM approach were obtained for the other 27 texture classes as well. Figure 3B illustrates the relative RMSE for the GLCMs, averaged over all 28 texture classes.
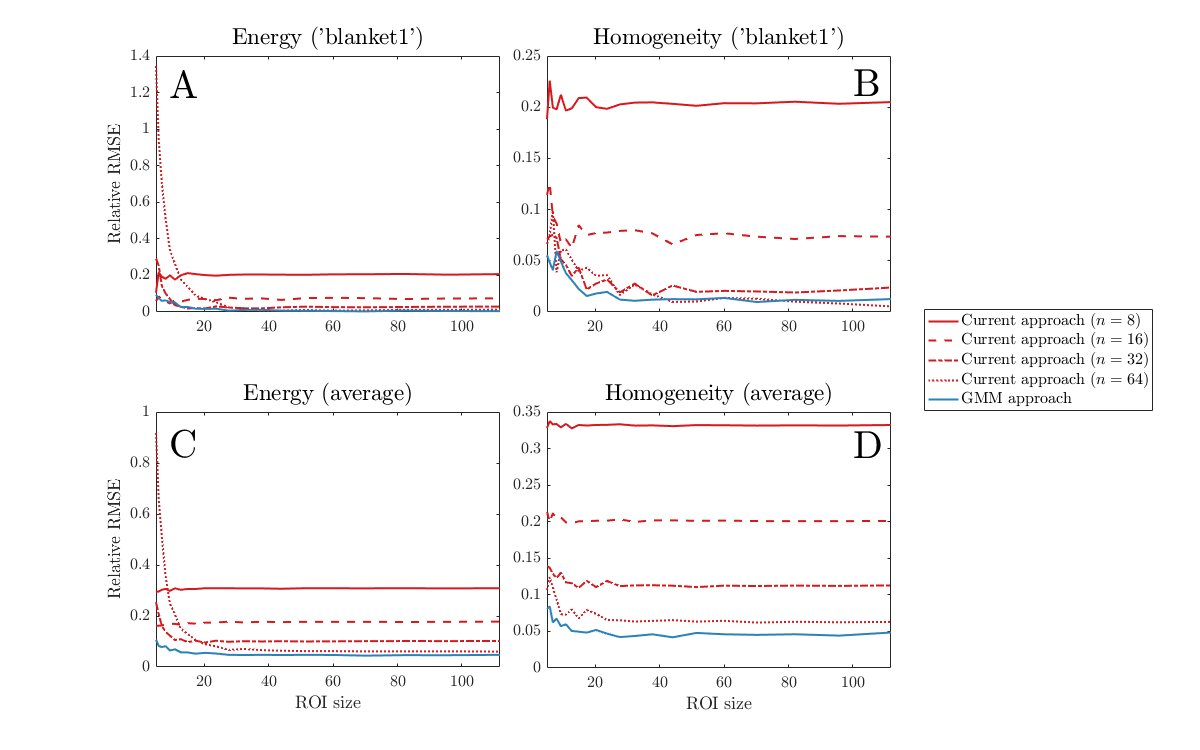
The relative RMSEs for two common features (Energy and Homogeneity) are shown in Figure 4. The results for the blanket1 texture class are illustrated (Figure 4A-B) with four different numbers of grey-levels for the current approach, together with the corresponding results from the proposed GMM method. The same result are illustrated in Figure 4C-D as averages over all 28 texture classes.
Discussion
A new method has been developed based on GMMs to estimate GLCMs for image texture feature extraction. The evaluation of the proposed method showed that the error of the GMM estimation of the GLCM was consistently smaller compared to the current approach. This also generally translated to smaller errors in the feature values compared to the current approach.
While the computed feature values had smaller errors in the proposed GMM approach in most cases, there were particular combinations of intervals for ROI sizes and numbers of grey-levels that gave smaller errors for the current approach.
The main significance of the presented result is that the GMM approach not only produces accurate GLCMs but also that it does not require the choice of the number of grey-levels. This is in contrast to the current approach where a fixed number of grey-levels has to be selected, usually with very little knowledge of whether the choice will produce a good approximation of the GLCM or not.
Conclusions
The proposed method to estimate a GLCM appears to approximate the true GLCM well, and better than the current approach. In addition, this also translated to better approximations of the feature values in many cases. Further, the proposed approach does not require any parameters, in particular, it does not require the user to select a number of grey-levels.
Acknowledgements
No acknowledgement found.References
1. Haralick R M, Shanmugam K, Dinstein, I. Textural Features for Image Classification. IEEE Trans Syst, Man, Cybern 1973;SMC-3(6):610-621.
2. Ryu Y J, Choi S H, Park S J, Yun TJ, Kim J H, Sohn C H. Glioma: Application of whole-tumor texture analysis of diffusion-weighted imaging for the evaluation of tumor heterogeneity. PLoS One 2014;9(9):e108335.
3. Wibmer A, Hricak H, Gondo T, Matsumoto K, Veeraraghavan H, Fehr D, Zheng J, Goldman D, Moskowitz C, Fine S W, Reuter V E, Eastham J, Sala E, Vargas H A. Haralick texture analysis of prostate MRI: utility for differentiating non-cancerous prostate from prostate cancer and differentiating prostate cancers with different Gleason scores. Eur. Radiol. 2015;25(10):2840-2850.
4. House M J, Bangma S J, Thomas M, Gan E K, Ayonrinde O T, Adams L A, Olynyk J K, St. Pierre T G. Texture-based classification of liver fibrosis using MRI. J Magn Reson Imaging. 2015;41(2):322-328.
5. Kylberg G. The Kylberg Texture Dataset v. 1.0. Centre for Image Analysis, Swedish University of Agricultural Sciences and Uppsala University, Uppsala, Sweden. 2011;35.
6. Awate S P. Adaptive, nonparametric markov models and information-theoretic methods for image restoration and segmentation. PhD Thesis, School of Computing, The University of Utah, Utah, USA, 2006.
Figures