1438
B0 Field Inhomogeneity Corrected Quantitative Susceptibility Mapping1Electrical engineering, Kwangwoon University, Seoul, Korea, Republic of, 2Korea Basic Science Institute, Ochang, Korea, Republic of
Synopsis
QSM is a method that generates internal susceptibility distribution of subject using material’s intrinsic magnetic susceptibility property. Bo inhomogeneity affects magnitude and phase images. In this study, QSM with B0 field inhomogeneity correction is proposed. Using numerical simulation and in-vivo experiment, proposed method is verified. In simulation, improved susceptibility map is obtained with less root mean square error. In in-vivo experiment, signal loss and non-uniformity at frontal lobe are reduced. As field inhomogeneity increases according to the increase of main field strength, this method would be a more important element for QSM.
Purpose
QSM is a method that generates internal susceptibility distribution of subject using material’s intrinsic magnetic susceptibility property. When a tissue of the body is exposed to an external magnetic field, field perturbation is generated, which can be detected as phase shifts in the MR phase images.1-3 Since B0 inhomogeneity also changes signal phase, it interferes with QSM. Thus we propose an inhomogeneity corrected QSM by correcting B0 inhomogeneity and unwrapping phase simultaneously. Using numerical simulation and in-vivo experiment, the efficacy of the method is demonstrated.Method
The proposed method models the field inhomogeneity with polynomials, and finds model parameters using the phase difference data between adjacent voxels to fit the partial derivatives of the model formula. By using the phase difference data, phase wrapping and chemical shifts are automatically disappeared.4 The proposed simultaneous field inhomogeneity correction and phase unwrapping method is compared to the Laplacian phase unwrapping method.5 For background phase removal the sophisticated harmonic artifact reduction of phase data (SHARP)1 is used. Susceptibility reconstruction is performed using a regularized inversion which minimizes the L1-norm of total variation.6Result
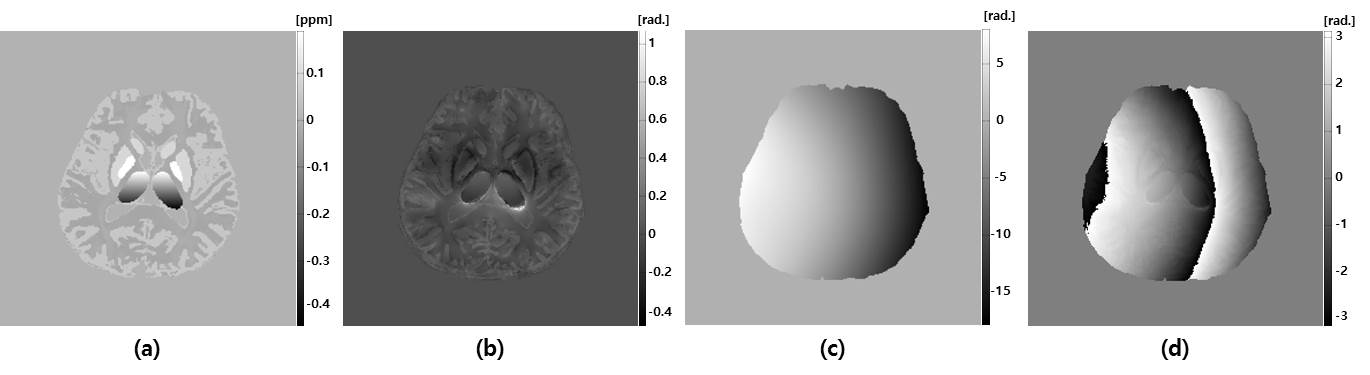
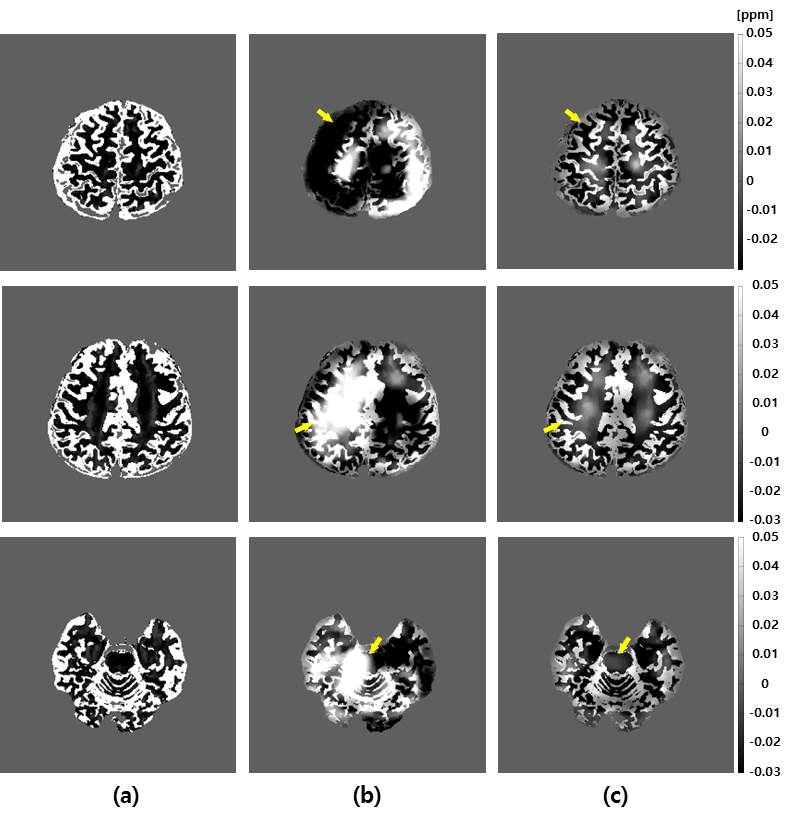
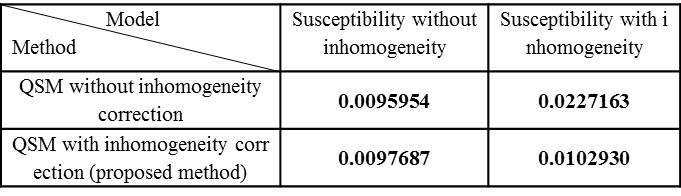
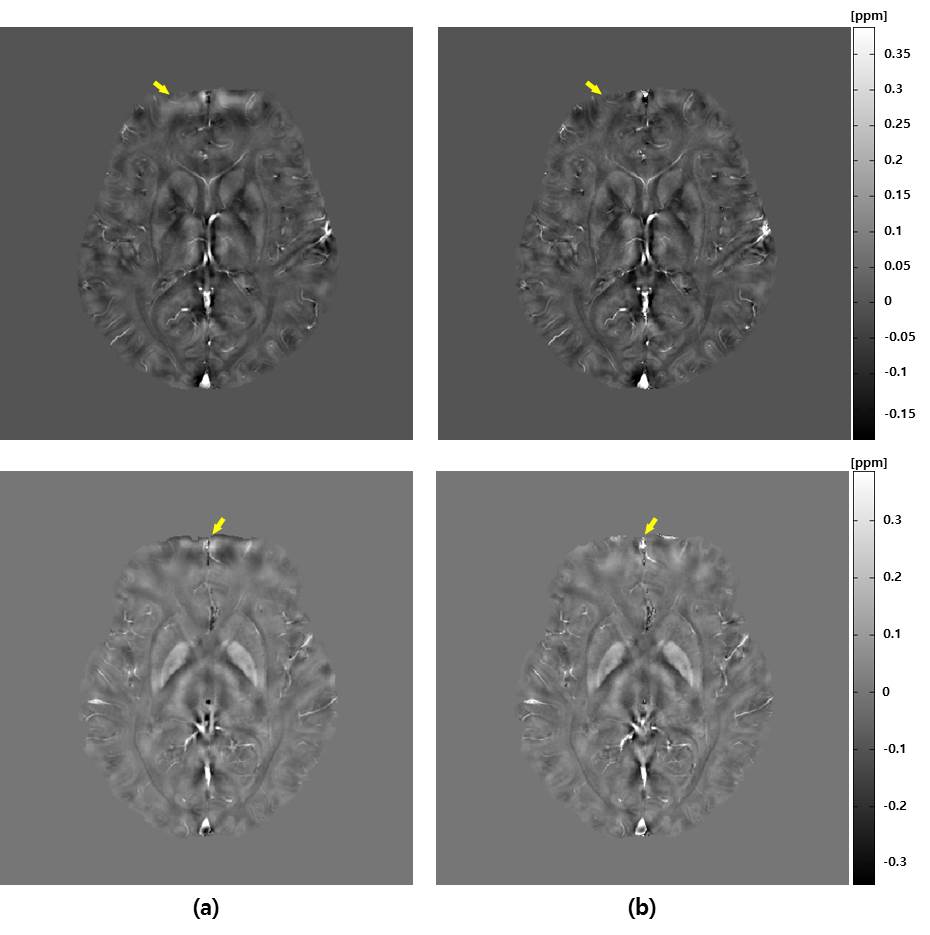
Numerical simulation and in-vivo experiments are performed to investigate the effect of the field inhomogeneity on QSM. For simulation, we used a head shaped numerical susceptibility phantom shown in Fig.17. Matrix size of the phantom was 256*256*91 with a voxel resolution of 0.94*0.94*1.5 mm3. Susceptibility distribution was in a range of -0.44 to 0.21 ppm. Based on the susceptibility distribution, phase data is generated at 3 tesla field strength and TE of 8.1ms. Field inhomogeneity is adopted from a real 3T MRI system. The field inhomogeneity is added to the susceptibility-induced phase data. The susceptibility maps obtained by QSM with and without inhomogeneity correction are shown in Fig.2 for three axial planes: (a) true susceptibility maps, (b) susceptibility maps without inhomogeneity correction, and (c) susceptibility maps with inhomogeneity correction by the proposed method. Regions showing large differences are indicated by small yellow arrows. The root mean square error (RMSE) in QSM over the 3-D volume is summarized in Figure 3. As seen in the simulation, inhomogeneity affects QSM substantially, and the correction of inhomogeneity is an important element to obtain accurate QSM. Figure 4 shows in-vivo QSM images acquired with Philips 3 tesla MRI system using 3D GRE sequence (TR = 30ms, TE1/TE2 = 8.1/20.3ms, voxel resolution = 0.5*0.5*1.0 mm3, FOV = 224*224*40 mm3) with healthy volunteer. The susceptibility maps without inhomogeneity correction are shown in (a), and those with inhomogeneity correction by the proposed method are shown in (b). Distortions in frontal lobes due to large inhomogeneity are seen in (a), while such distortions are not observable in (b). Small vessels are more clearly seen in (b).Discussion
Field inhomogeneity interferes with QSM substantially as seen in the simulation and in-vivo experiments. The Laplacian phase unwrapping remove lower order inhomogeneity and SHARP removes inhomogeneity that satisfies Laplace equation, however, inhomogeneity does not satisfy the Laplace equation in general when subject is loaded inside the magnet and eddy currents are induced by gradient pulsing. Higher order inhomogeneity is also common in high field MRI. Therefore inhomogeneity should be removed before applying QSM to obtain an accurate susceptibility map. From simulation and experiment, the proposed method provides accurate QSM regardless of inhomogeneity.Conclusion
The B0 inhomogeneity corrected quantitative susceptibility mapping is easily implementable by replacing the existing phase unwrapping technique for QSM processing. Effectiveness of the method is demonstrated through numerical simulation and in-vivo experiment. As field inhomogeneity increases with higher magnetic field, the inhomogeneity correction would become an essential element in QSM processing.Acknowledgements
This work was supported by the National Research Foundation of Korea (NRF) grant funded by the Korea government (MSIP) (NRF-2015R1A2A2A03005089).References
1. Schweser F, Deistung A, Lehr BW, Reichenbach JR. Quantitative imaging of intrinsic magnetic tissue properties using MRI signal phase: an approach to in vivo brain iron metabolism? Neuroimage 2011;54(4):2789-807.
2. Liu C, Li W, Tong KA, Yeom KW, Kuzminski S. Susceptibility-weighted imaging and quantitative susceptibility mapping in the brain. Journal of Magnetic Resonance Imaging 2015;42(1): 23-41.
3. Li W, Wu B, Liu C. Quantitative susceptibility mapping of human brain reflects spatial variation in tissue composition. Neuroimage 2011;55(4): 1645-56.
4. Yang YJ, Park J, Yoon JH, Ahn CB. Field inhomogeneity correction using partial differential phases in magnetic resonance imaging. Physics in medicine and biology 2015;60(10): 4075.
5. Schofield MA, Zhu Y. Fast phase unwrapping algorithm for interferometric applications. Opt Lett 2003;28(14): 1194-6.
6. Yanez F, Fan A, Bilgic B, Milovic C, Adalsteinsson E, Irarrazaval P. Quantitative susceptibility map reconstruction via a total generalized variation regularization. In Pattern Recognition in Neuroimaging 2013; International Workshop on. IEEE 2013: 203-6.
7. Bilgic B, Chatnuntawech I, Langkammer C, Setsompop K. Sparse methods for Quantitative Susceptibility Mapping. In SPIE Optical Engineering+ Applications. International Society for Optics and Photonics 2015: 959711-959711.
Figures