1433
A Fast Adaptive Multispectral Nonlocal Denoising Filter1Laboratory of Clinical Investigation, National Institute on Aging, NIH, Baltimore, MD, United States
Synopsis
We introduce a new high-performance nonlocal filter, NESMA, for noise reduction in multispectral (MS) MR imaging. Through extensive analysis, we show that the NESMA filter demonstrates a high degree of overall image denoising while preserving edges and small structures. We compared the performance of the NESMA filter to the multispectral nonlocal maximum likelihood (MS-NLML) filter. Although the MS-NLML filter is highly efficient, it requires extensive computational time. NESMA markedly decreases computation time while maintaining comparable levels of noise reduction and feature preservation. Finally, we show that adaptive selection of similar voxels further improves filtering quality.
Purpose
Several studies have demonstrated the importance of image denoising in MRI to improve diagnostic accuracy, quality of image registration and segmentation, and parameter estimation.1-3 MRI studies often involve acquiring multispectral images i.e., images obtained at different echo times (TEs), repetition times (TRs), flip angles, or diffusion b-values. Inclusion of multispectral information has been shown to enhance the quality of image filtering.4,5 Recently, the multispectral nonlocal maximum likelihood (MS-NLML) filter has been developed which outperforms current filters in term of noise reduction and preservation of small structures.4,6,7 However, MS-NLML requires extensive computation time, which limits its application for recurrent analyses or large datasets. Here, we introduce a variant of this filter, termed Nonlocal Estimation of multi-Spectral Magnitudes (NESMA), which replaces the ML intensity estimate with a mean estimate. This greatly reduces computation time while largely preserving performance. A further performance gain is achieved by using a spatially-varying adaptive selection of the number of similar voxels used in the estimation of the signal intensity of the index voxel.Methods
Filter Design: MS-NLML uses ML estimation (MLE) based on R similar voxels to restore the intensity of the index voxel. This process requires extensive computational time. In NESMA filtering, MLE is replaced by averaging the intensity of R voxels. In conventional NLML-based filters, R is defined using the Euclidean distance (ED).6,7 The value of R is determined empirically and is held constant for all voxels. In this study, the similarity between the index voxel, i, and a voxel j is determined using a relative ED (RED) given by
$$RED(i,j) = \frac{\sum_{k=1}^K|S_k(i)-S_k(j)|}{\sum_{k=1}^KS_k(i)}$$
where S is the measured signal intensity and K is the total number of spectral images. RED is calculated for each voxel over a window of size M centered on i. Voxels with RED beneath a user-specified threshold are considered similar to the index voxel. This ensures that partial volume artifacts are not introduced by forced incorporation of dissimilar voxels.
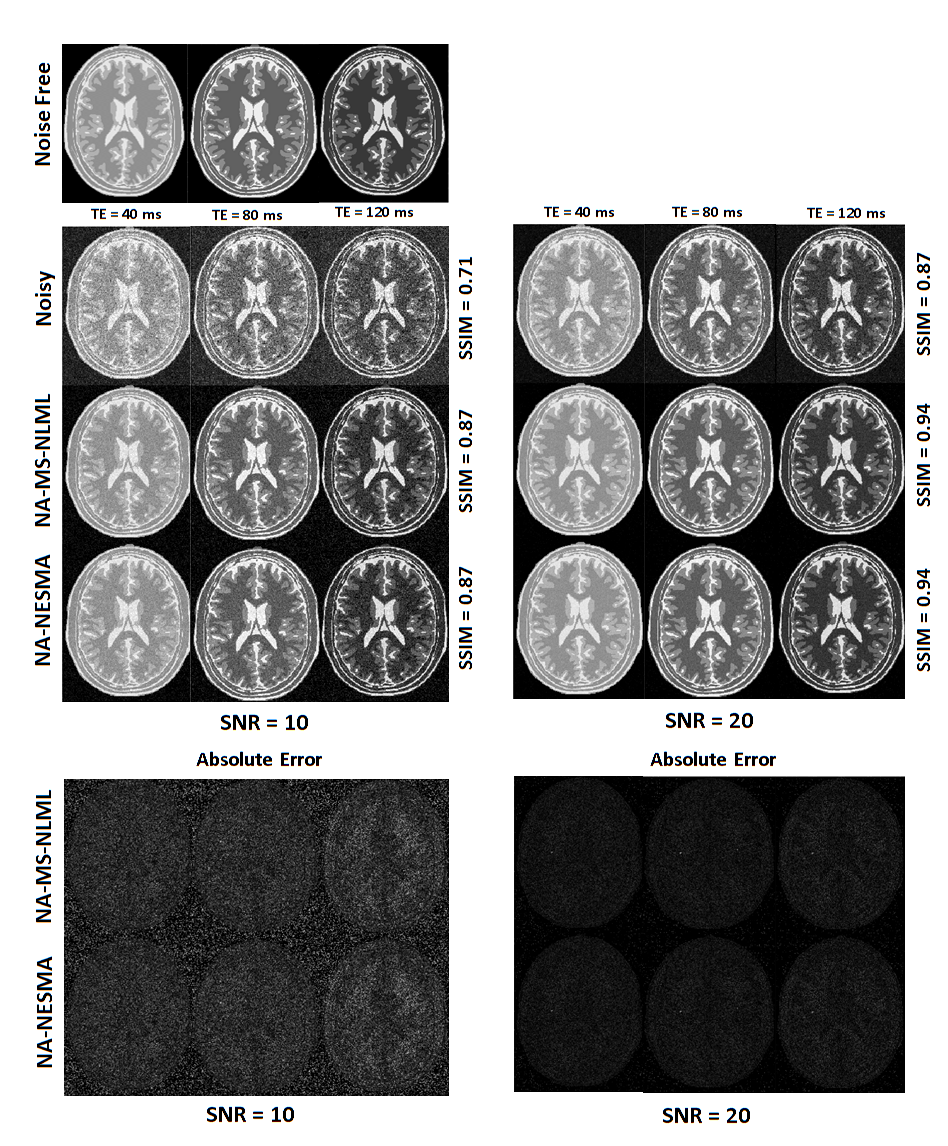
Numerical analysis: 3D T2W images of human brain were generated with representative T2 values for white matter, gray matter, and cerebrospinal fluid chosen as 60ms, 85ms, and 180ms, respectively.8,9 Images were generated at TEs increasing uniformly from 10 to 200ms (K=20). Rician noise was incorporated to achieve the desired SNR.4 Filtering performance of non-adaptive NESMA (NA-NESMA) and non-adaptive MS-NLML (NA-MS-NLML) was compared using visual inspection, absolute error (AE) maps, and the structural similarity metric (SSIM).10 R was fixed to 50 voxels. Performance of NA-NESMA and adaptive NESMA (A-NESMA) filters were compared using visual inspection and SSIM. Analyses were performed at two different SNRs. For each filter, computation time was calculated for images of different sizes. The search window size M was fixed to 25 voxels x 25 voxels x 3 voxels. For each SNR, the threshold was set to the optimal value determined using visual inspection.
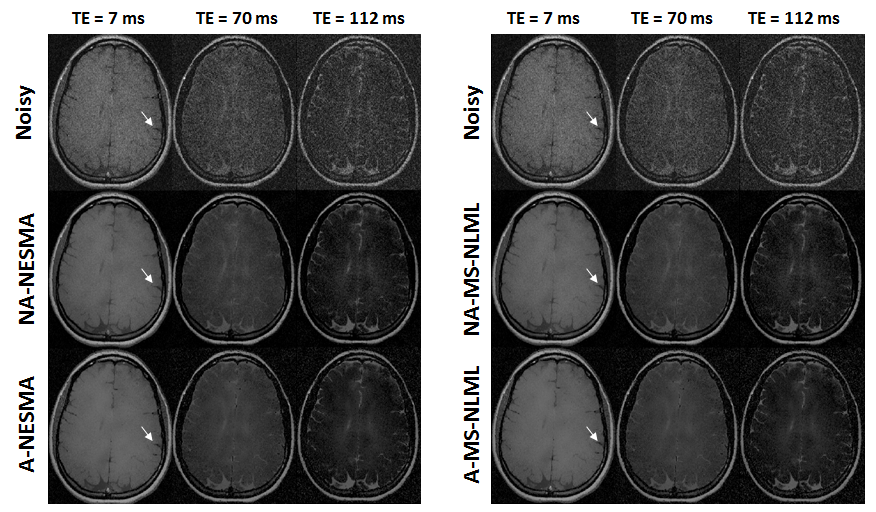
Experimental analysis: 2D T2W images were acquired from the brain of a 23-year-old female using a CPMG sequence with TE increasing uniformly from 7ms to 224ms (K=32), TR of 1200ms and voxel size of 0.67mm x 0.48mm x 2mm. Filtering parameters were similar to those used in the simulation analysis. Evaluation of filtering quality was restricted to visual inspection.
Results & Discussion
NA-MS-NLML and NA-NESMA filters provided substantial reduction of noise and detail preservation illustrated by visual inspection of filtered images, AE-maps, and SSIM (Fig.1). Further, NA-NESMA showed comparable performance to NA-MS-NLML.
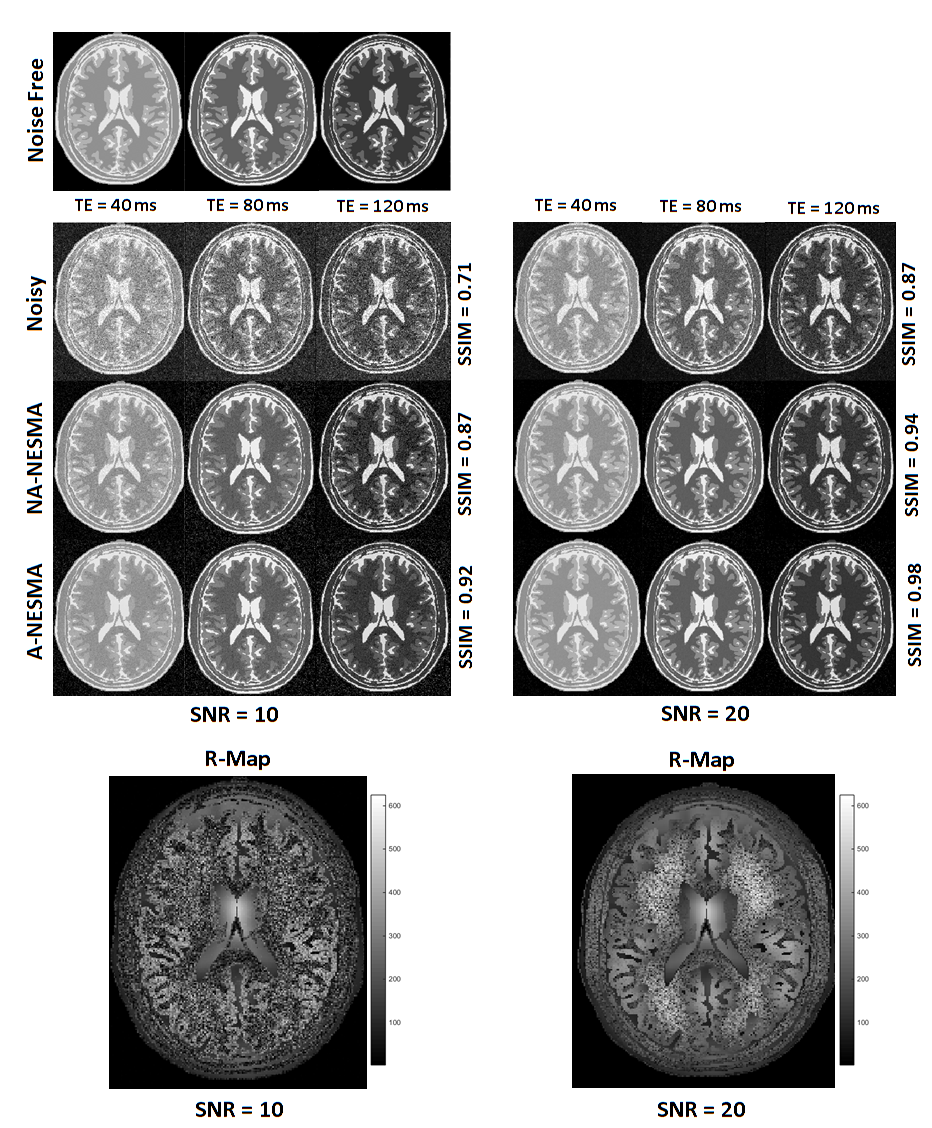
Visual inspection of filtered images and SSIM evaluation shows that A-NESMA exhibits superior noise reduction as compared to NA-NESMA (Fig.2). Maps of R, the locally-determined number of similar voxels, showed large values in homogenous regions and lower values in regions with fine structures. This allows for increased noise reduction while preserving small structures.
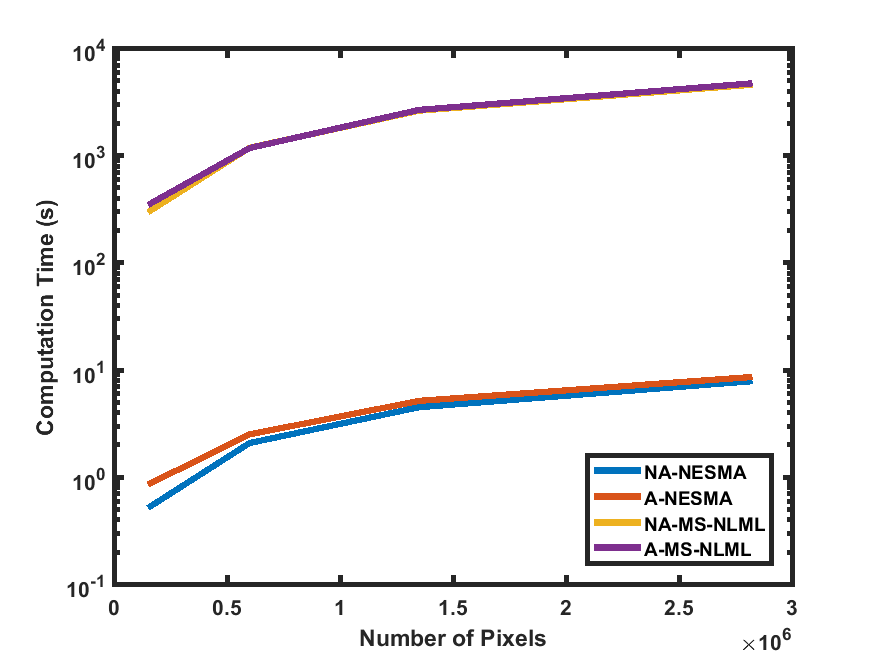
Fig.3 demonstrates that NESMA is approximately three orders of magnitude faster than MS-NLML. For all filters, the computation time increases linearly with increasing image size. Finally, the computation time for adaptive filters is only slightly longer than that of the corresponding non-adaptive filters.
Fig.4 compares the performance of all filters. As expected, NESMA shows comparable performance to MS-NLML. Further, the adaptive filters exhibited superior performance as compared to the non-adaptive filters.
Conclusion
We propose a fast adaptive nonlocal filter to denoise multispectral MRI image sets. The NESMA filter greatly reduced computation time compared to the MS-NLML filter while maintaining a high level of noise reduction. Adaptive selection of similar voxels further improves noise reduction by spatially selecting the optimal number of similar voxels. The high performance and low computation time of NESMA filtering indicates its potential to be used in routine clinical applications.Acknowledgements
This work was supported by the Intramural Research Program of the NIH, National Institute on Aging. M.C.M. and M.B. contributed equally to this work.References
1) Faisal A., Parveen S., Badsha S., Sarwar H. An improved image denoising and segmentation approach for detecting tumor from 2-D MRI brain images. Advanced Computer Science Applications and Technologies International conference (2012)
2) Dikaios N., Punwani S., Hamy V., et al. Noise estimation from averaged diffusion weighted images: Can unbiased quantitative decay parameters assist cancer evaluation. Magnetic Resonance in Imaging. 2014, 71(6): 2105-2117
3) C. Gaser, P. Coupe. Impact of non-local means filtering on brain tissue segmentation. Organization for human brain mapping annual meeting (2010)
4) Bouhrara M., Bonny J.M., Ashinsky B., Maring M., Spencer R. Noise Estimation and Reduction in Multispectral Magnitude Resonance Images. IEEE Trans. Med. Imaging. 2016:1-13
5) Manjon J. V., Robles M., Thacker N.A. Multispectral MRI De-noising using Non-Local Means. Proc. MIUA.
6) He L., Greenshields, I.R. A nonlocal maximum likelihood estimation method for Rician noise reduction in MR images. IEEE Trans. Med. Imaging. 2009: 165-172
7) Rajan J., Van Audekerke J., et al. An adaptive non-local maximum likelihood estimation method for denoising magnetic resonance images. IEEE International Symposium on Biomedical Imaging 2012: 1136-1139
8) Collins D.L., Zijdenbos A.P et al. Design and Construction of a Realistic Digital Brain Phantom. IEEE Transactions on Medical Imaging. 1998:463-468
9) Kwan R.K.-S., Evans A.C., Pike G.B. MRI simulation-based evaluation of image-processing and classification methods. IEEE Transactions on Medical Imaging. 1999:1085-1097
10) Wang Z., Bovik A. et al. Image Quality Assessment: From Error Visibility to Structural Similarity. IEEE Transactions on Image Processing. 2004:600–612
Figures