1431
Brain Network Atlas Estimation using Centered Graph Shrinkage with Application to Developing and Aging Brains1Department of Radiology and BRIC, University of North Carolina, Chapel Hill, NC, United States, 2Department of Brain and Cognitive Engineering, Korea University, Seoul, Republic of Korea
Synopsis
Learning how to average brain networks (i.e., build a brain network atlas) constitutes a key step in creating a reliable ‘mean’ representation of a set of normal brains, which can be used to spot deviations from the normal network atlas (i.e., abnormal cases). However, this topic remains largely unexplored in neuroimaging field. In this work, we propose a network atlas estimation framework through a non-linear diffusion along the local neighbors of each node (network) in a graph. Our evaluation on both developing and aging datasets showed a better ‘centeredness’ of our atlas in comparison with the state-of-the-art network fusion method.
Purpose
A variety of methods have been developed to spatially normalize a population of brain images to estimate a ‘mean image’ (i.e., a population template or atlas), which were further refined to estimate a sharp atlas that is well-centered and more representative of each individual image [1]. However, methods for defining brain network atlases are still absent. Inspired from the network fusion method introduced in [2], we propose a new framework to estimate brain network (i.e., connectivity) atlas, through building a graph manifold of networks that progressively shrinks towards the ‘mean’ network.Methods
Recently,
Wang et al. introduced in [2] a robust method to non-linearly fuse a set of
similarity matrices, where each matrix encodes a network. Basically, given $N$ networks, each network is iteratively updated
through diffusing the global structure of the averaged remaining $(N-1)$ networks across its local structure. A key
limitation of such an approach is that it averages all remaining networks
without considering their proximity or relationship to the current network. To
address this issue, we propose to explore the data distribution during the fusion
process for network atlas estimation, through modeling their relationships
using a graph [3].
This will
better preserve the topology of the manifold, where the
individual networks sit as they smoothly fuse toward a well-centered network.
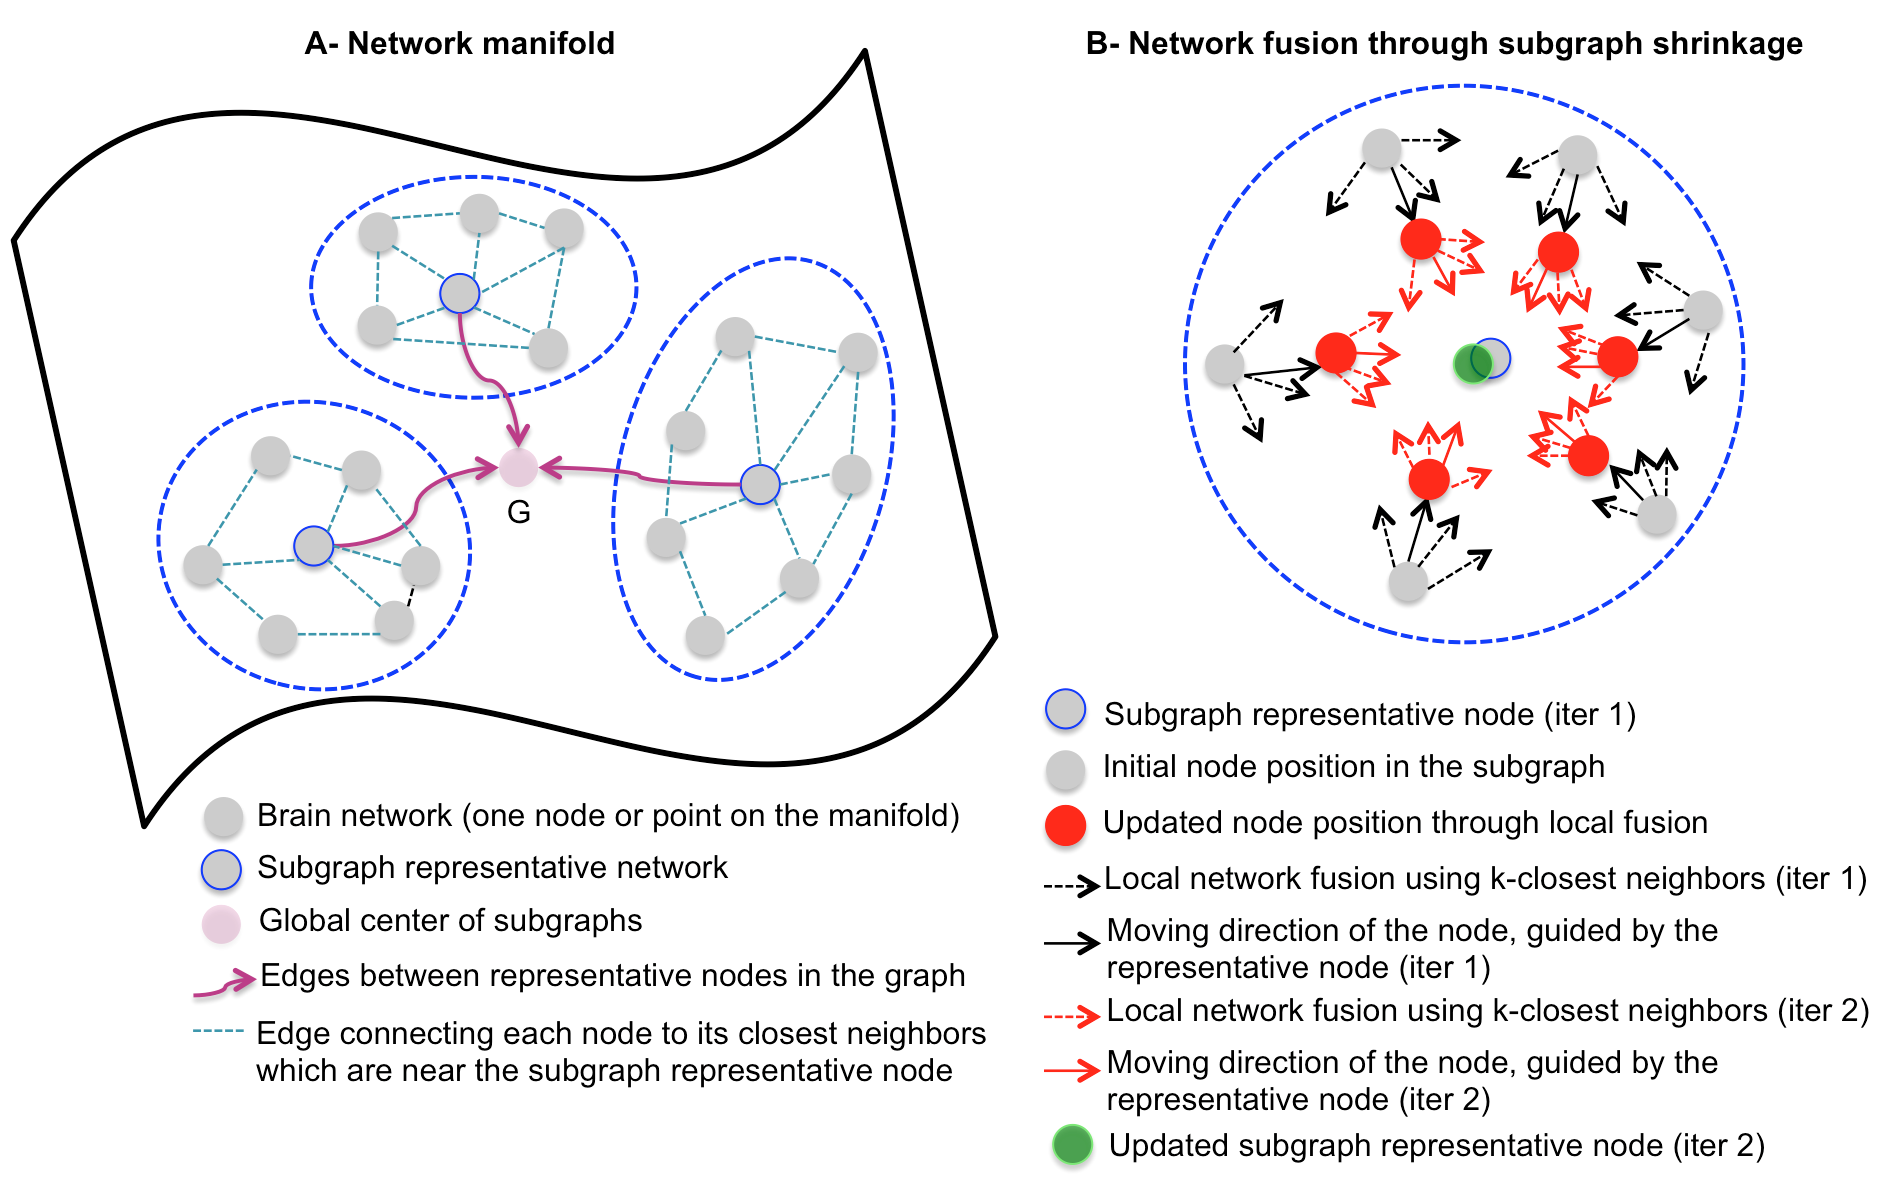
To do so, we propose
the following steps described in Fig.1.
(1) Use affinity propagation (AP) clustering method [4] to group similar nodes
(i.e., networks) and define their representatives, so they can be fused in the
same way. (2) Build a fully connected graph, where each node denotes an
individual brain network. Specifically, on a local level, each identified AP
cluster is defined as a sub-graph, where similar nodes are connected with a
weighted edge; while on a higher level, the representatives of each cluster are
connected within a global graph. (3) To ensure that the local fusion of each
node with nearby nodes is smooth, we average the representatives of all
sub-graphs to generate a center global network. Then, we move each node (i.e.,
locally update each network) by fusing it with its closest neighboring nodes (i.e.,
networks) through an iterative process as in [2] in the direction of the global
center. (4) Since the representative nodes are moved, we subsequently update
the global center. (5) Repeat steps (3-4) until the global center becomes
stable. Eventually, as the original graph shrinks all nodes will locate at the
vicinity of the global center, where their averaging is more reliable and
meaningful to produce the sought ‘network atlas’.
Results
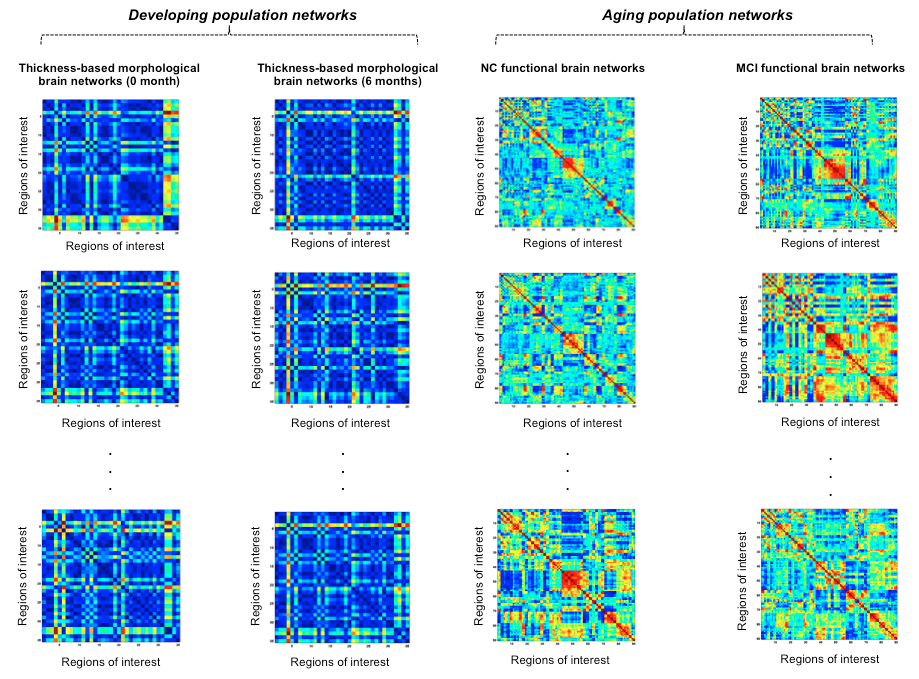
Fig. 2 shows the two different datasets used for evaluation:
Dataset 1 (developing infant brains): 40 infant brains at ages 0 and 6 months, where each cortical surface was parcellated into 35 regions [5]. By computing the pairwise absolute difference in cortical thickness between pairs of regions of interest, we generate a 35x35 morphological connectivity matrix.
Dataset 2 (aging brains): 40 normal and 40 MCI brains were parcellated into 90 regions using AAL template. Matrices of size 90x90 were estimated from resting-state fMRI.
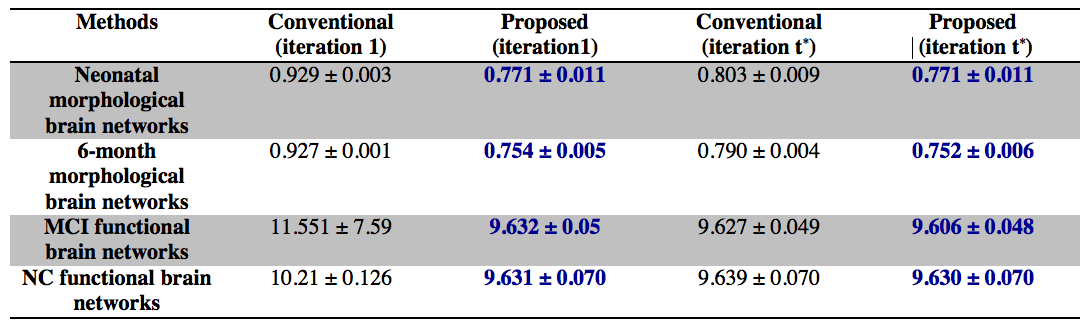
Evaluation: To evaluate the centeredness of the estimated brain network atlas, we compute the mean squared distance between the estimated network atlas and each individual network in the population. Table 1 shows the mean squared distance computed using the proposed network atlas estimation method and the previous method in [2]. The smaller the evaluation distance the more centered is the atlas with respect to the data points on the manifold. We used t-test to evaluate the statistical significance of our method in comparison with [2]. Ours produced a more centered atlas than the previous method [2], with p <<0.001.
Discussion and conclusion
Building on the network fusion strategy introduced
in [2], we proposed a graph shrinkage strategy that follows the local manifold
structure of a set of brain networks to gradually fuse them through a
diffusion process until reaching the final network
atlas. As shown in Table 1, our method produces a more centered atlas
within only a few iterations compared with [2], which requires more than (t*
>20) iterations for the ‘centeredness’ error to decrease until convergence
as demonstrated in [2]. Hence, our
method is able to achieve better results within a smaller computational time. A
potential clinical application of building network atlases is to learn the set
of distinctive brain connections for
each population of networks (e.g., normal) with respect to another population
of networks (e.g., specific brain disorder).
Acknowledgements
This work was supported in part by National Institutes of Health grants (MH100217, MH108914 and MH107815).References
[1] Wu G, Jia H, Wang Q, Shen D. Sharp Mean: Groupwise Registration Guided by Sharp Mean Image and Tree-based Registration. NeuroImage. 2011;56(4):1968-1981.
[2] Wang B, Mezlini AM, Demir F, Fiume M, Tu Z, Brudno M, Haibe-Kain B, Goldenberg A. Similarity network fusion for aggregating data types on a genomic scale. Nature Methods. 2014;11:333-337.
[3] Wu G, Peng X, Ying S, Wang Q, Yap PT, Shen D. eHUGS: Enhanced Hierarchical Unbiased Graph Shrinkage for Efficient Groupwise Registration. PloS one. 2016 Jan 22;11(1):e0146870.
[4] Frey BJ, Dueck D. Clustering by passing messages between data points. Science. 2007;315:972-976.
[5] Li G, Wang L, Shi F, Lin W, Shen D. Simultaneous and consistent labeling of longitudinal dynamic developing cortical surfaces in infants. Med Image Anal. 2014;18:1274-1289.
Figures