1430
Evaluating effect of B1 field Inhomogeneity on DCE-MRI Data Analysis of Brain Tumor Patients at 3T1Centre for Biomedical Engineering, Indian Institute of Technology Delhi, New Delhi, India, 2Department of Radiology, Fortis Memorial Research Institute, GURGAON, 3Biomedical Engineering, All India Institute Of Medical Science, New Delhi, India
Synopsis
In the current study, transmit B1 field inhomogeneity(B1FI) distribution and propagation of flip-angle(FA) related errors to Dynamic-contrast-enhanced(DCE) MRI data analysis in brain tumors of human subjects at 3T MRI were studied. Experimental and simulation studies were performed to evaluate the propagation of these errors to DCE-MRI data analysis and its correction were performed during signal intensity(S(t)) to concentration-time-curve(C(t)) conversion. This study show that B1FI introduced substantial errors in DCE-MRI data analysis(tracer-kinetic and hemodynamic parameters) and these errors were mitigated by correcting FA using B1 map. B1FI related error also showed dependence on concentration of contrast agent and length of concentration-time-curve.
INTRODUCTION
At high field MRI scanner(3T), there can be a substantial transmit B1 field inhomogeneity(B1FI) depending upon RF coil used and tissue 1,2,3,4 This B1FI introduces errors in flip angle(FA). MRI images which are acquired using gradient echo based sequences are highly sensitive to B1FI. Moreover, these errors can propagate to further quantitative analysis. In general, dynamic-contrast-enhanced(DCE) MRI data is acquired using fast GRE sequences like SPGR/TFE. This makes signal intensity of DCE-MRI dependent upon FA. Therefore, any B1FI can result errors in FA and hence in signal intensity time curves(S(t)). DCE-MRI data can be analyzed using various models, which result in tracer kinetic parameters5,6 like permeability(Ktrans), volume of extravascular-extracellular-space(Ve), plasma volume(Vp), as well as first pass parameters like cerebral blood volume(CBV), cerebral blood flow(CBF). In general, s(t) curves are converted to concentration time curves(C(t)) before further quantitative analysis. FA related errors in S(t) are propagated to C(t) and hence to further analysis. DCE-MRI is widely used for characterization and diagnosis of intracranial mass lesions. Recently, a study on effect of B1FI on DCE-MRI data analysis from breast cancer patients was reported7. In that study, effect of B1FI on Ktrans and Ve was reported. However, there are only few studies on evaluating the effect of B1FI on DCE-MRI data analysis. Moreover, dependence of these errors on concentration of contrast and length of data is not known. We hypothesize that propagation of error is parameter specific and should be evaluated for individual parameter and tissues. Purpose of this study was to evaluate the effect of B1FI on DCE-MRI data analysis of brain tumor patients and to perform its correction.METHODS
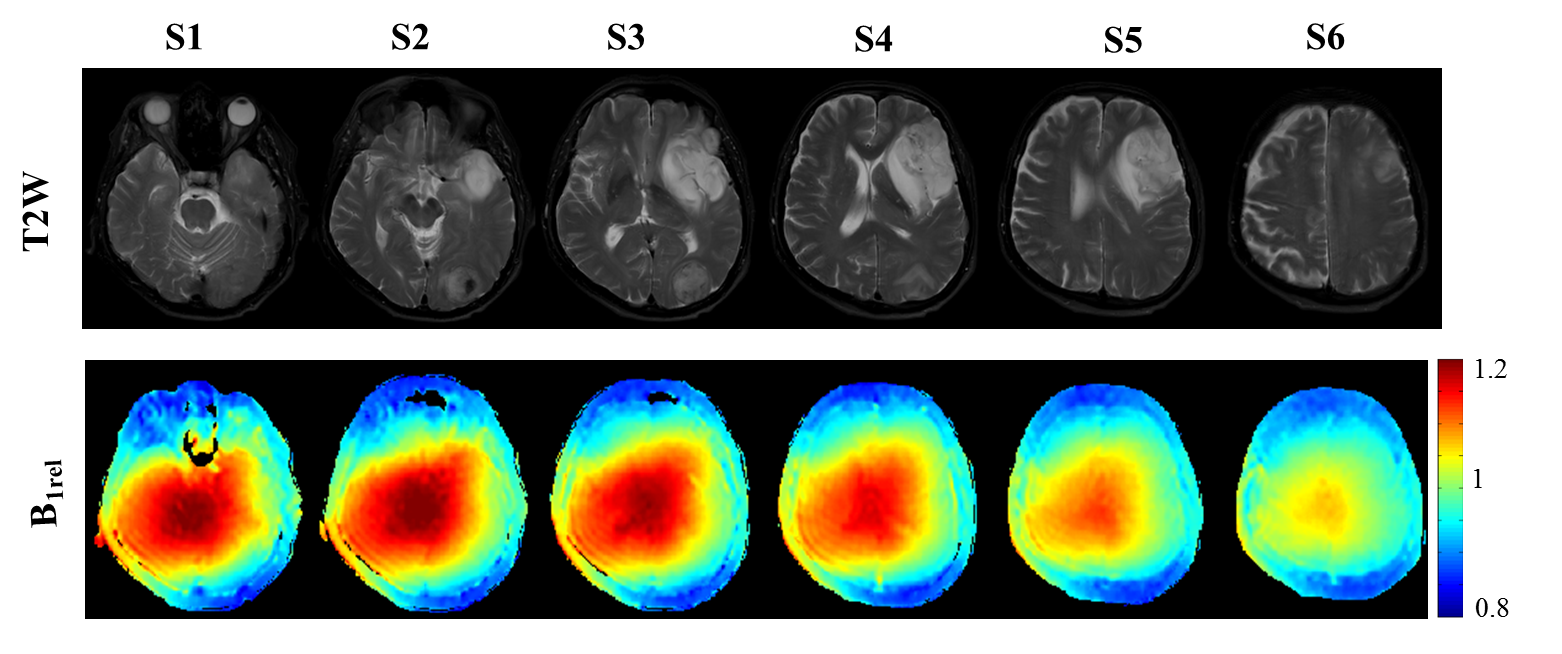
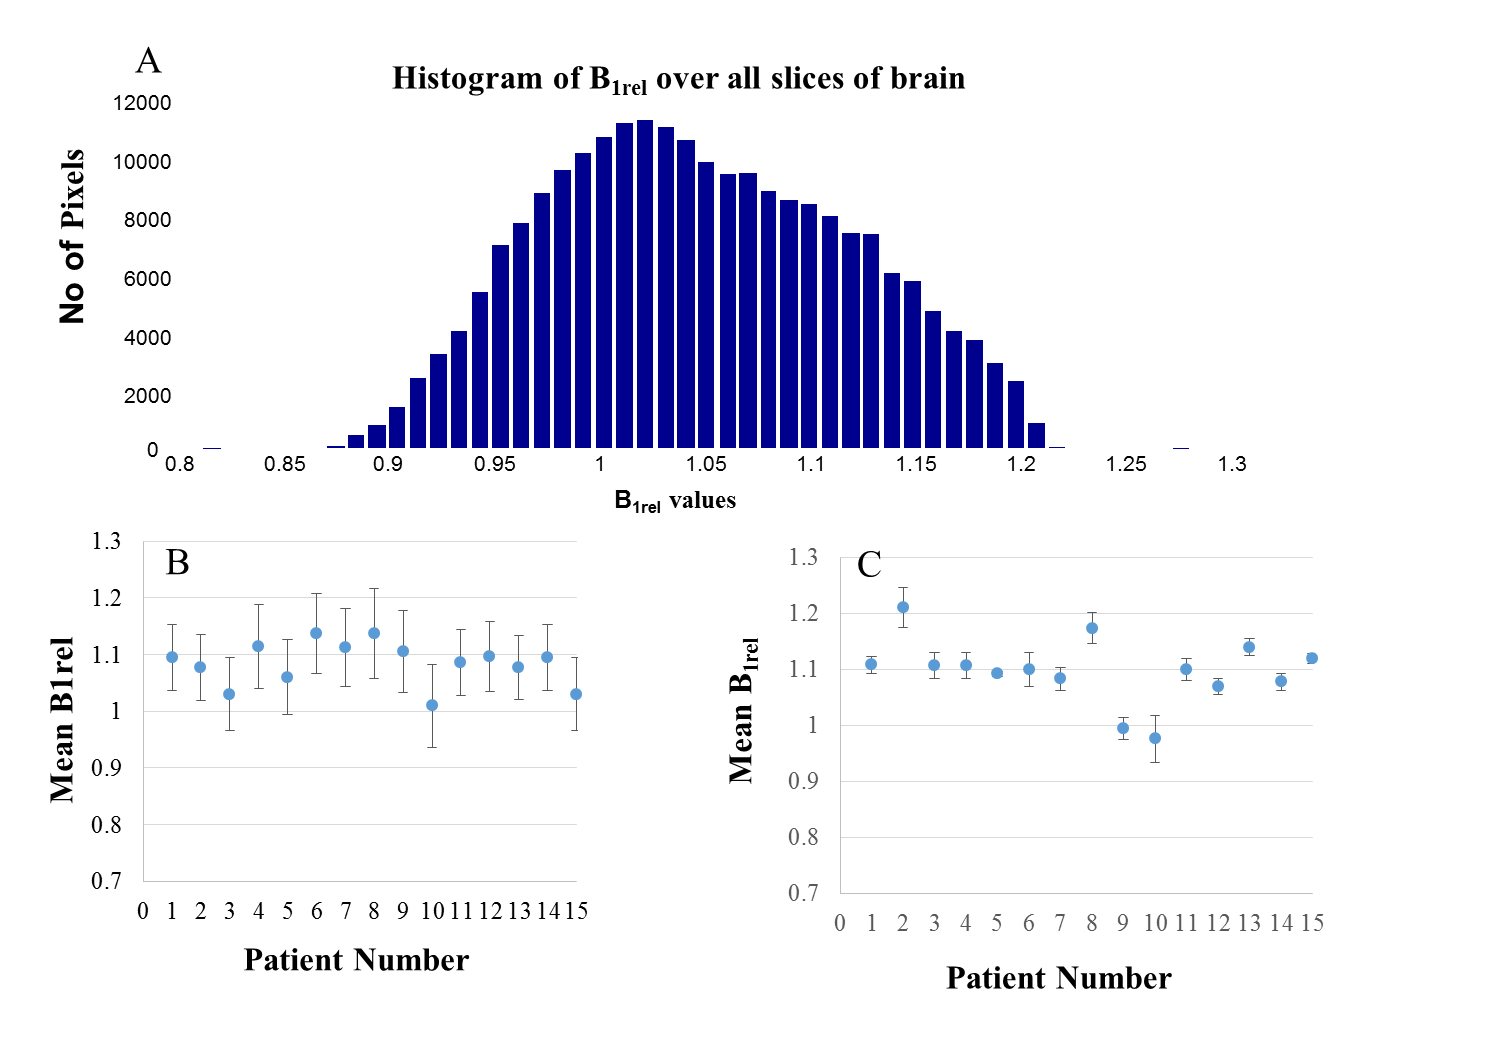
This study was conducted under an approved Institute Review Board protocol. MRI study was conducted on human brain of fifteen brain tumor patients at 3T (Ingenia, Philips Healthcare, The Netherlands). Along with conventional MRI, data for B1 mapping, T1 mapping and DCE-MRI were acquired. Post processing was performed for generating relative B1(B1rel) maps8, T1 maps, conversion of signal intensity time(S(t)) curve to concentration time(C(t)) curve followed by tracer kinetic analysis(Ktrans, Ve, Vp, Kep) and first pass analysis(CBV, CBF)9. DCE-MRI data was analyzed without and with correction of B1FI and errors were computed. For correction of B1FI related errors, voxelwise correction of FA using B1rel map were performed during S(t) to C(t) conversion. Simulations were performed to demonstrate propagation of B1FI related errors to concentration of contrast. Simulated S(t) curves mimicking those in tumor tissue were generated and FA errors were introduced followed by further analysis. Simulation data for demonstrating dependence of B1FI related errors on concentration of contrast agent and length of C(t) were generated.RESULTS
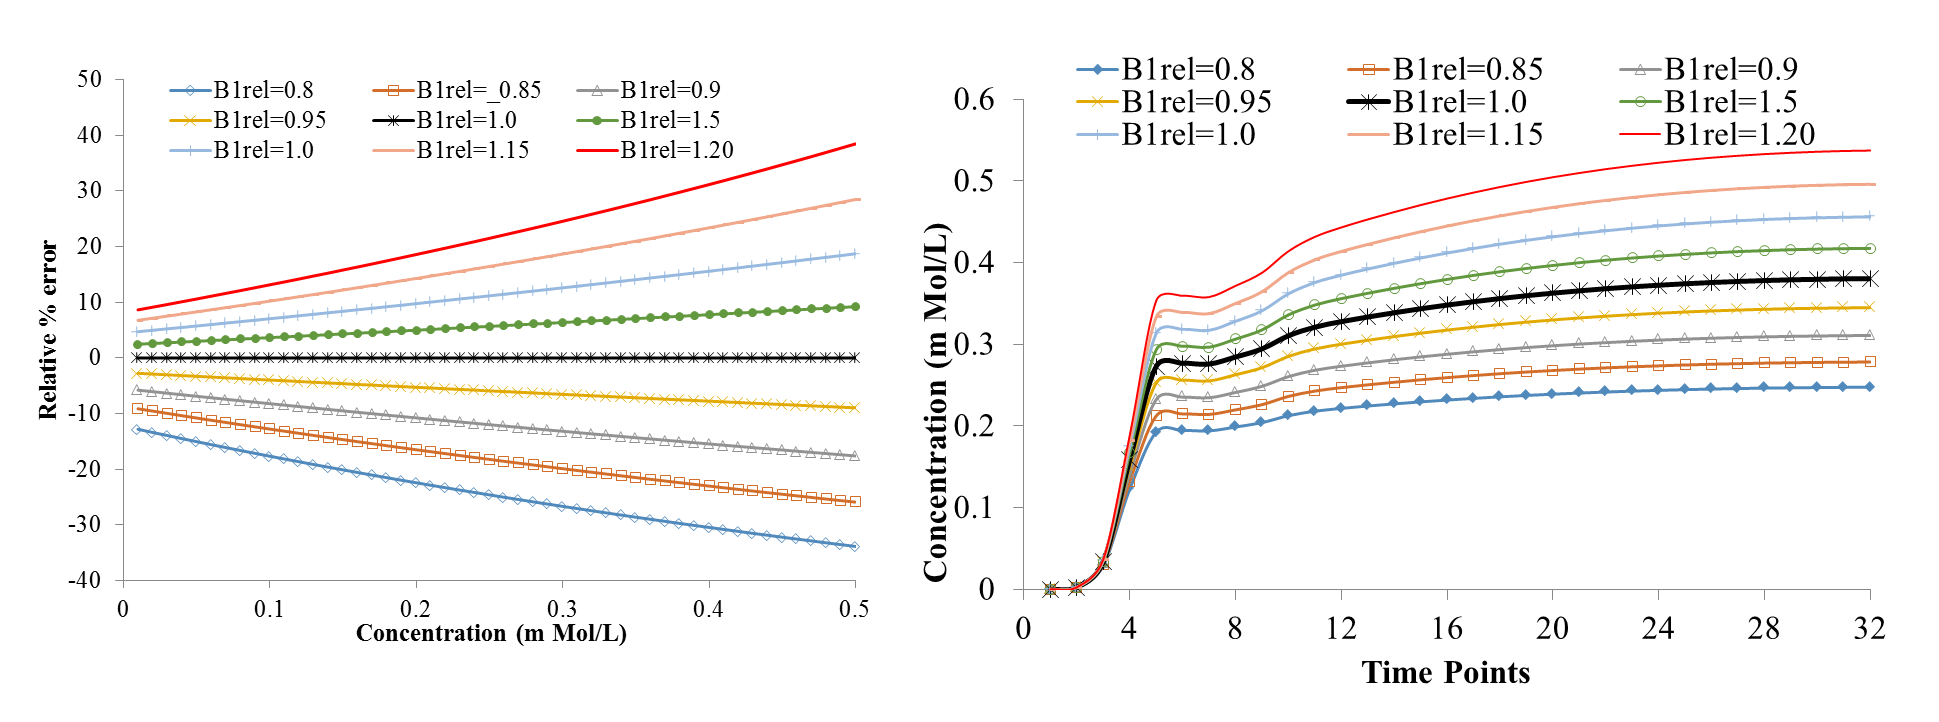
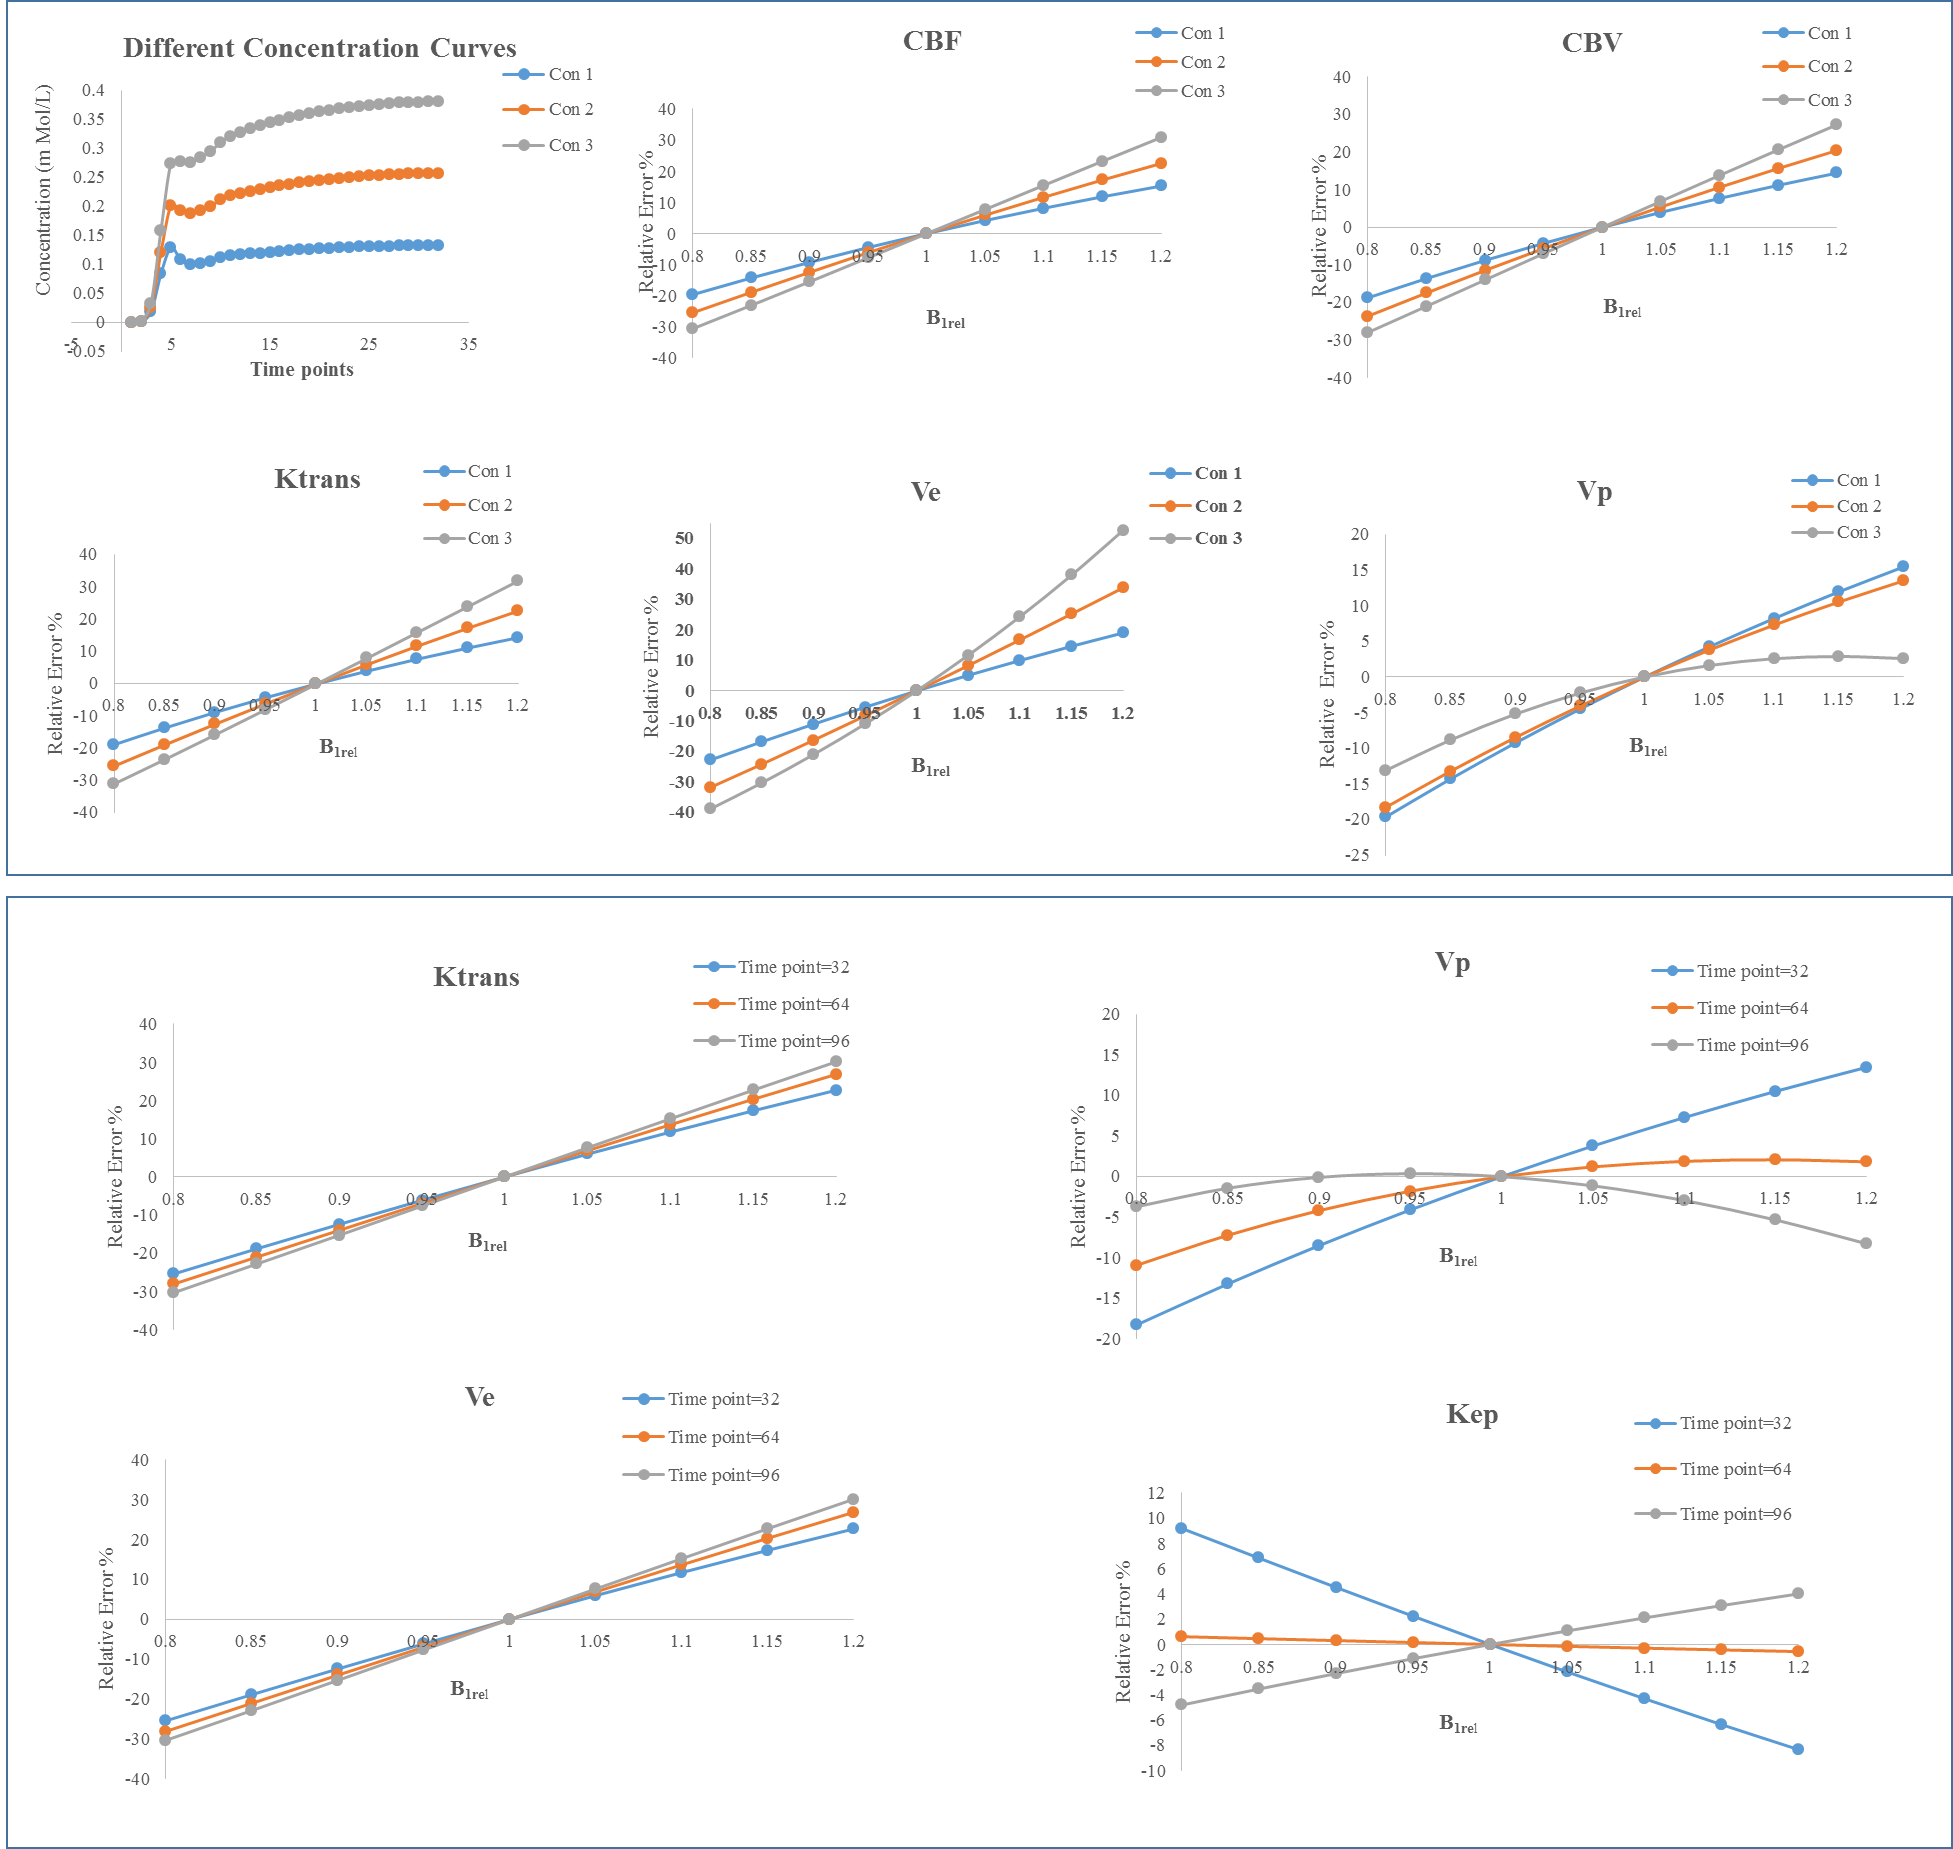
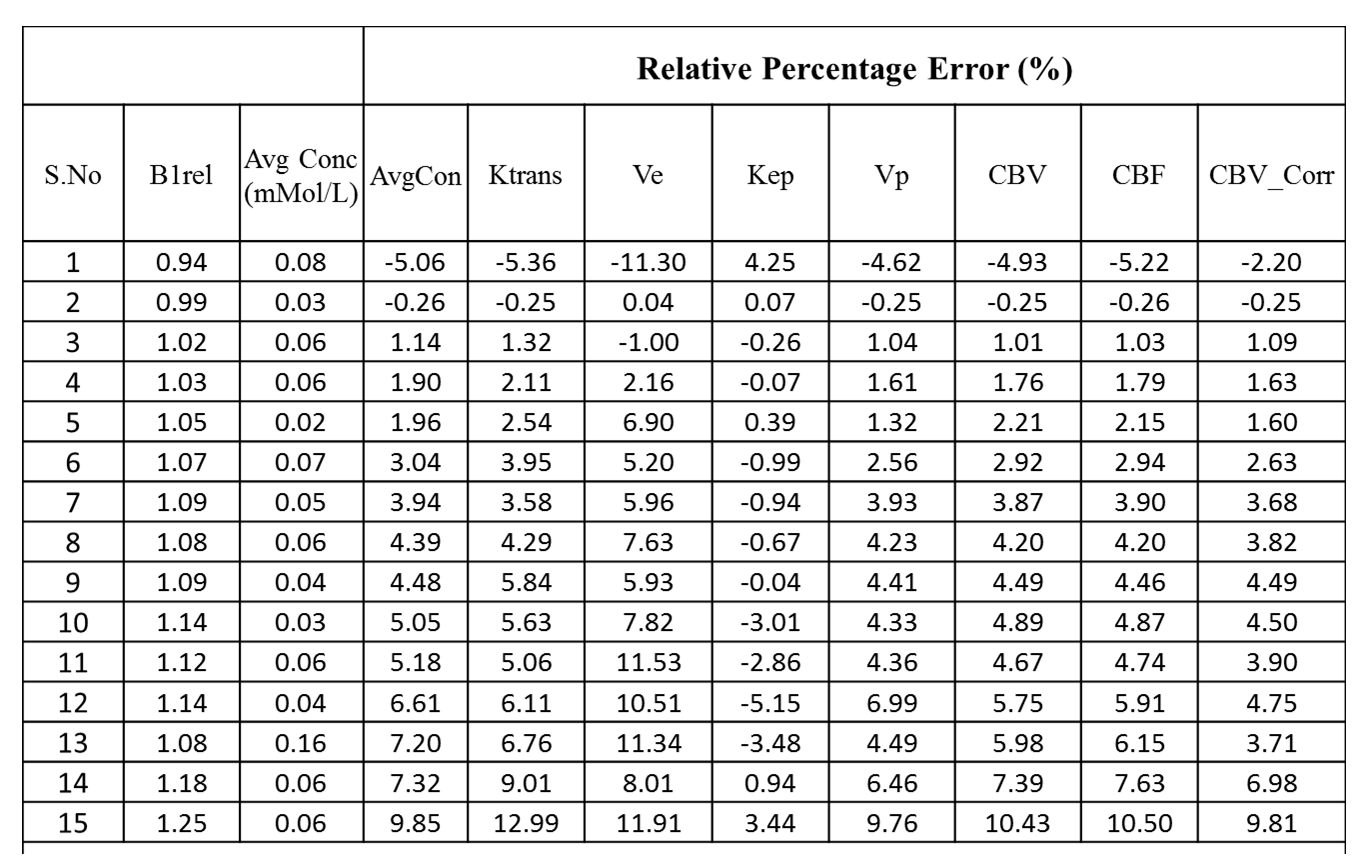
B1rel maps from human brain showed a high(upto~20%) inhomogeneity(Fig-1&2) in entire brain including tumor tissue. Tissues with high B1rel value showed higher C(t) and vice versa. Moreover, errors were large for high values of C(t) and vice versa. Errors in Ktrans, Ve, Vp, CBV, CBF were directly related to B1rel, while in Kep it was inversely related. These results are shown in Table-1. Simulation results were similar to experimental. Overall, errors in all parameters increased with increase in concentration of contrast agent(Fig-3). Parameter Ve showed highest error. Errors in all parameters except Ve and Vp showed a linear dependence on B1rel values. Errors in Ve increases linearly at low concentration level followed by non-linearly increase at high concentration values. However, errors in Vp follow a more complex trend. Effect of length of C(t) or S(t) on the percentage error due to B1FI in Ktrans and Ve was small(Fig-4). Errors in Vp showed a complex dependence on number of time points.DISCUSSION
In the current study errors in C(t) due to B1FI increases non linearly with increase in concentration of contrast agent. The simulation studies have been designed to verify the results obtained using patient data. Moreover, it’s difficult to cover different scenario using experimental data. Simulations helped in demonstrating the dependence of B1FI errors on the amount of contrast agent. Without simulations it’s difficult to demonstrate that B1FI errors depend both on B1rel value and initial contrast agent concentration. Moreover the FA related errors in kinetic parameters also showed dependence on the time used to obtain DCE MRI data.CONCLUSION
In conclusion, a substantial B1FI related errors
were introduced in the quantitative parameters derived from DCE-MRI data. B1FI related
errors in DCE-MRI analysis showed dependence on B1rel values, contrast agent
concentration as well as on length of DCE-MRI data. These errors can be
mitigated by correcting FAs using B1rel map during conversion of S(t) to C(t).Acknowledgements
Authors acknowledge the funding support from Science and Engineering Research Board (SERB) (grant number: YSS/2014/000092) and internal grant from IRD, IIT Delhi. The Authors acknowledge technical support of Philips India Limited in MRI data acquisition. The authors thank to Dr. Indrajit Saha, Ms Rupsa for technical assistance; Dr. Pradeep Kumar Gupta for data handling.References
[1] Saekho S, Boada F. Small tip angle three-dimensional tailored radiofrequency slab-select pulse for reduced B1 inhomogeneity at 3 T. Magn. Reson. Med. 2005.
[2] Singerman R, Denison T. Simulation of B 1 Field Distribution and Intrinsic Signal-to-Noise in Cardiac MRI as a Function of Static Magnetic Field. J. Magn. Reson. Imaging [Internet] 1997.
[3] J.P.Hornak, J.Szumowski. Magnetic field mapping. Magn. Reson. Med. 1988;6:158–163.
[4] Maier J, Glover G. Method for mapping the RF transmit and receive field in an NMR system. US Pat. 5,001,428 1991.
[[5] Tofts P. Modeling tracer kinetics in dynamic Gd-DTPA MR imaging. J. Magn. Reson. Imaging, 1997.
[6] Tofts P, Kermode A. Measurement of the blood-brain barrier permeability and leakage space using dynamic MR imaging. 1. Fundamental concepts. Magn. Reson. Med. 1991.
[7] Sung K. Transmit B1+ field inhomogeneity and T1 estimation errors in breast DCE-MRI at 3 tesla. J. Magn. Reson. Imaging [Internet] 2013
[8] Cunningham CH, et al. Saturated double-angle method for rapid B1+ mapping. Magn. Reson. Med. 2006;55:1326–1333
[9] Singh A, et al. Quantification of physiological and hemodynamic indices using T1 dynamic contrast-enhanced MRI in intracranial mass lesions. J. Magn. Reson. Imaging 2007;26:871–880.
Figures