1422
Quantitative Susceptibility Map Reconstruction from MR Phase Data Using Morphology-Adaptive Total Variation1Guangdong Provincial Key Laborary of Medical Image Processing, School of Biomedical Engineering, Southern Medical University, Guangzhou, People's Republic of China, 2Philips Healthcare, Guangzhou, People's Republic of China
Synopsis
MEDI reduces streaking artifacts in QSMs by minimizing total variation in smooth regions in the susceptibility map. However, MEDI still contains artifacts near image edges because this method does not impose any constraint on voxels near edges. We aim to improve the reconstruction of quantitative susceptibility map from MR phase data by introducing morphology-adaptive TV regularization which imposes the TV constraint on the whole susceptibility map but with different weights in smooth and non-smooth regions. The performance of the proposed method is demonstrated in both simulation and in vivo data sets.
Purpose
Quantitative susceptibility mapping (QSM) determines tissue magnetic susceptibility by the field map deconvolution with the dipole kernel. Due to the zero values of the dipole kernel along the magic angle in the k-space domain, the computed susceptibility map contains streaking artifacts [1]. Various regularization methods have been proposed to reduce the effect of this ill-posed inversion problem on quantified susceptibility map from single-orientation acquisitions. Morphology enabled dipole inversion (MEDI) [2, 3] can reduce streaking artifacts by minimizing total variation (TV) in smooth regions, which are identified as voxels with small magnitude image gradients. However, the susceptibility map generated by MEDI still contains severe artifacts near image edges because this method does not impose any regularization on voxels near edges. This study aims to improve the reconstruction of quantitative susceptibility map from MR phase data by introducing morphology-adaptive TV regularization which imposes the TV constraint on the whole susceptibility map but with different weights in smooth and non-smooth regions.Theory and methods
The reconstruction of quantitative susceptibility map using morphology-adaptive TV regularization can be formulated as follows:
$$$\min_{\chi}\parallel W\left(F^{-1}DF\chi-\phi\right)\parallel_2^2+\lambda_{1}\parallel M\triangledown \chi\parallel_{1}+\lambda_{2}\parallel \left(1-M\right)\triangledown \chi\parallel_{1}$$$ (1)
where χ is the susceptibility map, $$$\phi$$$ the local tissue phase, $$$F$$$ the Fourier transform operator, $$$D$$$ the dipole kernel in k-space, $$$W$$$ the noise weighting, $$$\parallel \star\parallel_2^2$$$ the L2 norm, $$$\triangledown$$$ the gradient operator, $$$M$$$ the binary mask of smooth regions in the magnitude image, $$$\lambda_{1}$$$ and $$$\lambda_{2}$$$ regularization parameters, $$$\parallel\star\parallel_{1}$$$ the L1 norm, and $$$\parallel\triangledown\chi\parallel_{1}$$$ denotes the L1 norm of gradient, i.e., TV. The second term picks a solution with smooth regions matching those of magnitude images, and thus can effectively suppress streaking artifacts in these smooth regions. The third term imposes the piecewise constant constraint on reconstructed susceptibility map in non-smooth regions to reduce quantification errors at these edge voxels. Eq. (1) provides a spatially adaptive regularization for the QSM inversion. The regularization parameter $$$\lambda_{2}$$$ is generally set to be smaller than $$$\lambda_{1}$$$, and this means less smooth constraint on voxels near edges. When parameter $$$\lambda_{2}$$$ equals to zero, the proposed method reduces to MEDI. When $$$\lambda_{2}$$$ equals to $$$\lambda_{1}$$$, Eq. (1) is a conventional TV constrained QSM inversion without prior morphological information from magnitude images.
To evaluate the performance of the proposed method, the simulation and in vivo data sets from the online QSM repository [4] were reconstructed using the proposed method and MEDI. The associated reference standard images are also provided by the online QSM repository. The parameters used in MEDI were set to the optimal values suggested by previous work [5]. The parameters used in the proposed method were as follows: $$$\lambda_{1}=$$$0.003 and $$$\lambda_{2}=$$$0.00001 for numerical simulation data, and $$$\lambda_{1}=$$$0.003 and $$$\lambda_{2}=$$$ 0.0003 for in vivo data.
Results
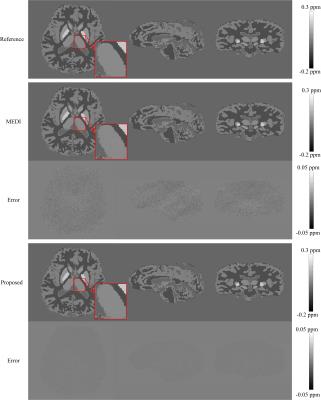
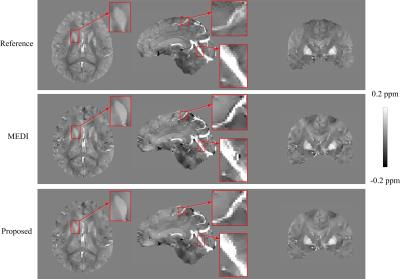
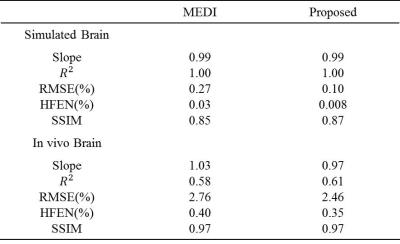
Figs. 1 and 2 exhibit the results of numerical simulation and in vivo data, respectively. Table 1 summarizes the quantitative measures of root mean square error (RMSE), structure similarity index (SSIM), high frequency error norm (HFEN), and the slope and determination coefficient ($$$R^{2}$$$) from the regression analysis. As shown by the simulation results in Fig. 1, the proposed method significantly outperforms MEDI in reducing quantification errors. From in vivo imaging results in Fig. 2, it can be observed that MEDI results contain obvious errors on voxels near edges. Compared with edges in the MEDI results, the edges in the susceptibility map generated by the proposed method are more similar to the edges in the reference maps. Table 1 shows that the proposed method results in reduced susceptibility quantification for RMSE and HFEN in both human brain and gadolinium phantom data sets.Discussion
We develop a novel morphology-adaptive TV regularization method for the reconstruction of quantitative susceptibility map from MR phase data. In the proposed method, regularization weights are adaptively determined according to local morphological information: smooth regions are reconstructed with strong regularization, and non-smooth regions near tissue boundaries are reconstructed with less regularization. Compared with MEDI, which does not impose any constraints on voxels near edges, the proposed method can achieve more accurate reconstruction of susceptibility maps, especially near tissue boundaries.Conclusion
Our results demonstrate that the reconstruction of susceptibility map using MEDI can be improved by introducing an additional TV constraint on edge voxels with a smaller regularization degree. More effective regularization models can be further investigated for the accurate reconstruction of the susceptibility near tissue boundaries.References
[1] Karin, Shmueli, et. al. MRM 2009; 62:1510-1522. [2] Tian, Liu, et. al. MRM 2011; 66(3):777-783. [3] Jing, Liu, et. al. NeuroImage 2012; 59(3):2560-2568. [4] Online QSM repository. http://weill.cornell.edu/mri/QSM/Online.zip. [5] Shuai, Wang, et. al. IEEE Trans Biomed Eng 2013; 60(12):3441-3448.Acknowledgements
No acknowledgement found.References
No reference found.Figures


