1417
Application of Iterative Reconstruction for MR Digital Subtraction Angiography: Toward Better Visualization of Small Vessels and Reduction of Gadolinium-Based Contrast Media.1Department of Diagnostic Imaging and Nuclear Medicine, Kyoto University Graduate School of Medicine, Kyoto, Japan, 2Human Brain Research Center, Kyoto University Graduate School of Medicine, Kyoto, Japan, 3Siemens Healthcare GmbH, Erlangen, Germany
Synopsis
Improved signal and temporal footprint for dynamic MRA due to the retrospective iterative reconstruction may better visualize small peripheral vessels with reduced GBCA dose. CE-MRA-TWIST images were reconstructed twice from the same raw data, with the standard product reconstruction and with iterative reconstruction (IT) by using L1 wavelet regularization in space and time. CE-MRA-IT-TWIST nicely visualized hemodynamics in the brain even with 20% GBCA dose administration compared with CE-MRA-TWIST, especially in the arterial phase. Enhancement slope of CE-MRA-IT-TWIST was statistically higher than that of CE-MRA-TWIST.
Purpose
Dynamic contrast-enhanced magnetic resonance angiography (dynamic CE-MRA) techniques are widely used in clinical practice, however, it still presents limitations regarding spatial and temporal resolution due to the limited acquisition speed. In addition, gadolinium injection dose should be decreased so as to reduce nephrotoxicity associated with gadolinium-based contrast agents (GBCA). An improved temporal footprint and denoising capability of the novel iterative reconstruction (IT) enables a better visualization of small peripheral vessels with reduced GBCA dose in cardiovascular imaging [1-3]. In this study, we compared highly accelerated dynamic CE MRA with standard and iterative reconstruction for a temporal footprint in neuroimaging.Materials and Methods
The local institutional review board approved this study.
Patients
Fourteen patients with brain tumors, huge cerebral aneurysms were included (4 male, 10 female, 45.5 ± 15.1 years).
MR imaging
Four-dimensional (4D) whole-brain CE-MRA with TWIST (CE-MRA-TWIST) was obtained on a 3T system (MAGNETOM Skyra, Siemens Healthcare, Erlangen, Germany) using a 32-channel head coil. 0.02 mmol/kg (20% dose) of GBCA with 20 ml saline was injected via cubital vein at the speed of 1ml/sec. Imaging parameters were as follows: TR, 2.74 ms; TE, 1.04 ms; FOV, 280 × 175 mm²; slice thickness, 0.80 mm (0.80 mm isotropic voxel); base resolution, 352; phase resolution, 70%; slice resolution, 50%; phase partial Fourier, 7/8; slice partial Fourier, 7/8; view sharing of TWIST with central region A of 14% and peripheral region B sampling density of 10%; slab-selective excitation; bandwidth, 710 Hz/Px; 208 slices per slab; 44 measurements; scan time, 1 minute. CE-MRA-TWIST images were first conventionally reconstructed directly after the scan. Afterwards, iterative reconstruction based on a prototype was retrospectively performed at the scanner, using a k-t regularization factor of 0.002 and 20 iterations. This retrospective reconstruction method features L1 wavelet regularization in space and time [4] as well as robustness to reduced phase FOVs similar to GRAPPA. Reconstruction time was about 35 min employing the graphic processing unit (GPU) of the scanner.
Visual evaluation
One neuroradiologist with 17 years of experience evaluated the visualization of petrous portion of ICA, proximal part of MCA (M1, horizontal segment), distal part of MCA (M3, opercular segment), cortical veins and sigmoid sinus between original CE-MRA-TWIST and CE-MRA-IT-TWIST reconstructions. The grading scores were as follows: grade 2 (well visualized), grade 1 (moderately visualized) and grade 0 (poorly visualized).
Quantitative evaluation
Circle ROIs were placed at bilateral ICA, M1, M3, cortical veins, and sigmoid sinus. Enhancement of each ROI was evaluated by quantitative method. Time intensity curve (TIC) of CE-MRA-TWIST and CE-MRA-IT-TWIST were created for all the patients. TIC was fitted by spline curve method by using Matlab 2014b (MathWorks, Natick, MA, United States). TIC was normalized so that the max value of each patient was set to 1000. The slope of enhancement in the early phase was calculated as follows: Slope = (80% of max value of TIC - 20% of max value of TIC)/Δt. Note that Δt corresponds to the time difference between time at 80% of max value of TIC and time at 20% of max value of TIC. Slopes of CE-MRA-TWIST and CE-MRA-IT-TWIST of each ROI were compared by paired T-test.
Results
Representative cases of CE-MRA with 20% GBCA dose are shown in Fig 1-3.
TICs of CE-MRA- TWIST and CE-MRA-IT-TWIST for all patients are shown in Fig 4. In order to achieve better recognition, time at 80% of max value of ICA, M1, M3, cortical vein and sigmoid sinus of each patient were integrated at 20, 22.5, 25, 30 and 35 sec, respectively.
Visual evaluation
Sum of grading scores of CE-MRA-TWIST and CE-MRA-IT-TWIST were as follows: ICA, 13 vs. 28 (P<0.001); M1, 8 vs. 28 (P<0.001); M3, 5 vs. 27 (P<0.001); cortical vein, 27 vs. 28 (P=0.34); sigmoid sinus, 27 vs. 28 (P=0.34).
Quantitative evaluation
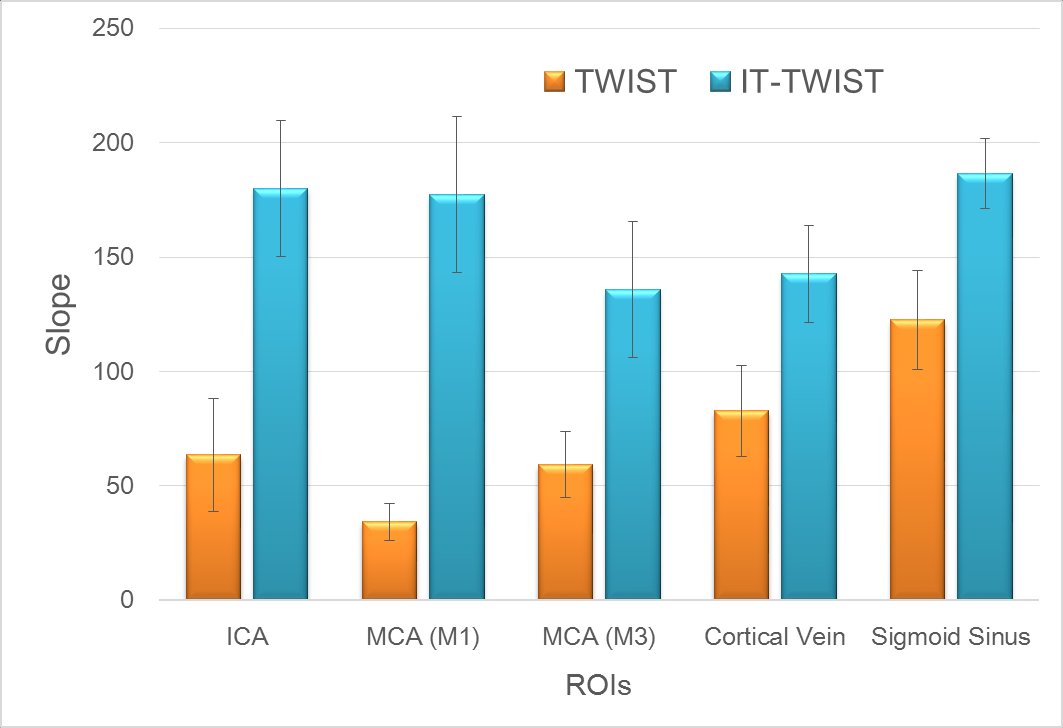
Slopes at each ROI of CE-MRA- TWIST and CE-MRA-IT-TWIST are shown in Fig 5. Slopes on CE-MRA-IT-TWIST were higher than those on CE-MRA-TWIST in all ROIs. P-values of ICA, M1, M3, and sigmoid sinus were <0.001, and P-value of cortical vein was 0.014.
Discussion
CE-MRA-IT-TWIST nicely visualized hemodynamics in the brain even with 20% GBCA dose administration, especially in the arterial phase (ICA, M1, and M3). Reduction of GBCA dose can be conducted for the evaluation of hemodynamics and for the inspection of venous thrombus with the IT-TWIST technique. GPU implementation for faster image reconstruction is achieved; however, reconstruction time needs to be further improved.Conclusion
CE-MRA-IT-TWIST showed statistically better visualization of brain vessel enhancement compared with CE-MRA-TWIST with 20% GBCA dose administration.Acknowledgements
This work was supported by Grant-in-Aid for Scientific Research on Innovative Areas “Initiative for High-Dimensional Data-Driven Science through Deepening of Sparse Modeling (No. 4503)” of The Ministry of Education, Culture, Sports, Science and Technology, Japan. We are grateful to Mr. Katsutoshi Murata and Mr. Yuta Urushibata, Siemens Healthcare K. K. for their help.References
1 Wetzl J, Forman C, Wintersperger BJ et al (2016) High-resolution dynamic CE-MRA of the thorax enabled by iterative TWIST reconstruction. Magn Reson Med. 10.1002/mrm.26146
2 Stalder AF, Schmidt M, Quick HH et al (2015) Highly undersampled contrast-enhanced MRA with iterative reconstruction: Integration in a clinical setting. Magn Reson Med 74:1652-1660
3 Rapacchi S, Natsuaki Y, Plotnik A et al (2015) Reducing view-sharing using compressed sensing in time-resolved contrast-enhanced magnetic resonance angiography. Magn Reson Med 74:474-481
4 Liu J, Rapin J, Chang T-c et al (2012) Dynamic cardiac MRI reconstruction with weighted redundant Haar waveletsProceedings of the 20th Annual Meeting of ISMRM, Melbourne, Australia,
Figures