1401
Validation of an ASL processing pipeline accounting for low SNR and the presence of an EPI artifact, using simulated and real data.1Academic Unit of Radiology, University of Sheffield, Sheffield, United Kingdom, 2Neuroimaging in Cardiovascular Disease (NICAD) Network, University of Sheffield, Sheffield, United Kingdom, 3Department of Psychology, University of Sheffield, Sheffield, United Kingdom, 4Danish Research Centre for Magnetic Resonance, Centre for Functional and Diagnostic Imaging and Research, Copenhagen University Hospital, Hvidovre, Denmark, 5Center for Magnetic Resonance, DTU Elektro, Technical University of Denmark, Lyngby, Denmark
Synopsis
This study aimed to optimize a processing pipeline for QUASAR ASL. We have focused on 3 aspects: the assignment of AIFs in voxels; dealing with voxels having excessive values potentially due to an EPI artifact; and minimization of partial volume effects. Simulations showed that GM CBF values closer to the ground truth are obtained by using AIFs in a distance double than the nearest-neighbor AIF to every voxel. In terms of an EPI artifact present in the analysis, we have shown that identification and exclusion of influenced voxels with a developed algorithm, results in values closer to the expected ones.
Background
Arterial Spin Labeling (ASL) MRI is a non-invasive imaging technique for perfusion quantification. QUAntitative STAR labeling of Arterial Regions (QUASAR) ASL samples the saturation recovery curve at multiple time-points allowing for quantification of cerebral blood flow (CBF) and arterial blood volume (aBV) and for the determination of local arterial input functions (AIFs) [1]. AIFs are usually calculated in voxels with aBV>1.2% and assigned to every voxel by means of its closest neighbor. Due to the use of a single-shot Look-Locker EPI readout the technique has relatively low SNR and is susceptible to EPI artifacts including a water-fat shift artifact. If there is gross anatomical movement during the acquisition, misalignment of the latter artifact between the control and labeled acquisitions can result in erroneous values in the CBF image. QUASAR ASL is also subject to partial volume effects due to the size of QUASAR voxels (typically 3.75*3.75* 7mm3).Purpose
To develop and evaluate using a combination of real and simulated data a processing approach for QUASAR ASL targeted to:
a) reduce the effect of low SNR and presence of chemical shift artifacts and
b) reduce the effects of the partial volume phenomenon.
Methods
The crushed (ΔMcr) and non-crushed (ΔMncr) ASL signals were simulated based on the following equations:
ΔΜcr=2*CBF*M0a*AIF(t)⊗ R(t)
ΔΜncr=ΔΜcr*(PVGM+PVWM)+2*M0a*AIF(t)*aBV
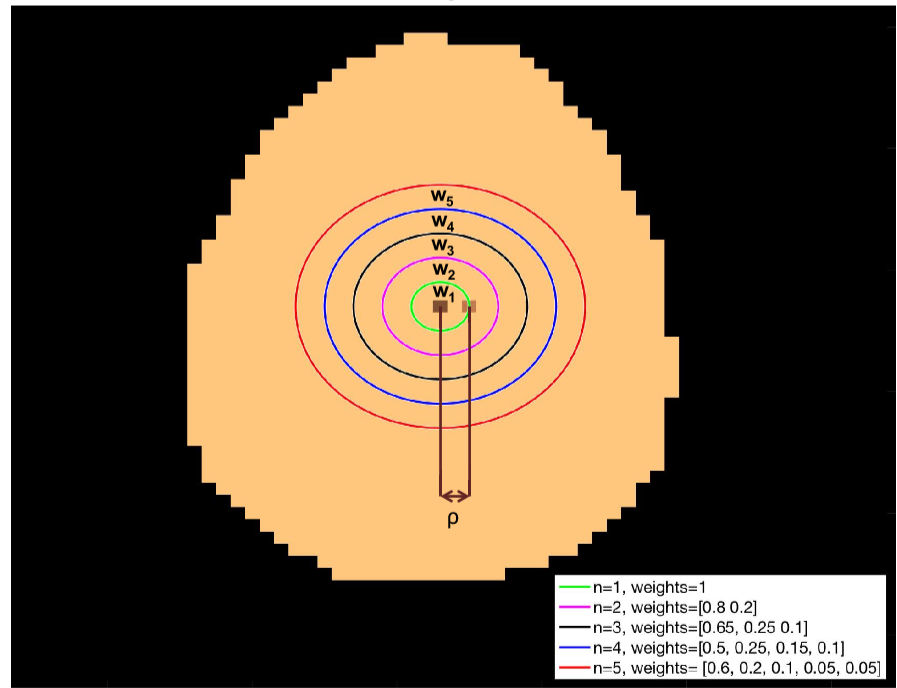
Where the AIF(t) and the residue function were simulated as described in [2] and CBFGM=60ml/100g/min, CBFWM=20ml/100g/min. M0a, aBV and partial volume (PV) maps for grey matter(GM) and white matter (WM) were extracted from a subject in order for the data to be more realistic. A random number in the interval [0.2-0.4s] was added to the crushed signal, to reflect the delay from the arterial input to the tissue. AIFs were assigned to every voxel using a distance-based weighted average of local AIFs. The closest local AIF to every voxel was determined and its distance was used as a reference (ρ). We evaluated the impact of using a weighted average of local AIFs by assigning weights in AIFs situated within a n*ρ distance from every voxel in various n (Fig.1). For each combination 5 repetitions were run. The metrics used to evaluate the performance for the chosen values were the mean errors in: GM CBF, WM CBF, voxel-wise total CBF, voxel-wise GM CBF for GM>50% and GM>80%.
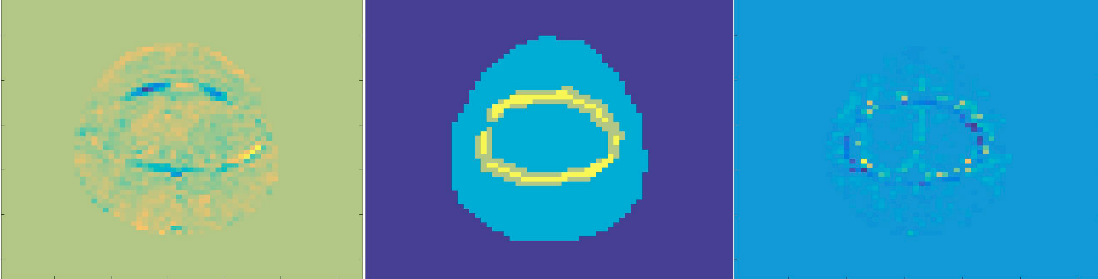
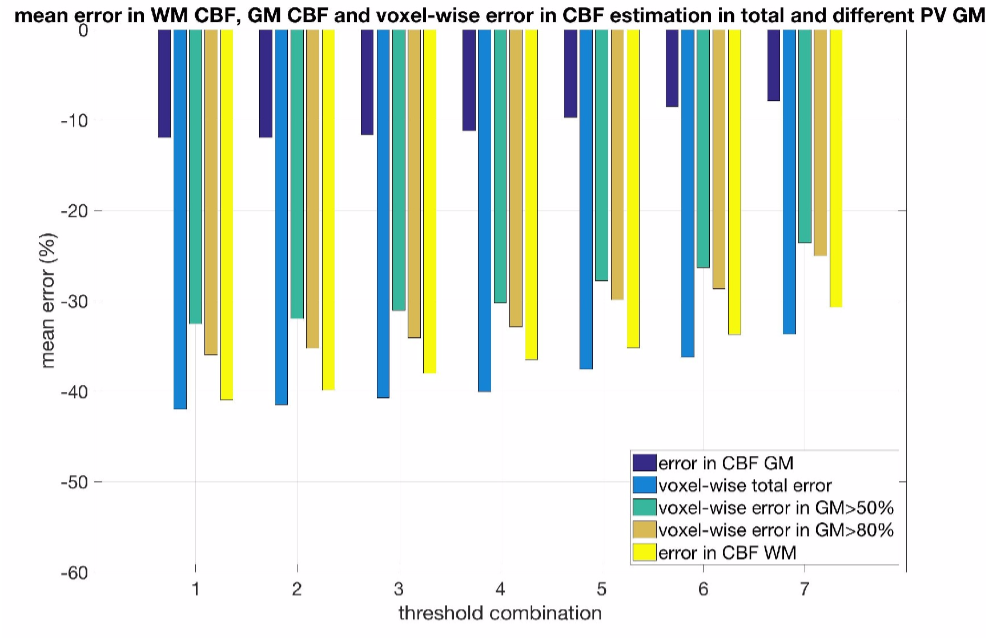
In order to account for an EPI artifact present in the analysis, an algorithm detecting edges based on a user-defined threshold and excluding voxels influenced by the artifact in the ΔΜncr-ΔΜcr image was developed. A bright “ring” was added in the crushed and non-crushed experiments slightly misaligned to simulate the artifact (Fig.2). 7 threshold combinations (slightly higher thresholds were used for the lower slices) were evaluated in our simulations, n=2 was used. The same metrics as before were used to assess the performance for every value. For PV correction we used the method developed by Asllani et al [3]. PV maps were generated using spatial fuzzy c-means (SCFM) clustering [4] of a high resolution MPRAGE image of a subject. The PV maps were down-sampled and registered to the QUASAR images.
Results
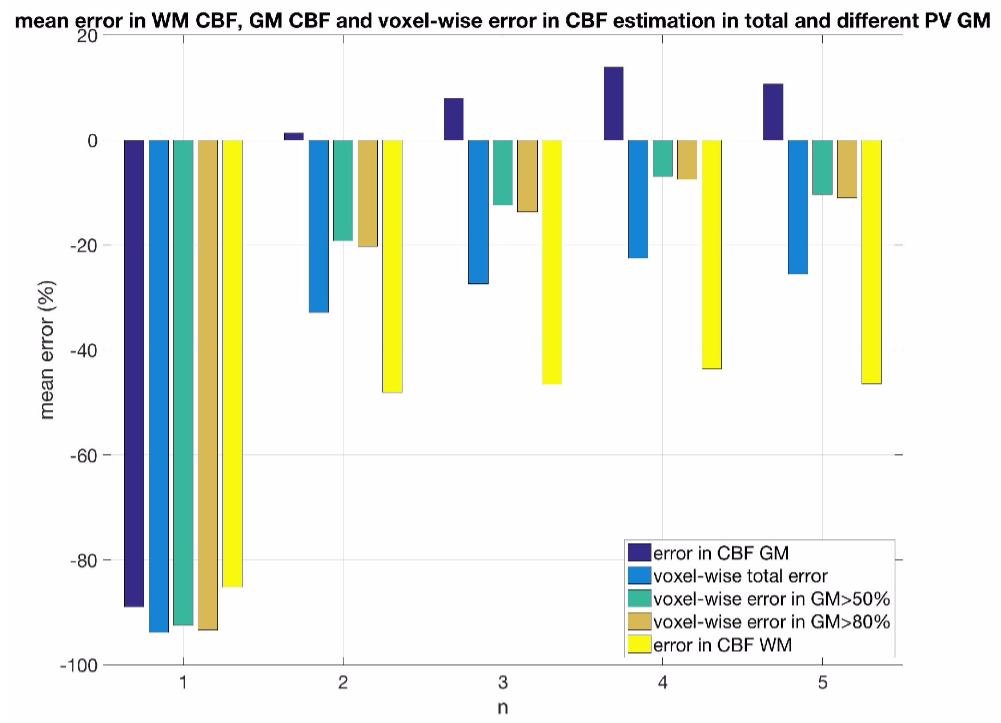
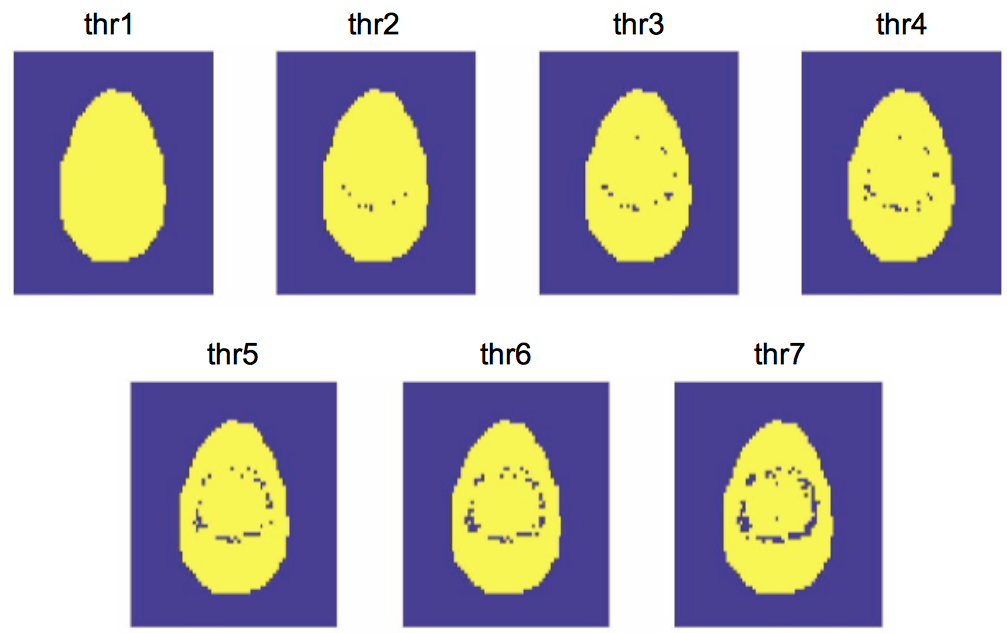
Results for the simulations evaluating the number of local AIFs assigned in every voxel can be found in Fig.3. For the mean GM CBF value the best performance was when n=2 was used with a mean overestimation of 1.32%. When n=1 was considered all values were greatly underestimated. With n=4 there was a smaller voxel-wise error but a greater overestimation of GM CBF. In terms of the correction of the misaligned artifact, the mean number of excluded voxels from the analysis for every evaluated threshold wass from the highest to the lowest: threshold1: 0, threshold2: 46.4, threshold3: 112.2, threshold4:158.4, threshold5: 302.4, threshold6: 385.4, threshold7: 657.6 (Fig.4). In fig.5 results for every evaluated metric for the different threshold combinations can be found. As the threshold decreases, more voxels are excluded from the analysis and the evaluated metrics have values closer to the expected ones.Discussion and Conclusions
The simulations have shown that the developed processing pipeline works well for relatively low SNR. The results suggest that this technique is adept for GM CBF estimation with a tendency to overestimate it. Using n=2 results in a lower error for GM CBF value, whereas n=4 results in a lower voxel-wise error. When a typical artifact is present at the image , a technique to exclude influenced voxels prior to the analysis results in values closer to the in vivo derived estimates.Acknowledgements
No acknowledgement found.References
1. Petersen, E.T., T. Lim, and X. Golay, Model-free arterial spin labeling quantification approach for perfusion MRI. Magnetic Resonance in Medicine, 2006. 55(2): p. 219-232.
2. Chappell, M.A., et al., Comparing Model-Based and Model-Free Analysis Methods for QUASAR Arterial Spin Labeling Perfusion Quantification. Magnetic Resonance in Medicine, 2013. 69(5): p. 1466-1475.
3. Asllani, I., A. Borogovac, and T.R. Brown, Regression algorithm correcting for partial volume effects in arterial spin labeling MRI. Magn Reson Med, 2008. 60(6): p. 1362-71.
4. Chuang, K.S., et al., Fuzzy c-means clustering with spatial information for image segmentation. Comput Med Imaging Graph, 2006. 30(1): p. 9-15.
Figures