1400
Partial Volume Correction and Transit Time correction effect in absolute perfusion quantification with 3D Pseudo-Continuous Arterial Spin Labelling.1Radiology and Nuclear Medicine, Erasmus MC, Rotterdam, Netherlands, 2Rey Juan Carlos University, 3A Coruña University, 4GE Healthcare
Synopsis
This work studies partial volume correction and transit time correction in CBF assessment with 3DPCASL sequence. It is shown how important are these corrections depending on brain regions and the amount of gray matter inside the voxel.
Introduction.
CBF quantification using 3D-ASL is sensitive to flow velocity and transit time but also to partial volume effects [1]. Partial volume effects are caused by a voxel-wise mixture of tissues with intrinsic different perfusion regimes. Global measurements can hide this effects but regional measurements can be affected dramatically. In this work, we have studied the different CBF values depending on the amount of gray matter inside the voxel after gray matter segmentation. We have studied how these values can change after partial volume correction (PVC) and Transit Time correction (TTC). We use the same 3D-PCASL sequence with 2 different parametrizations for comparison purposes: long labeling and multi-delay. A multi-delay , to obtain transit time measurements and a long labelling to guarantee tagging efficiency.Material & Methods.
Participants
Twelve young and healthy subjects (9 females and 3 males, mean age 26 ± 8) participated in this study. Participants provided informed consent for the MRI experiment according to the Declaration of Helsinki.
Data acquisition
MRI data were collected in a GE Discovery MR750 3T (GE Healthcare, Waukesha, WI, USA) using an eight-channel head coil receive array (GE Coils, Cleveland, OH) and the body coil for transmission. Subjects were instructed to close their eyes to avoid an increase in perfusion in the occipital area and their heads were padded with several cushions to reduce movement and to keep head and neck relaxed while they were scanned. ASL images were acquired with full brain coverage. The inferior slice of the image volume was placed in the lower portion of the cerebellum, and the labeling plane was approximately 2 cm below the imaging slab. A pulsed-continuous arterial spin labeling (PCASL) sequence was used in this study. It consisted of an interleaved 3D RARE stack of spirals readout [2], using two different schemes:
3D pCASL long labeling (TR / TE / reconstruction voxel dimensions / labeling time / post labeling delay / arms / points per arm / NEX : 5.681s / 10.536ms / 1.875x1.875x4mm / 3500ms / 2000ms / 8 / 512 / 1)
3D pCASL with 7 exponentially increasing PLDs (from now on, 7 delays) using a Hadamard encoding scheme (Dai et al., 2014): (TR / TE / reconstruction voxel dimensions / labeling time / post labeling delay / arms / points per arm / NEX : 6.027s / 11.56ms / 1.875x1.875x4mm / 220ms-260ms-300ms-370ms-480ms-680ms-1180ms / 1000ms-1220ms-1480ms-1780ms-2150ms-2630ms-3320ms / 4 / 640 / 1)
Anatomical 3D T1 weighted images were acquired with a full brain spoiled gradient echo 3D T1-weighted (3DT1w) volumetric scan with a TR=8.2ms, TE=3.22ms, TI=450ms, NEX=1, acquisition matrix=256x256, resolution=0.93x0.93x1.5mm, flip angle=12. These images were used for registration and for segmentation purposes needed to apply the PVC.
Results.
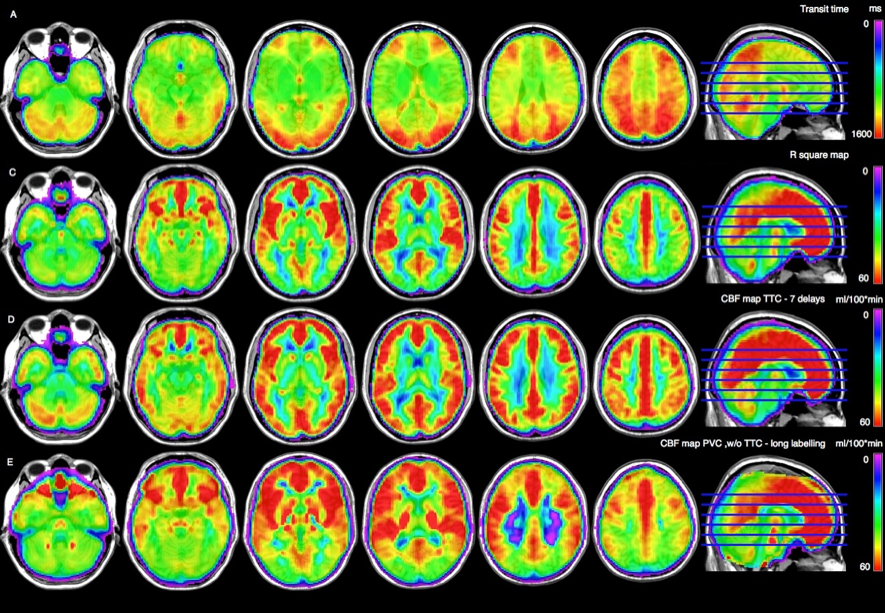
Figure 1 shows transit time map (first row), long labelling acquisition without any correction (second row), multi-delay CBF map with transit time correction (third row) and long labeling with PVC (4th row).
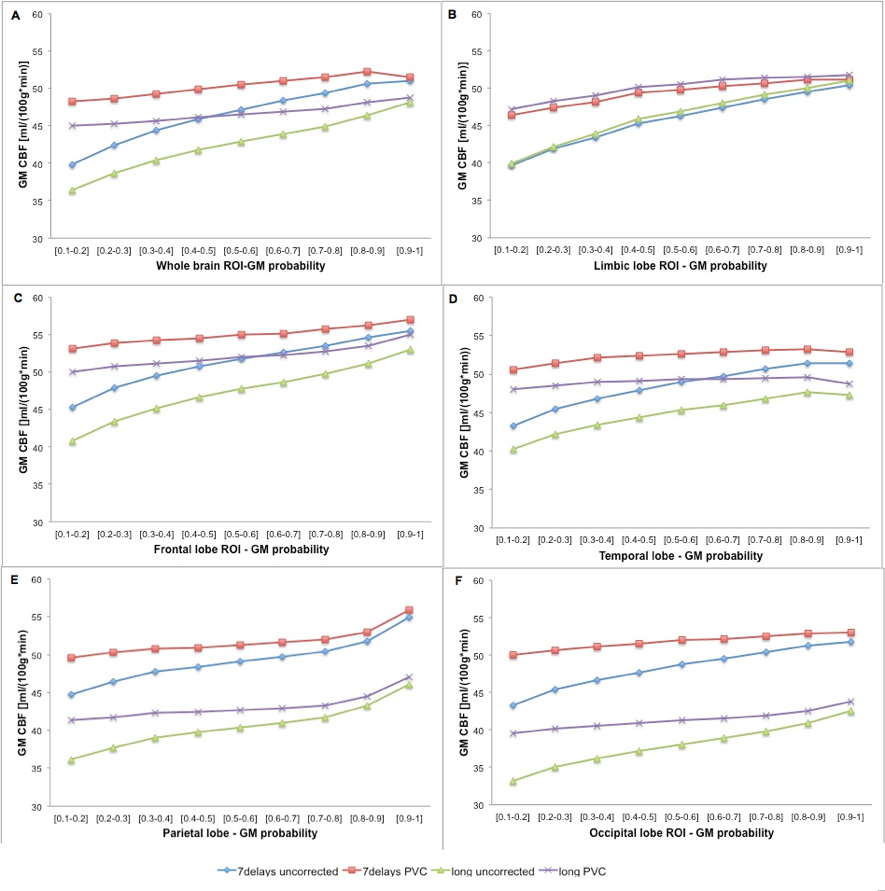
Figure 2 All graphs are showing CBF (Vertical Axis) vs amount of gray matter in the voxel. Curves in every graph are describing the effect of PVC and TTC. From A to F, global and regional CBF measurements are shown.
Discussion.
Transit Time maps in figure 1 show how different is the transit time depending on the region. Posterior, parietal and upper regions show longer transit time than medial and lower regions. No TTC in long labeling (figure 1, 2nd row) causes an underestimation in CBF in those regions with longer transit time. PVC in long labelling causes regional blurring in perfusion maps.
Looking at figure 2, it is clear how perfusion values depend on the amount of gray matter. In general, multi-delay sequence with TTC and PVC shows highest CBF values closer to normal CBF values as referred in the literature, in particular for 100% gray mater voxels. PVC improves CBF values in the long labelling but not in posterior and parietal regions because perfusion is underestimated due to uncorrected longer transit time. In regions not affected by longer TT, PVC is providing more uniforms values for every voxel without regards to the amount of gray matter (flatter curves).
Conclusions
TTC is a mandatorycorrection, in particular for those regions with longer TT. PVC is a mandatory correction to reach nominal values as described in the literature. The combination of TTC and PVC facilitates the normalization of CBF values in all brain regions.Acknowledgements
No acknowledgement found.References
[1] Chappell, M. A., et al. "Partial volume correction of multiple inversion time arterial spin labeling MRI data." Magnetic Resonance in Medicine 65.4 (2011): 1173-1183.
[2] Dai W, Garcia D, de Bazelaire C, Alsop DC. Continuous flow-driven inversion for arterial spin labeling using pulsed radio frequency and gradient fields. Magn Reson Med. 2008; 60:1488–1497. [PubMed: 19025913]
Figures