1399
Single-Scan GRE Myelin Water Imaging with Macroscopic Field Inhomogeneity Compensation1Department of Electrical and Computer Engineering, Seoul National University, Seoul, Korea, Republic of, 2Department of Radiology, Seoul St. Mary's Hospital, College of Medicine, The Catholic University of Korea, Seoul, Korea, Republic of
Synopsis
In this study, we propose a single-scan GRE-MWI method that corrects for the effects of macroscopic field inhomogeneity using a modified z-shimming. In addition, a new three-component magnitude model corresponding to the modified sequence is proposed. Compared to the conventional method, the results showed an improved MWF estimation, particularly in frontal lobe regions.
Purpose
Myelin water imaging (MWI) has potentials as a diagnostic tool for demyelinating diseases. In recent studies, approaches that utilize multi-echo gradient echo (GRE) data have been suggested for MWI.1,2 Since the GRE sequence is known to be vulnerable to macroscopic field inhomogeneity, MWF estimation in the frontal and temporal lobes of inferior slices is challenging. Several techniques have been proposed to resolve this problem.3-6 Among them, z-shimming is a particularly effective method because of an additional gradient that compensates for the field inhomogeneity, allowing detection of signals at a long TE.5,6 In this study, we propose a single-scan z-shim method which successfully compensates for the macroscopic field inhomogeneity artifacts in GRE-MWI.Methods
Single-scan z-shim sequence:
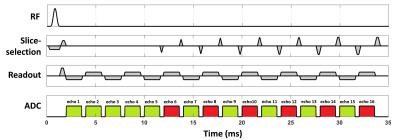
To acquire signal decay curve for GRE-MWI with z-shim, a conventional 2D multi-slice GRE sequence was modified as shown in Fig. 1. Since myelin water signal has a short T2* (<10 ms) and is mostly lost after 10 ms, z-shim blips were applied after 10 ms of TE to reserve most of the myelin water signal. Since the effects of the macroscopic susceptibility induced field gradient increase linearly with time, both compensation gradients and rewinding gradients were also increased with time.
MWF fitting and post processing:
The three-pool magnitude model suggested by previous studies was given by 1-2,7:
$$S_{uncorr}(t)=A_{my}e^{-t/T_{2,my}^*}+A_{ax}e^{-t/T_{2,ax}^*}+A_{ex}e^{-t/T_{2,ex}^*}\:\:\:\:\:\:\:\:\:\:\:\:\:\:\:[Eq.\:1]$$
where $$$A_{my}$$$, $$$A_{ax}$$$, and $$$A_{ex}$$$ represent the amplitude of the myelin (my), axonal (ax) and extracellular (ex) water pools respectively, and $$$T_{2,my}^*$$$, $$$T_{2,ax}^*$$$ , and $$$T_{2,ex}^*$$$ represent T2* of the three water pools. Additional signal decay that originates from the macroscopic field inhomogeneity was modeled by M(∙), which assumed linear spin dephasing in slice-select direction and included a non-ideal excitation profile. Then the signal decay is modeled as follows:
$$S_{corr}(t)=S_{uncorr}(t)\cdot M(G_{z,susc}t)\:\:\:\:\:\:\:\:\:\:\:\:\:\:\:[Eq.\:2]$$
where Gz,susc represents susceptibility induced field gradient in slice-select direction. When this model is applied to the modified z-shimming sequence, one can generate the following equations.
$$S_{proposed}(t)=\begin{cases}S_{uncorr}(t)\cdot M(G_{z,susc}t) & (for\:not\:z-shimmed\:echoes)\\S_{uncorr}(t)\cdot M( (G_{z,susc}-G_c)t) & (for\:z-shimmed\:echoes)\end{cases}\:\:\:\:\:\:\:\:\:\:\:\:\:\:\:[Eq.\:3]$$
where Gc represents the amplitude of compensation gradient. When estimating the model parameters, the signals were first fitted to a one-component model, then the resulting parameters were used to determine initial values for a two-component model. The results were used for initial values for the three-component model.8
Data acquisition and processing:
Three healthy volunteers (mean age 24 ± 1)
were scanned at 3T. GRE: The conventional GRE and the z-shim sequence were
acquired with following parameters: 1 ms Hanning windowed sinc RF pulse, TR = 1 s, TE(n) = 2 + (n-1)∙2
ms, number of echoes = 16, flip angle = 68°,
in-plane resolution = 1.4 × 1.4
mm2, slice thickness = 4 mm, inter-slice gap = 4 mm, matrix size =
160 × 160,
number of slices = 12, bandwidth = 640 Hz/px, average = 2, scan time = 6 min. The
conventional GRE dataset was processed for 1)
uncorrected GRE-MWI using Eq. 1 and 2)
post-processing only GRE-MWI using Eq. 2. The z-shim sequence was processed using
Eq. 3. ViSTa-MWI: To observe myelin distribution, ViSTa-MWI, 9
which is known to be robust to the field inhomogeneity, was acquired for the same
FOV and resolution.
Results
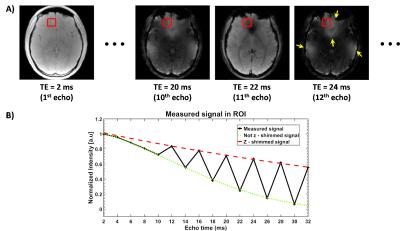
Fig. 2 shows the magnitude images from the z-shim sequence and a signal decay curve measured in ROI (red box). The magnitude images (Fig. 2A) and the measured signal (Fig. 2B) demonstrate that the signal loss from macroscopic field inhomogeneity was recovered by the compensation gradients. When the data were fitted to the proposed model, the resulting MWF reveals noticeable recovery in the frontal lobe (Fig. 3C) as compared to the uncorrected (Fig. 3A) or the post-processing only results (Fig. 3B), showing great similarity with ViSTa-MWI (Fig. 3D).Conclusion and Discussion
In this work, we demonstrated that the proposed single-scan z-shim method allows measuring MWF in the areas of the large macroscopic field inhomogeneity. Compared to the conventional methods, the new method provides a more reliable estimation of MWF, particularly in the frontal lobe regions. The proposed sequence does not require additional scan time. In acquiring whole brain data, one may utilize the proposed approach only for inferior slices where the field inhomogeneity is dominant to preserve data acquisition efficiency in other slices.Acknowledgements
No acknowledgement found.References
1. Du, Y.P., et al. Fast multislice mapping of the myelin water fraction using multicompartment analysis of T2* decay at 3T: A preliminary postmortem study. Magn. Reson. Med. 2007;58(5):865-870.
2. Hwang, D., et al. In vivo multi-slice mapping of myelin water content using T2 * decay. Neuroimage. 2010;52(1):198-204.
3. Fernandez-Seara, M.A., et al. Postprocessing technique to correct for background gradients in image-based R2* measurements. Magn. Reson. Med. 2000;44(3):358-366.
4. Alonso-Ortiz, E., et al. Field inhomogeneity correction for gradient echo myelin water fraction imaging. Magn. Reson. Med. 2016.
5. Truong, T.K., et al. Blipped multi gradient-echo slice excitation profile imaging (bmGESEPI) for fast T2* measurements with macroscopic B0 inhomogeneity compensation. Magn. Reson. Med. 2006;55(6):1390-1395.
6. Yang, Q.X., et al. Removal of local field gradient artifacts in T2*-weighted images at high fields by gradient-echo slice excitation profile imaging. Magn. Reson. Med. 1998;39(3):402-409.
7. Lancaster, J.L., et al. Three-pool model of white matter. J. Magn. Reson. Imaging. 2003;17(1):1-10.
8. Sati, P., et al. Micro-compartment specific T2* relaxation in the brain. Neuroimage. 2013;77:268-278.
9. Oh, S.-H., et al. Direct visualization of short transverse relaxation time component (ViSTa). Neuroimage. 2013;83:485-492.
Figures


