1396
Improving Apparent Diffusion Coefficient Accuracy on a Compact 3T MRI Scanner using Gradient Non-linearity Correction1Radiology, Mayo Clinic, Rochester, MN, United States, 2GE Global Research, Niskayuna, NY, United States
Synopsis
Errors are introduced into apparent diffusion coefficient quantification of diffusion weighted imaging (DWI) due to imperfect gradient linearity. A post-processing gradient non-linearity (GNL) correction algorithm can alleviate this problem on a conventional whole-body MR scanner equipped with a symmetrical gradient system. A compact 3T (C3T) scanner with a high-performance gradient was recently developed and exhibits more complex GNL than conventional whole-body gradients due to its asymmetric design. Here, we test the robustness of this GNL correction on the C3T using phantom and in-vivo experiments, and demonstrated improved accuracy of quantitative maps for DWI on the C3T using this algorithm.
Introduction
Apparent diffusion coefficient (ADC) quantification of diffusion weighted imaging (DWI) is used clinically in the assessment of neurological disorders, stroke and monitoring cancer therapy response. ADC estimation is typically performed assuming that linear spatial encoding and diffusion-weighting gradients are utilized, and diffusion sensitivity (i.e., b-value) is spatially uniform. However, all MR scanners exhibit some degree of gradient nonlinearity (GNL) due to various engineering limitations1 which in turn affects ADC accuracy. Phantom and in vivo studies have shown that GNL correction decreased ADC error in breast DWI2,3. Recently, a high-performance, compact 3T (C3T) scanner was developed and exhibits both odd- and even-order GNL spatial dependence due to its asymmetric gradient system4-6. The GNL of this system can be accurately characterized using up to 10th-order spherical harmonic polynomials (including both even and odd-order terms)7. Using higher-order coefficients as the a priori information, the GNL correction was tested on the C3T scanner to investigate whether the accuracy/precision of the quantitative maps extracted from DWI can be improved.Methods
DWI was performed with a spherical phantom8 on three scanners with an 8-channel head coil (Invivo, Gainsville FL) for cross-platform comparison. The three 3T scanners were a C3T scanner, a GE Signa Excite whole-body scanner and a GE Discovery MR750 whole-body scanner (GE, Milwaukee, WI). The phantom temperature was equilibrated to ambient temperature in each scanner room overnight before the experiment and the final temperatures were recorded. Images were acquired with a clinically used axial DWI imaging protocol with a single-shot spin-echo echo planar imaging sequence. Image parameters were: b-value=1000s/mm2, TR=10000ms, slice thickness=4mm/0mm, FOV=30cmx30cm, imaging matrix=128x128. Parallel imaging was not used to avoid spatially-varying noise amplification. The acquisitions on the C3T employed real-time gradient pre-emphasis9 and frequency shifting to compensate for additional concomitant field terms due to the asymmetric design.
ADC maps were generated from images with and without GNL correction using vendor provided software. Five circular regions of interest (ROIs) (diameter=2.3cm) were positioned in the central 12 slices as illustrated in Figure 1, avoiding regions with susceptibility artifacts or Gibbs ringing. The mean and standard deviation (STD) for the ADC in each ROI was measured.
Under an IRB approved protocol, a healthy volunteer was scanned with a routine diffusion tensor imaging (DTI) protocol using an 8-channel receive coil. The imaging parameters were: FOV=232x232mm, slice thickness=2.7mm, imaging matrix=116x116, ASSET (i.e., SENSE) factor=2, 41 gradient directions and b-value=1000s/mm2. Fractional anisotropy (FA) and mean diffusivity (MD) maps were generated from both the standard DTI, and the GNL corrected DTI data.
Results
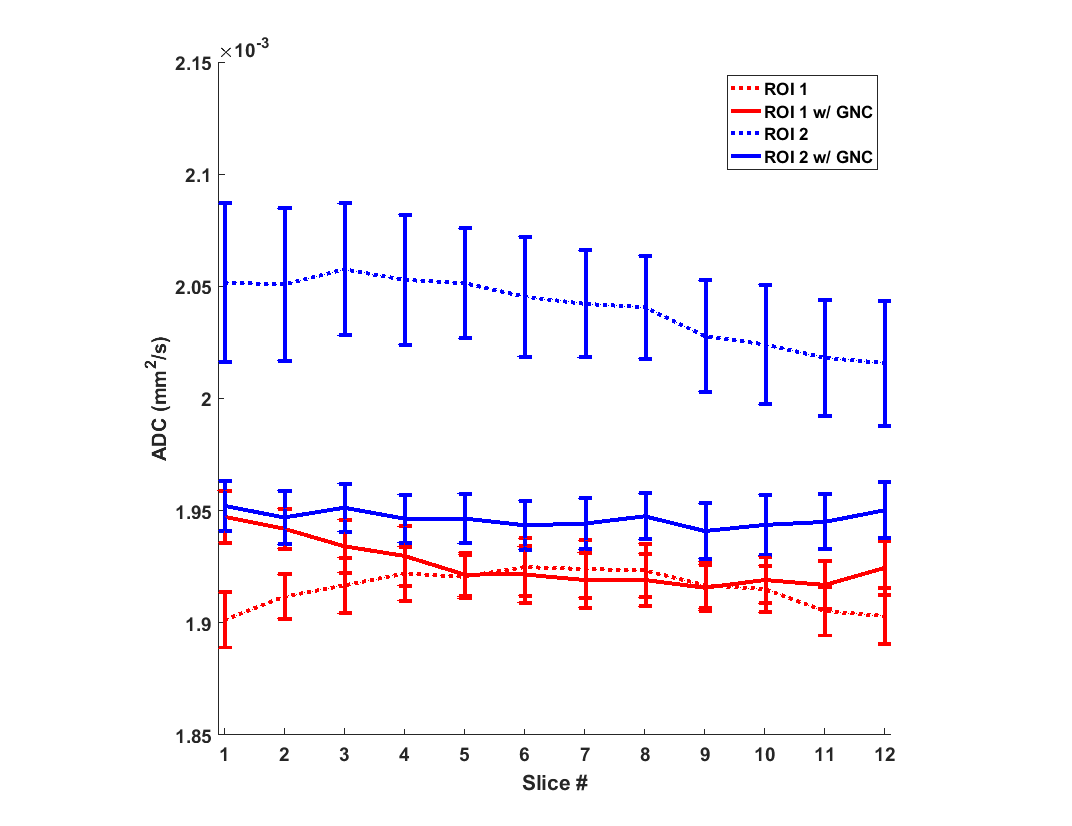
Figure 2 shows the mean ADC values and the STD for each ROI (averaged over the slices) before and after GNL correction for all three scanners. For all scanners, the uncorrected ADC values tended to be higher in ROIs further away from iso-center. The overall coefficients of variation for all ROIs in the ADC maps reduced from 3.2% pre-GNL correction to 1.6% post-correction. Figure 3 shows the ADC values for the ROI 1 and ROI 2 over all slices on the C3T scanner. The mean values for ROI 2 were consistently higher compared to ROI 1 for each slice. The difference of the mean values between ROI 1 and 2 prior to GNL correction ranged from 5.3% -7.9%. However, after GNL correction the range reduced to 0.3%-1.5%. The temperature of the phantom used for the Signa HD 3T, Discovery 750 and compact 3T were 19°C, 20°C and 21°C respectively. The ADC dependence on temperature can be appreciated10.
The sagittal MD and FA maps extracted from the DTI brain scan were shown in Figure 4. The ADC values for the cerebral spinal fluids are more uniform across the sagittal plane after the correction. The differences between the FA maps are less apparent, but overall are higher in magnitude for regions away from the iso-center as the difference ratio in Figure 4 indicates.
Discussion and Conclusion
Due to asymmetry of the physical x and y gradient coils of the C3T scanner, a one-sided bias was observed for all non-central ROIs. In contrast, a more symmetric pattern was observed on the two whole-body scanners. Overall, the improvement in the accuracy of the ADC values in all ROIs for post-processed data demonstrates the GNL correction algorithm to be robust on the C3T scanners. The reproducibility was validated when the phantom data was compared with symmetric gradient systems. The in vivo DTI scan also corroborated that the GNL correction algorithm improved the accuracy of the structural maps.Acknowledgements
Funding Support: NIH R01EB010065References
1. Glover GH, Pelc NJ, inventors; General Electric Company, assignee. Method for correcting image distortion due to gradient nonuniformity. US Patent 4,591,789. May 27, 1986.
2. Tan E T, Marinelli L, Slavens Z S, et al. Improved Correction for Gradient Nonlinearity Effects in Diffusion-Weighted Imaging. J. Magn. Reson. Imaging. 2013;38(2):448-453.
3. Newitt D C, Tan E T, Wilmes L J, et al. Gradient Nonlinearity Correction to Improve Apparent Diffusion Coefficient Accuracy and Standardization in the American College of Radiology Imaging Network 6698 Breast Cancer Trial. J. Magn. Reson. Imaging. 2015;42(4):908-919.
4. Weavers PT, Shu Y, Tao S, Huston J 3rd, Lee SK, Graziani D, Mathieu JB, Trzasko JD, Foo TK, Bernstein MA. Compact three-tesla magnetic resonance imager with high-performance gradients passes ACR image quality and acoustic noise tests. Med. Phys. 2016 Mar;43(3):1259. doi: 10.1118/1.4941362.
5. Foo T, Tan ET, Schenck J, Graziani D, Laskaris ET, Vermilyea M, Sabourin C, Shu Y, Huston J, Bernstein MA. Novel High Performance, Compact 3.0T MRI System for Imaging the Brain. Military Health System Research Symposium (MHSRS), Orlando, FLA August 2016.
6. Lee SK, Mathieu JB, Graziani D, Piel J, Budesheim E, Fiveland E, Hardy CJ, Tan ET, Amm B, Foo TK, Bernstein MA, Huston J 3rd, Shu Y, Schenck JF. Peripheral nerve stimulation characteristics of an asymmetric head-only gradient coil compatible with a high-channel-count receiver array. Magn. Reson. Med. 2015 Dec 2. doi: 10.1002/mrm.26044.5.
7. Tao S, Trzasko JD, Shu Y, Weavers PT, Gunter J, Huston J, Lee SK, Tan ET, Bernstein MA. Gradient nonlinearity calibration and correction for full-volume imaging of a compact asymmetric MRI gradient system. Med. Phys. 2016;43(6):3725.
8. Binesh, N., Yue, K., Fairbanks, L. and Thomas, M. A. (2002), Reproducibility of localized 2D correlated MR spectroscopy. Magn. Reson. Med., 48: 942–948.
9. Tao S, Weavers PT, Trzasko JD, Shu Y, Huston J, Lee SK, Frigo LM, Bernstein MA. Gradient pre-emphasis to counteract first-order concomitant fields on asymmetric MRI gradient systems. Magn. Reson. Med. 2016;DOI: 10.1002/mrm.26315.
10. Tofts PS, Lloyd D, Clark CA, Barker GJ, Parker GJ, McConville P, Baldock C, Pope JM, Test liquids for quantitative MRI measurements of self-diffusion coefficient in vivo. Magn. Reson. Med. 2000 Mar; 43(3):368-74.
Figures