1395
Correct Shaking Artifact in Diffusion Spectrum Imaging Using Estimated Maximum Likelihood1Graduate Institute of Brain and Mind Sciences, National Taiwan University College of Medicine, Taipei, Taiwan, 2Institute of Medical Device and Image, National Taiwan University College of Medicine, Taipei, Taiwan, 3Molecular Imaging Center, National Taiwan University College of Medicine, Taipei, Taiwan
Synopsis
Unexpected phase errors occurred in the k-space of the diffusion spectrum EPI sequence would lead to abrupt shifts in the phase-encoding direction across different diffusion gradient directions which cause shaking artifact of the image. The shaking artifact can lead to errors in image registration and diffusion index calculation. Here, we developed an estimated maximum likelihood method to detect and correct image shifts. After correcting the shaking artifact, the performance of registration and the diffusion index calculation were significantly improved comparing to the images without correction.
Introduction
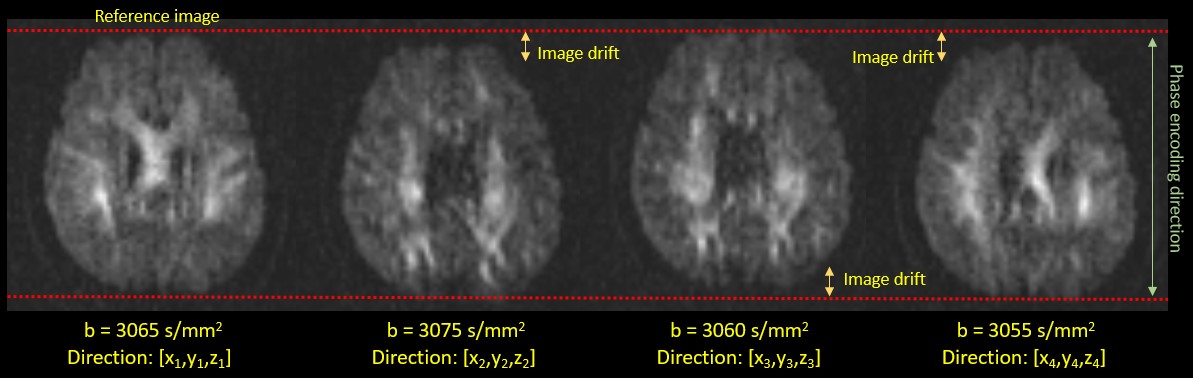
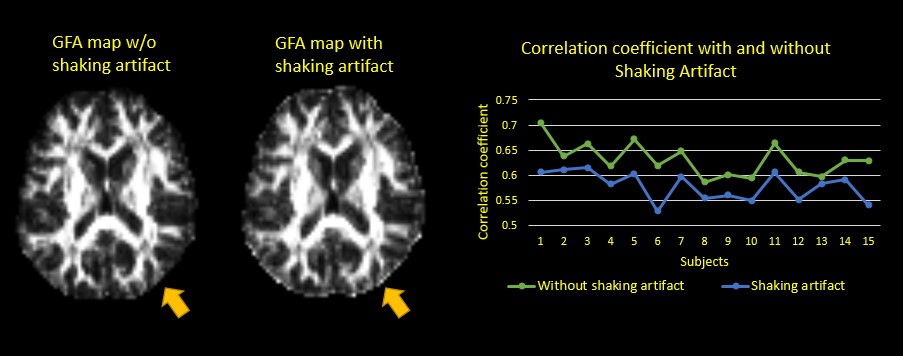
Diffusion spectrum imaging (DSI) is one of advanced diffusion sampling techniques that allows more accurate estimation of axonal trajectories by sampling the q-space signals with multiple diffusion sensitivities and directions.1 Typically, DSI acquires diffusion-weighted images with the maximal b values (bmax) up to 4000 s/mm^2 or above, and so it requires a stable hardware and software environment. Occasionally, the reconstruction of diffusion-weighted images shows unpredictable image shifts (approximately 1~2 pixels) along the phase-encoding direction across different directions of diffusion gradients (Figure 1). When viewing these images sequentially, it appears like shaking motion of the head, namely shaking artifact (SA). SA causes errors in image registration and diffusion index calculation (Figure 2). To overcome SA, we developed an estimated maximum likelihood method to measure the amount of image shift and corrected the artifact by re-centering the images using the estimated image shifts.2 The experiment of detecting and correcting SA was conducted in both simulation and in-vivo studies.Method
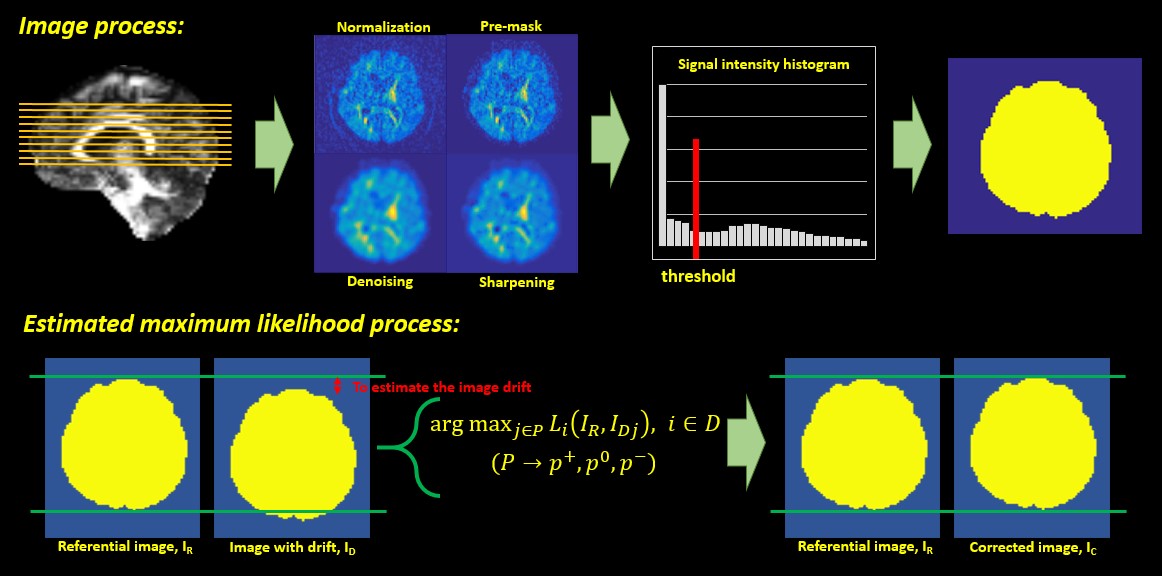
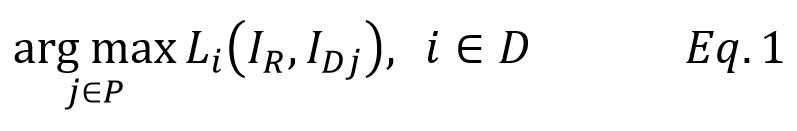
Algorithm: The estimated maximum likelihood method was implemented on Matlab (version 8.5). To create the binary mask of images for maximum likelihood function, the DSI datasets went through a series of image processes including normalization, pre-masking, denoising and sharpening. We then utilized first order differential on the image intensity function to find the local minimum. That was used as the threshold to binarize the processed images into the binary mask (Figure 3). The masks corresponding to the low b values were set as the reference images, IR. The masks corresponding to the high b values (ID) were used to estimate the image shifts. The ID adjusted by the probable image shifts was compared to the IR. Once the likelihood function (Eq. 1) was maximized by the ID with a certain probable image shift, this estimated shift was used to reconstruct ID into the corrected images IC. Iterative approach was used to optimize the correction. Simulation study: 30 image datasets from the healthy adult without SA and other image artifacts were used in the simulation. The simulation entailed shifting the images randomly across different diffusion directions in an individual’s DSI dataset. The correction algorithm was applied to correct shifted images, and the performance of correction was assessed by 2 indexes. The first index was the correlation coefficient (CC) between white matter (WM) tissue probability map (TPM) and generalized fractional anisotropy (GFA) map. The WM-TPM and GFA were derived from T1-weighted images and DSI, respectively. The CC was used to assess the performance of registration; the higher the CC, the better the registration. The second index was the functional difference (FD) of GFA profiles produced by tract-based automatic analysis (TBAA).3,4 The FDs were calculated by comparing the GFA profiles from the two groups (simulation/origin and correction/origin). Higher FD indicates more discrepancy of GFA profiles between the compared groups. In-vivo study: 25 image datasets with SA were collected in this study. The correction algorithm was employed to correct SA in each individual’s DSI dataset. The performance of correction was assessed by the CC between WM-TPM and GFA maps. Imaging parameters: The data of T1-weighted imaging and DSI were acquired on a 3T MRI system (TIM Trio, Siemen). T1-weighted imaging utilized a MPRAGE pulse sequence (TR/TE=2000/3 ms, flip angle= 9o, FOV=256X192X208 mm^2, resolution=1X1X1 mm^3). DSI utilized a pulsed gradient twice-refocused spin-echo diffusion echo-planar imaging sequence using a summation of 102 diffusion-encoding gradients with the bmax of 4000 s/mm^2. (TR/TE=9600/130 ms, FOV=200X200 mm^2, matrix size= 80X80).Results
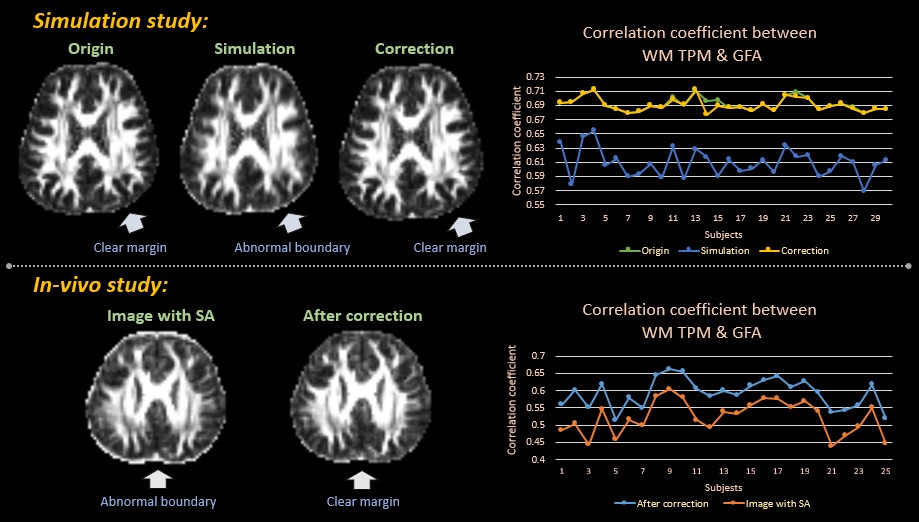
Simulation study: The CCs between WM-TPM and GFA map in the origin (no SA) were comparable to the correction group without significant difference (p=0.633). In contrast, the CCs of both the origin and the correction groups were significantly higher than those of the simulation group (p<0.001) (Figure 4, upper part). The mean FD of GFA profiles between the origin and the simulation groups was 8.1%, which was higher than the mean FD between the origin and the correction groups (0.35%). In-vivo study: The CCs between WM-TPM and GFA maps in the SA group were significantly lower than the correction group (p<0.001)(Figure 4, lower part).Discussion
In the simulation study, both the origin and correction groups showed better registration with WM-TPM and more accurate calculation of the diffusion index than the simulation group. The in-vivo study showed that SA was removed after correction. These results indicate that the correction algorithm was effective for both the simulated and the real in-vivo data with SA. However, if severe image distortion or real head motion exists, it would affect the performance of the algorithm.Acknowledgements
No acknowledgement found.References
1. Wedeen VJ, et al. "Mapping complex tissue architecture with diffusion spectrum magnetic resonance imaging." Magn Reson Med 54 (2005): 1377–1386.
2. Myung, In Jae. "Tutorial on maximum likelihood estimation." Journal of mathematical Psychology 47.1 (2003): 90-100.
3. Chen, Yu-Jen, et al. "Automatic whole brain tract-based analysis using predefined tracts in a diffusion spectrum imaging template and an accurate registration strategy."Human brain mapping 36.9 (2015): 3441-3458.
4. Gouttard S, et al. "Measures for validation of DTI tractography." Proc Soc Photo Opt Instrum Eng (2012): 8314:83140J.
Figures