1394
Robust On- and Off-Resonance constant amplitude spin-lock at the presence of B1 RF and B0 field inhomogeneity1Imaging and Interventional Radiology, The Chinese University of Hong Kong, New Territory, Hong Kong
Synopsis
T1rho is often measured by constant amplitude spin-lock, which can be played out either on-resonance or off-resonance. A major challenge to T1rho imaging with constant amplitude spin-lock is its susceptibility to B1 RF and B0 field inhomogeneity. A method to improve the robustness of on- and off-resonance constant amplitude spin-lock is presented in this work. The experimental results indicated that the proposed method can achieve superior image quality and improved quantification accuracy compared to the conventional approach in the presence of system imperfections.
Purpose
T1rho is a valuable biomarker for the assessment of tissue properties due to its sensitivity to the slow motional process of macromolecules. T1rho is often measured by constant amplitude spin-lock, which can be played out either on- or off-resonance. A major challenge to T1rho imaging with constant amplitude spin-lock is its susceptibility to B1 RF and B0 field inhomogeneity. A method to improve the robustness of on- and off-resonance constant amplitude spin-lock is presented in this work.METHODS
The adiabatic half passage (AHP) and the reverse AHP pulses have been used for T1rho imaging with constant amplitude spin-lock1-4. Here we show that we can use these pulses to suppress artifacts from both B1 RF and B0 field inhomogeneity for on- and off-resonance constant amplitude spin-lock. The proposed T1rho-prep RF pulse clusters consist of an AHP, followed by constant amplitude spin-lock, and a reverse AHP after spin-lock. The following condition is satisfied in the proposed approach:
ω 1,max=ω sl, [1]
where ω1,max is the maximum B1 amplitude of the AHP and the reverse AHP pulse, and ω sl is the spin-lock frequency. Under this condition, it can be shown that the spins are effectively locked throughout the spin-lock process at the following orientation:
θ(r) = tan-1(ω sl,true(r) / (ΔΩc + Δω0(r) ), [2]
where ΔΩ c is the resonant frequency of the spin-lock RF pulse, Δω0(r) is the B0 field inhomogeneity, and ω sl,true(r) is the actual spin-lock B1 amplitude, which is the expected spin-lock amplitude under the influence of B1 RF inhomogeneity. Figure 1 compares the evolution of magnetization during the time-course of T1rho-prep between the conventional spin-lock and the proposed approach. The magnetization evolution is calculated based on full equation Bloch simulation. Note the magnetization always aligns with the effective spin-lock field using the proposed method. In contrast, the magnetization deviates from the effective spin-lock when using conventional spin-lock approach, which results in image artifacts and quantification errors.
It was reported that relaxation effect during the relatively long adiabatic pulse can cause signal decay deviate from the mono-exponential model5. In this work, instead of fitting the signal to a mono-exponential model to quantify T1rho, the signal at different time-of-spinlock (TSL) is fitted to the following model:
I(TSL) = Aexp(-TSL/T1rho) + B, [3]
where A and B are constant terms. Figure 2 and 3 show the signals simulated with Bloch simulation and their fitting to Eq. [3] for on- and off-resonance spin-lock. Provided adiabatic condition is satisfied, Eq. [3] is a model with improved accuracy compared to a mono-exponential model.
Data sets were acquired from a Philips Achieva TX 3.0T system using both the conventional T1rho-prep and the proposed method. 2D Fast Spin Echo is used for imaging data acquisition after T1rho-prep. T1rho data sets were acquired with spin-lock at resonance offsets of 0, 100, 200, 300, 400, 500Hz, respectively. The scan parameters include: time-of-spinlock (TSL) 0, 10, 15, 25, 35, 45, 50, 60ms; spin-lock frequency 500Hz; FOV 15x15cm; resolution 2x2mm with slice thickness 6mm; TR/TE 2000/19ms. To investigate the robustness against system imperfections, a manual shimming is used with the field correction of 0.05 mT/m, 0.05mT/m and 0.02mT/m2 applied by the X, Y, and 2XY shim, respectively to increase B0 field inhomogeneity.
Results
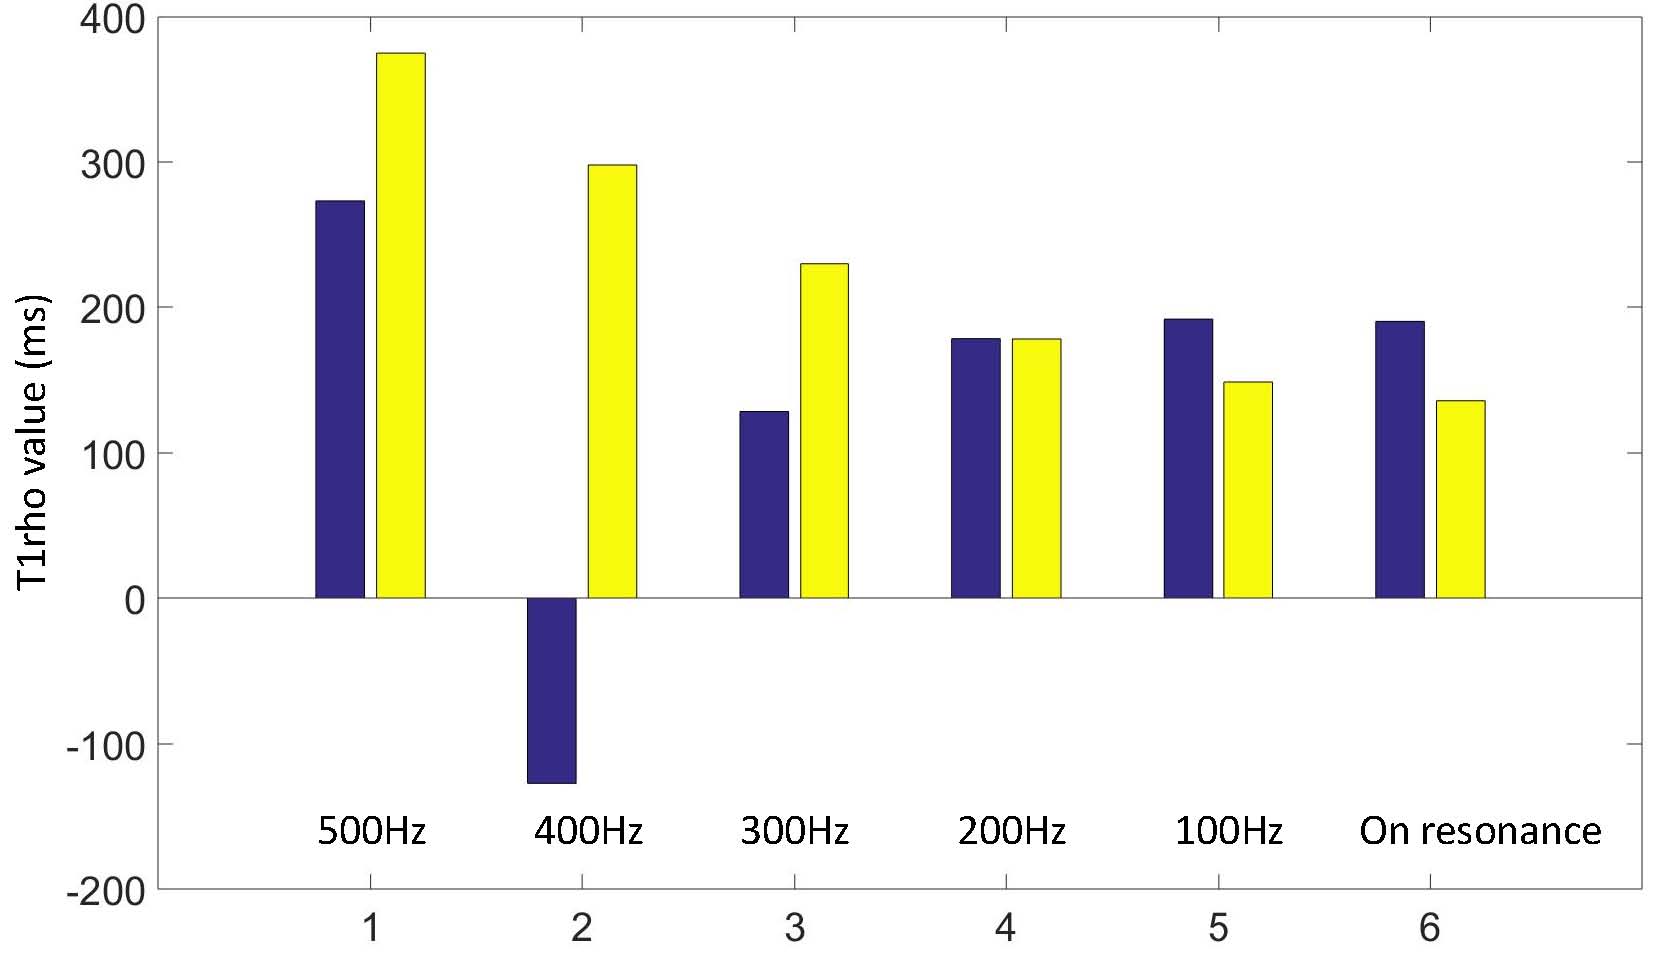
Figure 4 shows the T1rho-weighted images at TSL 60ms. Note the conventional T1rho-prep results in typical banding artifacts. The increase of resonance offset of spin-lock reducs artifacts level as it reduces sensitivity to B0 field inhomogeneity. In contrast, the proposed method achieves artifacts-free images at the various level of system imperfections. Figure 5 shows the quantification results. The T1rho measured using the proposed method increases at increased resonance offset of spin-lock due to the contribution from T1 relaxation. In contrast, the T1rho measured using the conventional approach shows apparent errors due to excessive image artifacts.Discussion and Conclusion
Witschey et al6 reported an approach to compensate B1 RF inhomogeneity during off-resonance spin-lock. To the best of author's knowledge, no approach has been reported for simultaneous compensation of B1 and B0 inhomogeneity during off-resonance T1rho imaging. The proposed approach is a potential solution to this problem. One downside of the proposed method is that fitting data to Eq. [3] may be more susceptible to signal oscillations when the adiabatic condition is not fully met and the presence of noise compared to fitting to a mono-exponential model, particularly when data sets are acquired only at a limited number of TSLs. The dual acquisition approach5 may be more robust under these conditions. Further investigation is needed to fully understand the limit of the proposed method.
Acknowledgements
This study was supported by grants from the Research Grants Council of the Hong Kong SAR (Project No. SEG CUHK02).References
1. Grohn et al, Magn Reson Med 2003;49:172–6.
2. Grohn et al, Magn. Reson. Med. 54 (2005) 14–19.
3. Jokivarsi et al, Journal of Cerebral Blood Flow & Metabolism. 2009 Jan 1;29(1):206-16.
4. Cobb et al, Magn Reson Med. 2011 Dec 1;66(6):1563-71.
5. Chen, Journal of Magnetic Resonance 2016 http://dx.doi.org/10.1016/j.jmr.2016.11.002
6. Witschey et al, Magn Reson Med. 2007 Jan 1;57(1):2-7.
Figures