1393
Longitudinal Monitoring of MR Image Distortion of a dedicated MR-Simulator for Radiotherapy over a 6-month Period1Medical Physics and Research Department, Hong Kong Sanatorium & Hospital, Hong Kong, Hong Kong
Synopsis
This study investigated the variation of
Purpose
To investigate the change of geometric distortion caused by B0 inhomogeneity and gradient nonlinearity throughout a 6-month period of a 1.5T 700mm-wide bore MR-simulator (Magnetom-Aera, Siemens Healthcare, Erlangen, Germany). A large customized geometric accuracy phantom was constructed for distortion quantification. Result was evaluated based on the distortion requirement of radiotherapy applications.Methods
3D gradient-echo (VIBE) and spin-echo (SPACE) were examined using coronal acquisition and 400Hz/Pixel bandwidth, console-integrated geometric distortion-correction was enabled.
A large (WidthxLengthxHeight:55x55x32.5cm3) geometric accuracy phantom made in polyurethane (MR/CT invisible) was constructed and filled with 3892 spherical markers (6mm-diameter, MR/CT visible) arranged on a 25mm isotropic-interval grid (Figure 1). A customized MatLab program was developed to detect marker positions on MR images and CT reference. Marker displacements from CT reference to MR images were employed for distortion analysis.
Each sequence was conducted three times on the first day of experiments (referred to as Apr(1), Apr(2) and Apr(3)) without repositioning of the phantom. An additional acquisition on each sequence was performed every month (May, Jun, Jul, Aug, Sep and Oct) afterward, a total of 18 acquisitions over a 6-month period.
Analysis was based on averaged marker positional differences in various diameter-of-spherical-volumes (DSVs), and DSVs within which 1mm-maximum-distortion allowed (requirement for radiotherapy applications$$$^1$$$). To investigate the distortion changes over different durations, the acquisitions underwent pairwise comparison based on a Distortion Difference Score. The score of a marker in an acquisition-pair was,
$$\frac{\text{MR}_1 \text{-to-MR}_2 \text{ Marker Displacement}}{\text{ CT-to-MR}_1 \text{Marker Displacement + CT-to-MR}_2 \text{ Marker Displacement}}\times 100\%$$
This score ranged from 0% (same distortion) to 100% (largely different distortion).
Results
The averaged distortion inside a set of DSVs in the 6-month period was hown in Figures 2a and b, and the 1mm-Maximum-Distortion DSVs were reported in Figure 2c. The result variations among Apr(1), Apr(2) and Apr(3) corresponded to the detection discrepancies caused by image noise. Within these same-day scans, the average distortion changes were less than 0.04mm, insignificant comparing to over 0.12mm distortion standard deviations (first to forth columns in Figure 3). Similarly, the 1mm-Maximum-Distortion DSVs differences were less than 2.1mm (last column in Figure 3), also insignificant compared to the over 240mm DSVs.
During the 6-month period, the averaged distortion and 1mm-Maximum-Distortion DSVs of both sequences fluctuated (Figure 2). No decisive trend was found regarding the changes of distortions and 1mm-Maximum-Distortion DSVs.
In pairwise acquisition comparison, all markers were divided into four groups depending on the marker locations: 1) Within 100mm DSV; 2) 100mm DSV to 200mm DSV; 3) 200mm DSV to 400mm DSV; 4) Beyond 400mm DSV. The Distortion Difference Score of markers within the same group of an acquisition-pair was averaged. The score distribution (Figure 4) showed an increment of scores when the time difference between two acquisitions was larger. It implied that the marker positions were changing throughout the 6-month experiment. In particular, the difference was more pronounce beyond 400mm DSV (up to 62.45%, the bottom tables in Figure 5) than within 100mm DSV (up to 9.87%, the top tables in Figure 5).
Discussion
The result variations among Apr(1), Apr(2) and Apr(3) of averaged distortion and 1mm-Maximum-Distortion DSVs were negligible. It suggested that image noise caused minimal effects on the distortion quantification in the experiment. Meanwhile, it is possible to obtain a 3D distortion map to warp MR images for geometric distortion correction, in addition to the console-integrated correction. However, caution should be taken when using prior distortion information for correction because marker positions kept changing throughout the 6-month period. It was illustrated by the pairwise comparison results (Figures 4-5), where Distortion Difference Score (i.e. marker positional variations) of two scans mostly increased as acquisition time was further apart, especially in large DSVs. Although such variations caused minimal changes on averaged distortion and 1mm-Maximum-Distortion DSVs, it would be necessary to regularly validate the geometric accuracy of images corrected based on prior distortion information.
Conclusion
The pairwise comparison results implied varying marker positions under distortion throughout the 6-month period. It caused insignificant variations of averaged distortion and 1mm-Maximum-Distortion DSVs. Finally, in terms of geometric fidelity, the over 240mm 1mm-Maximum-Distortion DSVs of both examined sequences could serve radiotherapy applications, e.g. brain or head and neck treatments.Acknowledgements
No acknowledgement found.References
1. S. Mutic, J. R. Palta, E.K. Butker, I.J. Das, M. Saiful Huq, L-.N.D. Loo, B.J. Salter, C.H. McCollough, J. Van Dyk, Quality assurance for computed-tomography simulators and the computed tomography-simulation process: Report of the AAPM Radiation Therapy Committee Task Group No. 66, Med. Phys. 2003, 30(10), pp. 2762-2792.Figures
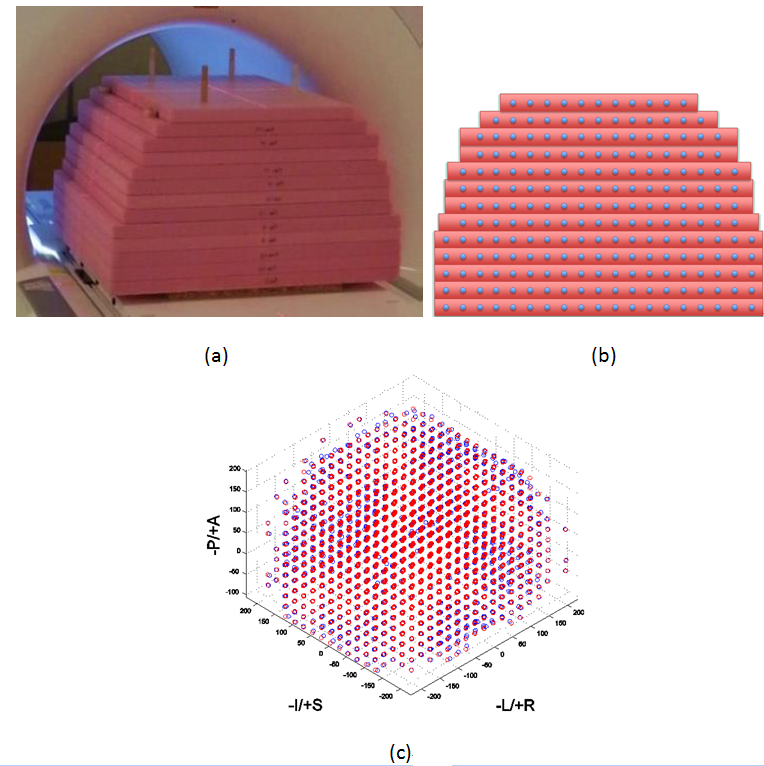
Figure 1
The geometry accuracy phantom. (a) The phantom was positioned at the isocenter according to external laser. (b) Schematic of an axial view of the phantom. The blue dots illustrate the marker positions. (c) An example of detected marker positions in MR image (blue) and CT reference (red).
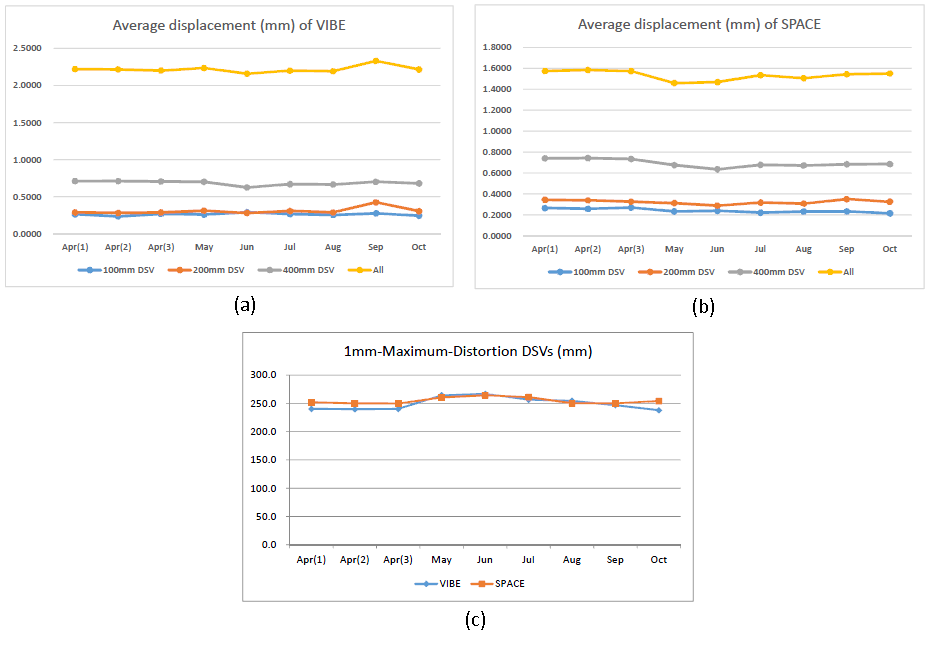
Figure 2
(a, b) The averaged marker displacement from CT reference to MR images within 100mm, 200mm and 400mm DSVs, and “All” (the entire field-of-view). (c) The DSVs within which the maximum detected CT to MR marker displacement is less than 1mm.
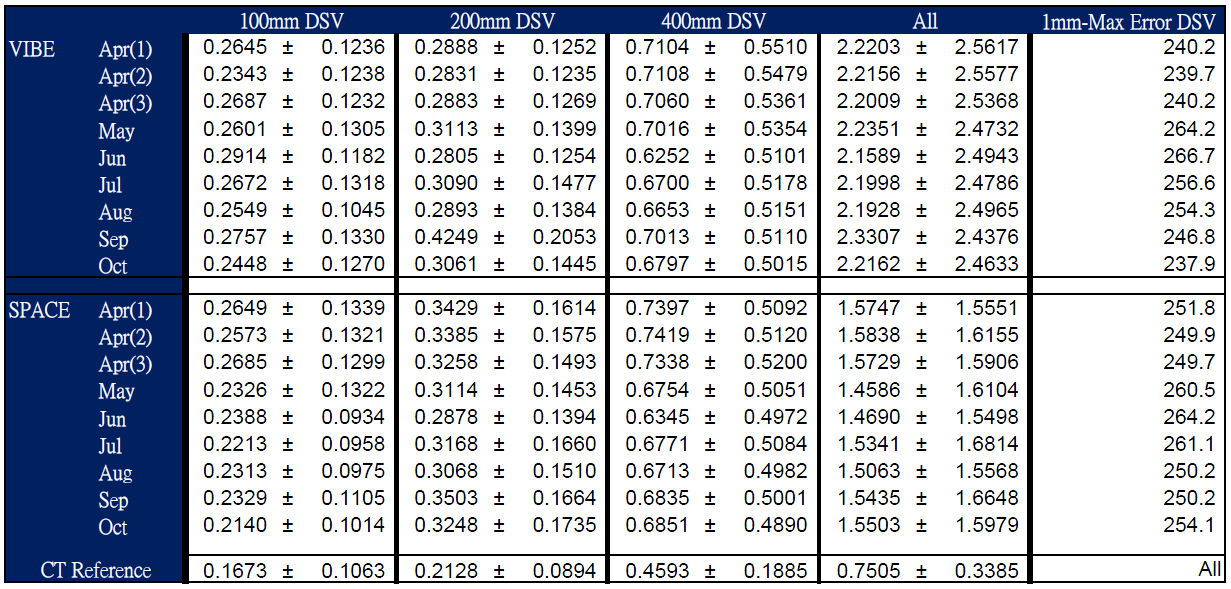
Figure 3
(First four columns) The mean$$$\pm$$$S.D. marker displacement from CT reference to MR images within 100mm, 200mm and 400mm DSVs, and “All” (the entire field-of-view) shown in Figures 1a and b. (Last column) The values of 1mm-Maximum-Distortion DSVs shown in Figure 1c.
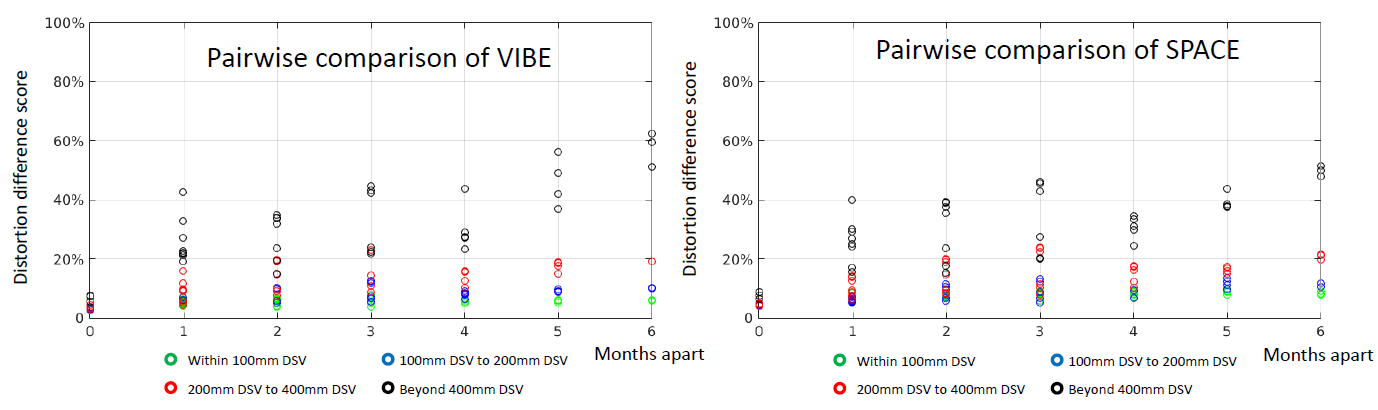
Figure 4
The pairwise comparison among acquisitions. Every dot in the above figures represented the Distortion Difference Score of an acquisition-pair (any two of Apr(1), Apr(2), Apr(3), May, Jun, Jul, Aug, Sep and Oct) averaged within a region (Within 100mm DSV, 100mm DSV to 200mm DSV, 200mm DSV to 400mm DSV, Beyond 400mm DSV). The x-axis corresponded to acquisition time differences of acquisition-pairs. This comparison included acquisitions taken on the same day (zero month apart, e.g. Apr(1), Apr(2) and Apr(3)), 1 month apart (e.g. May and Jun) up to 6 months apart (e.g. Apr(1) and Oct).
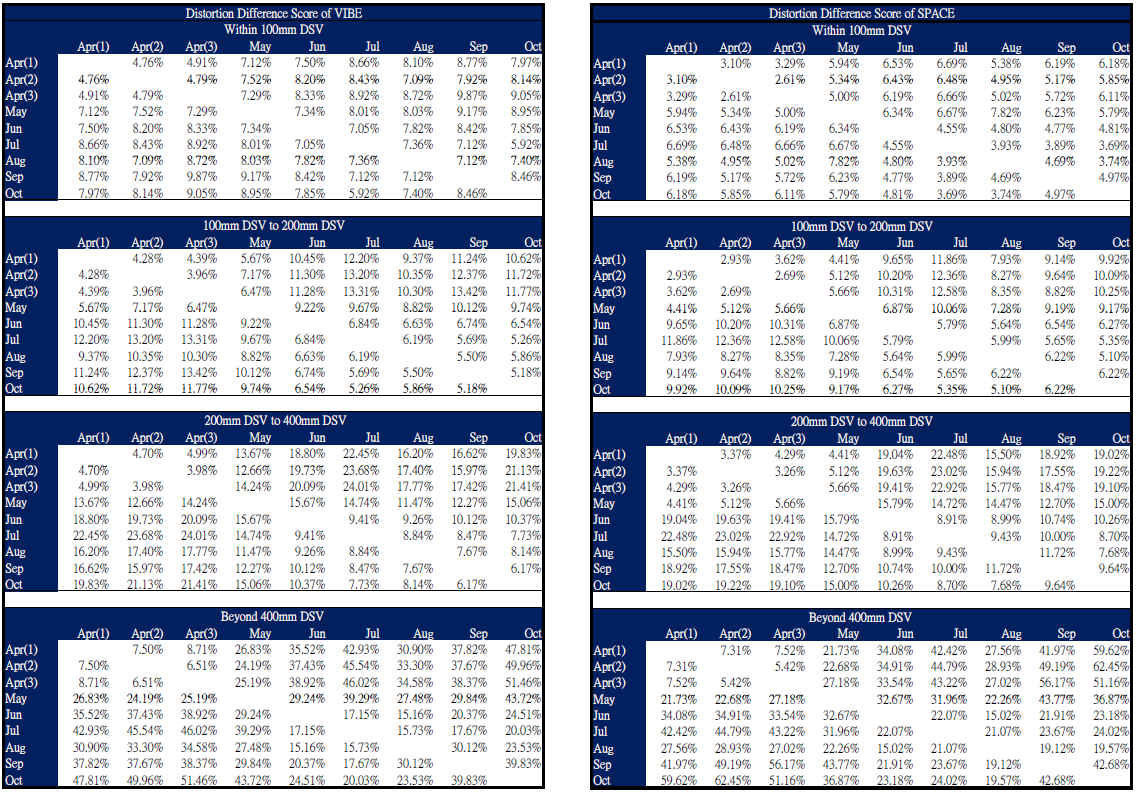
Figure 5
The Distortion Difference Score of different acquisition-pairs averaged within various regions shown in Figure 4.