1392
Comprehensive analysis of MR geometric distortion of multiple pulses sequence for radiotherapy applications1Hong Kong Sanatorium & Hospital, Hong Kong, Hong Kong, Hong Kong
Synopsis
This study evaluated three-dimensional geometric distortion of six selected potential MR sequences for radiotherapy applications, acquired from a 1.5T 700mm-wide bore MR-simulator. Every sequence was investigated in three acquisition-orientations and multiple receiver-bandwidths, under various diameter-sphere-volume (DSVs). A large geometric accuracy phantom was constructed to quantify the distortion within the largest field-of-view allowed. Detailed distortion statistics, evaluation based on distortion requirements of different radiotherapy applications and comparison among sequences were reported. Results showed that sequence-types and acquisition-orientations were more influential to distortion than receiver-bandwidths. The distortion statistics are also a valuable guideline for sequence selection and optimization for radiotherapy.
Purpose
This study aims to quantify and compare the three-dimensional geometric distortion of six selected potential MR sequences for radiotherapy (RT) applications, acquired from a 1.5T 700mm-wide bore MR-simulator (Magnetom-Aera, Siemens Healthcare, Erlangen, Germany). These sequences are rigorously examined in various acquisition-orientations and receiver-bandwidths using a large custom-made geometric accuracy phantom (WidthxLengthxHeight:55cmx55cmx32.5cm).Methods
Two gradient-echo (VIBE, GRE), three spin-echo (SPACE, TSE, BLADE) and one ultra-short-TE sequences (PETRA) were selected (Figure 1) for evaluation, because of their potentials for radiotherapy applications such as treatment planning, patient positioning$$$^1$$$, prognosis, MR-based dosimetry and radiation delivery guidance. Each sequence was conducted in three acquisition-orientations and multiple receiver-bandwidths (200, 400 or 800Hz/pixel depending on availability), console-integrated distortion correction enabled, providing a total of 36 acquisitions for testing.
A phantom was constructed to fit the bore. It was made in polyurethane and filled with 3892 hydrogenous markers (6mm-diameter spheres) distributed on a 25mm-interval grid (Figure 2). MatLab scripts were developed in-house to compute marker positions in all images. CT-to-MR marker displacements yielded a quantitative geometric distortion measurement. This study investigated the average displacements in various diameter-of-spherical-volumes (DSVs), DSVs under different maximum-displacements and compared marker locations under distortion among all acquisitions.
Results
The average displacements in various DSVs (Figure 3) and DSVs under different maximum-displacement (Figure 4) exhibited considerable variations among tested acquisitions. No combination of sequence-type, acquisition-orientation and receiver-bandwidth consistently deliver the lowest distortion while any one of these factors was varying.
The similarity of distortion among acquisitions was investigated by pairwise comparisons among acquisitions based on a marker displacement ratio. The ratio of a marker in an acquisition-pair was defined as $$$\frac{\text{MR}_1 \text{-to-MR}_2 \text{ Displacement}}{\text{ CT-to-MR}_1 \text{Displacement + CT-to-MR}_2 \text{ Displacement}}$$$. The ratios of all markers in each acquisition-pair were averaged (Figure 5). This averaged ratio was zero if two acquisitions had identical distortion. A larger ratio represented more dissimilar distortion pattern. In this regard, no acquisition pair showed identical distortion and the ratios varied from 0.05 to 0.59 (Figure 5).
Discussion
The measured distortion could be affected by the variation of console-integrated distortion correction performance and Signal-to-Noise ratios among images, in addition to choices of sequence-types, acquisition-orientations and receiver-bandwidths. It is possible to observe distortion results, e.g. high receiver-bandwidths cases showing stronger distortion (Figure 3, SPACE-Sagittal cases) that is different from theoretical prediction.
Considering the 1mm distortion-limit$$$^2$$$, the largest 1mm-maximum-displacement DSVs (Figure 4) of VIBE (294.3mm), SPACE (268.0mm), GRE (248.8mm) and PETRA (253.9mm) have potential for brain or head and neck RT in terms of geometric fidelity. Both TSE (219.2mm) and BLADE (207.2mm) demonstrated relatively small 1mm-maximum-distortion-DSVs and may need additional distortion-correction based on the marker displacement information prior to radiotherapeutic use. Nonetheless, the 1mm-maximum-displacement DSVs could vary significantly in the same sequence-type (e.g. the largest/smallest 1mm-DSVs of VIBE are 294.3mm/200.8mm) in various acquisition-orientations and receiver-bandwidths. To minimize geometric distortion in practice, acquisition-orientations and receiver-bandwidths should be chosen with reference to prior distortion measurements.
Based on the dense marker positioning (25mm-interval) and large phantom coverage (55cmx55cmx32.5cm), a high resolution distortion map could be built using the marker displacement information. The distortion map enables offline distortion-correction by unwarping MR images (e.g. analogous to unwarping the grid from Figure 2d to obtain the one in Figure 2c), in addition to the console-integrated correction. Experiment results hinted that offline correction is more important being specific to sequence-types and acquisition-orientations, than to receiver-bandwidths. It is because the averaged ratios (Figure 5) among different acquisition-orientations of the same sequence-types are noticeably larger (ranged from 0.12 to 0.59) than those from different receiver-bandwidths but same sequence-types/acquisition-orientations (ranged from 0.05 to 0.14) in all sequence-types. Nonetheless, unwarping is recommended, even though subject-specific distortion introduced by chemical shifts and susceptibility persists in practice. Further in-vivo test will be conducted to quantify subject specific distortion in the future.
Conclusion
Configuring a sequence for RT applications with reference to prior distortion measurements is important as no general rule was observed to attain minimum geometric distortion. On one hand, the distortion analysis results (Figures 3-4) could be a valuable guideline for sequences selection and optimization to suit radiotherapy needs. On the other hand, one may consider constructing the same geometric accuracy phantom for image unwarping based distortion-correction. According to the pairwise comparison results in Figure 5, the correction should be specific to both sequence-types and acquisition-orientations.Acknowledgements
No acknowledgement found.References
1. J. Sun, J.A. Dowling, P. Pichler, J. Parker, J. Martin, P. Stanwell, J. Arm, F. Menk, P.B. Greer, Investigation on the performance of dedicated radiotherapy positioning devices for MR scanning for prostate planning, J. App. Clinical Med. Phys. 2015: 16(2), pp. 4-13.
2. S. Mutic, J. R. Palta, E.K. Butker, I.J. Das, M. Saiful Huq, L-.N.D. Loo, B.J. Salter, C.H. McCollough, J. Van Dyk, Quality assurance for computed-tomography simulators and the computed tomography-simulation process: Report of the AAPM Radiation Therapy Committee Task Group No. 66, Med. Phys. 2003, 30(10), pp. 2762-2792.
Figures
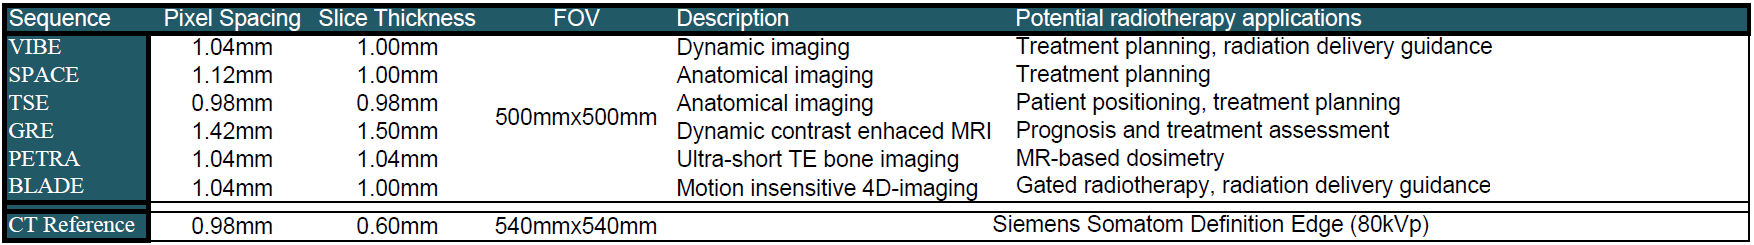
Figure 1
Descriptions of different MR sequences and the reference CT of the experiments. All MR sequences were acquired with console-integrated distortion-correction
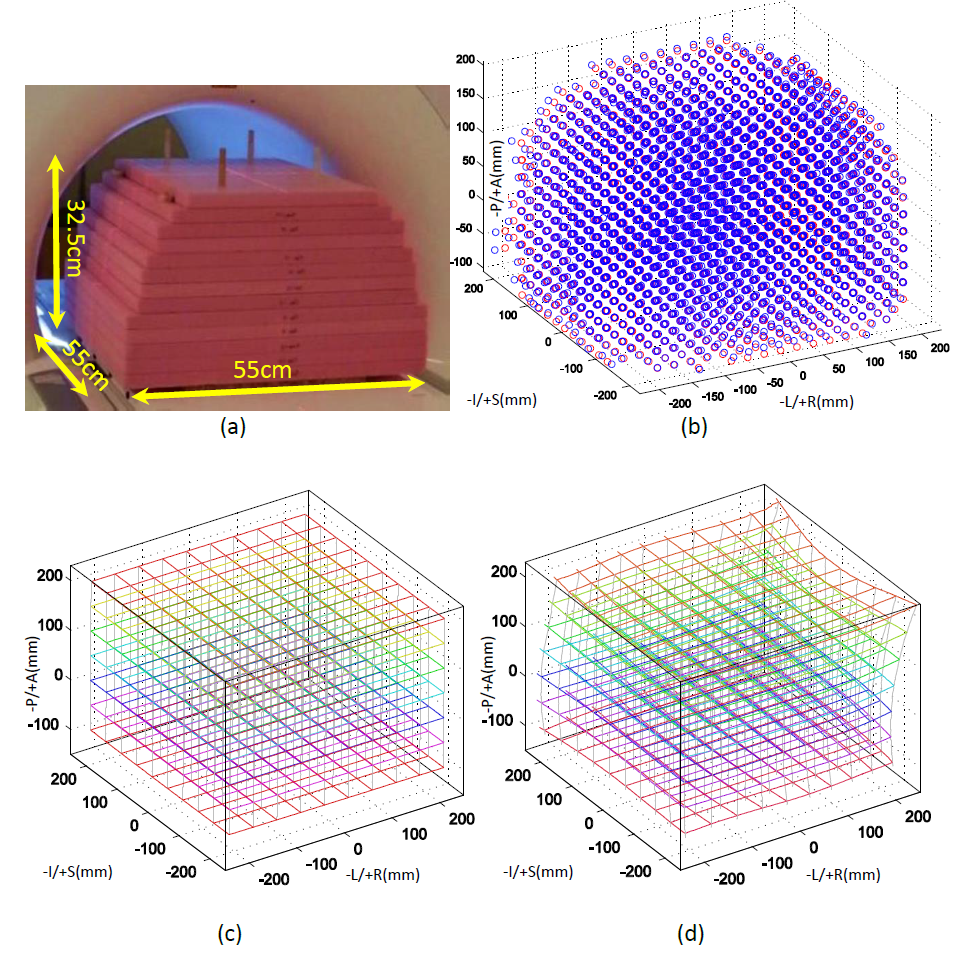
Figure 2
(a) Geometric accuracy phantom. (b) Markers on CT (red) and MR (blue) detected by the in-house MatLab scripts. (c) Example of cubic grid spending the entire field-of-view of a CT image, being very slightly distorted according to the detected marker positions in the CT. (d) The same cubic grid being distorted according to the detected marker positions in one of the tested acquisitions: TSE, Coronal-acquisition, 200Hz/Pixel receiver-bandwidth.
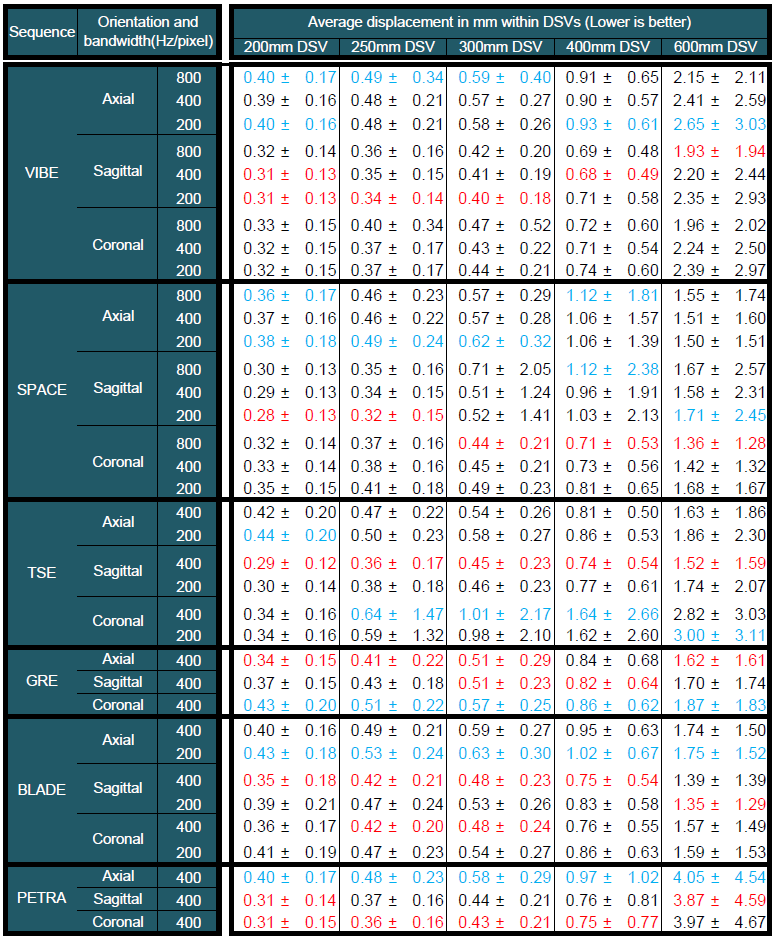
Figure 3
The CT-to-MR marker displacement (lower is better) in mean$$$\pm$$$S.D. of tested sequences within various diameter-of-spheres (DSVs). For each sequence-type, the worst (highest) and the best (lowest) values are highlighted in blue and red respectively.
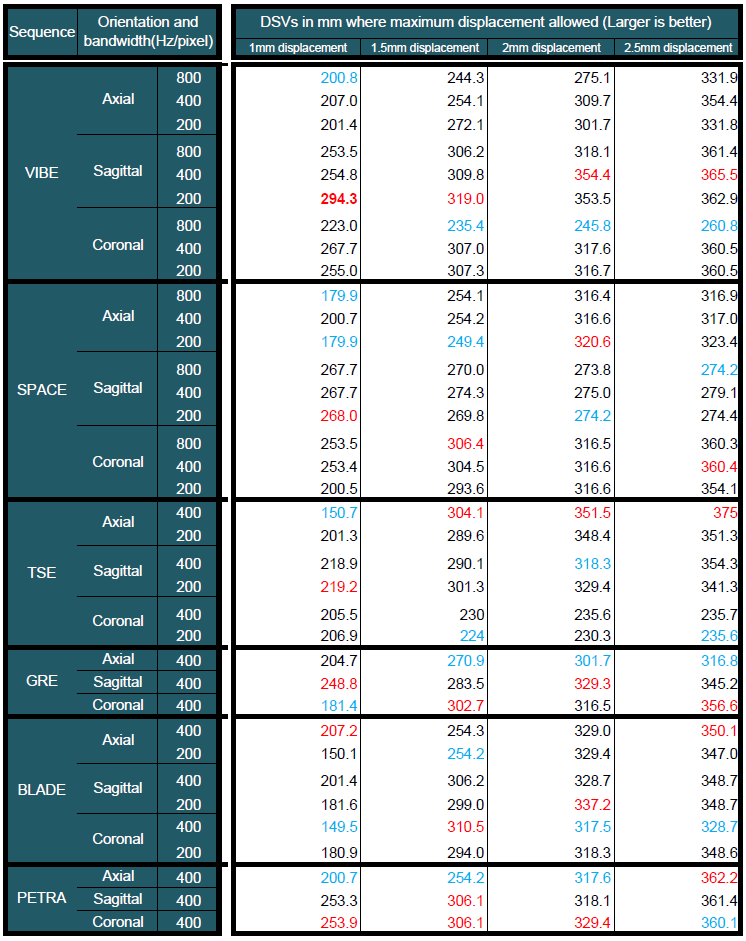
Figure 4
The diameter-of-spheres (DSVs, higher is better) in which all CT-to-MR marker displacements are below 1mm, 1.5mm, 2mm and 2.5mm. For each sequence-type, the worst (lowest) and the best (highest) values are highlighted in blue and red respectively.
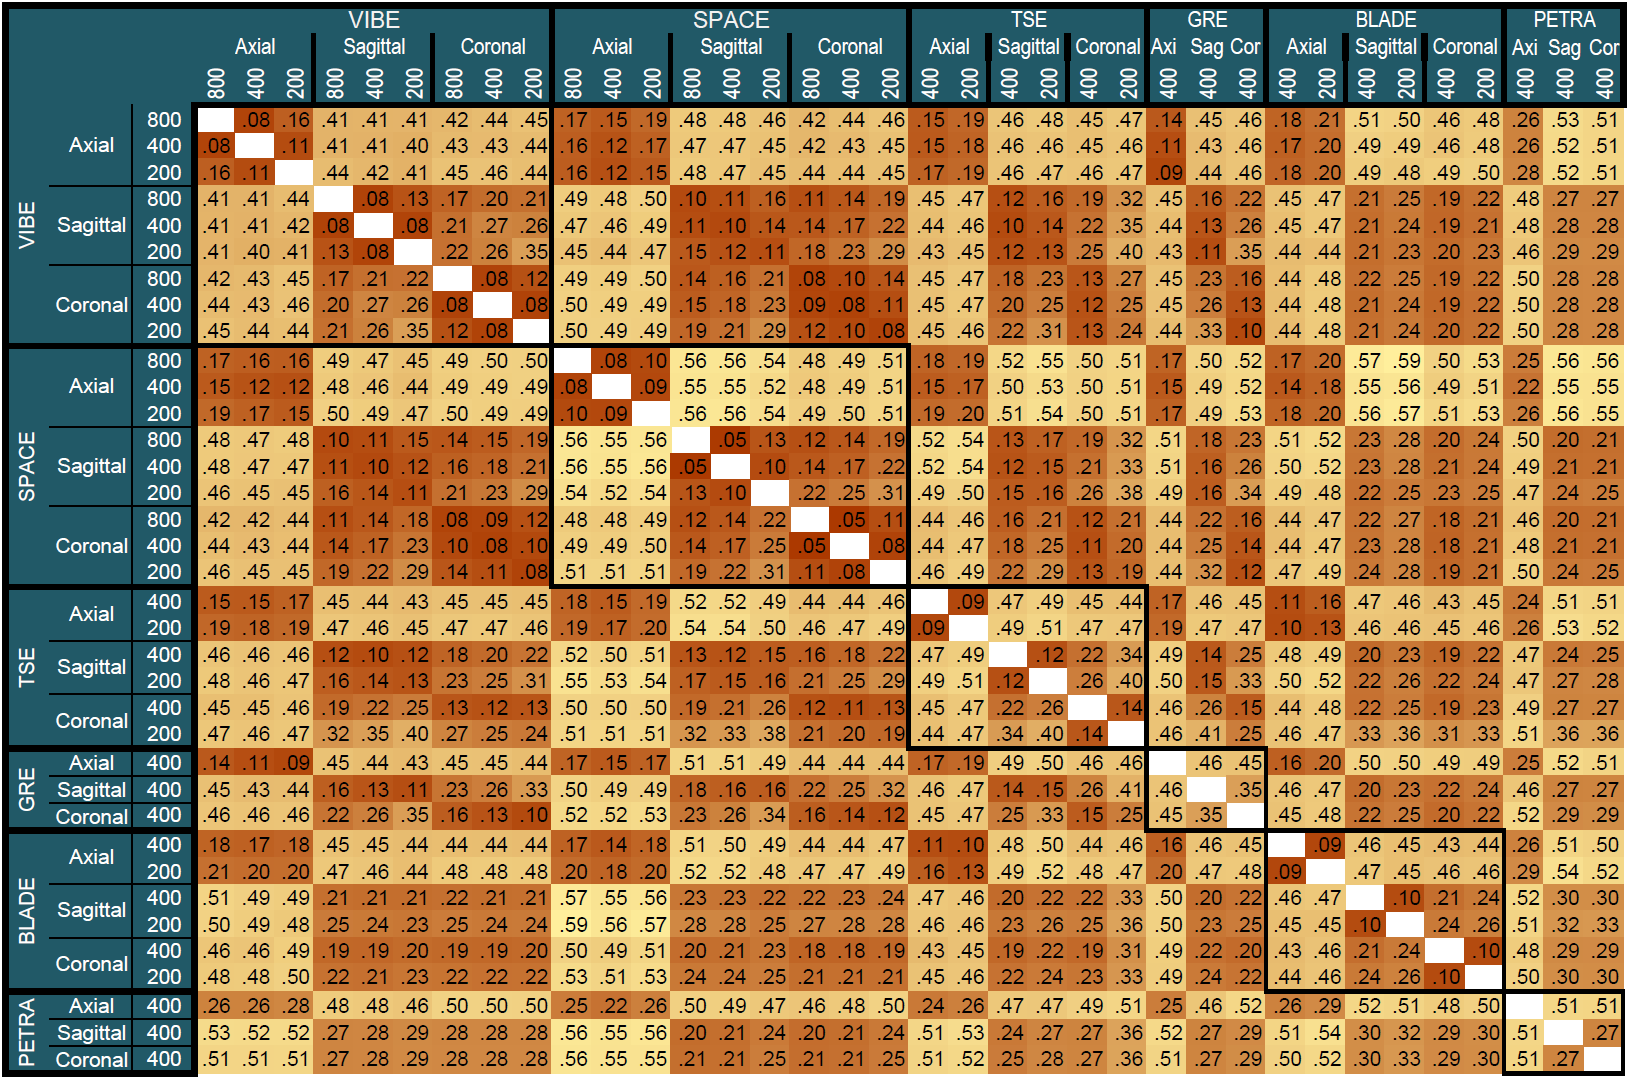
Figure 5
The pairwise distortion comparison of all 36 tested sequences. Values are the average of ratios of all markers in each MR acquisition pair. The ratio of a marker in a MR acquisition pair is $$$\frac{\text{MR}_1 \text{-to-MR}_2 \text{ Displacement}}{\text{CT-to-MR}_1 \text{Displacement + CT-to-MR}_2 \text{ Displacement}}$$$. Each cell is colored according to the averaged ratio, from dark-brown (lowest values, similar marker location under distortion) to pale-orange (highest values, dissimilar marker location under distortion).