1390
Performance assessment of EPI-distortion correction of brain images; which plane and phase encoding direction should be chosen?1Radiology, Harvard Medical School, Boston, MA, United States
Synopsis
Echo-Planar-Imaging (EPI) is often used in DW-MRI to acquire a full volume in a short period of time. These images, however, show substantial local geometric and intensity distortions due to the susceptibility artefact. A popular method to correct for these distortions is to acquire a pair of images with opposite phase-encoding-directions (PED) but same slice-encoding-direction (SED) from which the distortion field can be estimated. While the choice of SED and PED likely impacts the correction effectiveness, it has never been rigorously quantitatively evaluated. In this work, we acquired scans with all combinations of SEDs and PEDs and evaluated the correction quality of three different distortion correction implementations.
PURPOSE
Our aim was to compare the impact of both SED and PED on the EPI-corrected data. To do so, we acquired EPI scans with all combinations of SEDs and PEDs and compared the distortion corrected images with a distortion-free T2 scan.METHOD
In-vivo MR imaging was carried out on a 3T Siemens scanner with 64 channel coil. We acquired diffusion-weighted images (DWI) scans of a healthy subject with all possible SED (axial, sagittal, coronal) and all PEDs for each, leading to 12 acquisitions: AX-LR, AX-RL, AX-AP, AX-PA, SAG-HF, SAG-FH, SAG-AP, SAG-PA, COR-LR, COR-RL, COR-HF, COR-FH. The parameters were: matrix size=128x128x90; resolution=2x2x2mm3, TE=89ms 5900ms<TR<8100ms, a single b=0s/mm2 image. A T2 image (matrix size=256x256x80; resolution=1x1x2mm3) was also acquired and used as a distortion free reference image.
We investigated three different EPI-distortion correction methods: Topup [1] , Tortoise [2], and a recent block-matching registration approach [3]. Images with opposite PEDs were fed to each algorithm. The T2 was also fed to tortoise.
To assess the similarity between the corrected-B0 images and T2 image, we first rigidly registered them to the T2 image and then, we computed mutual information (MI) between the images for the voxels within the brain mask. Our hypothesis was that a higher similarity would be achieved in the presence of a better EPI-corrected image. We also performed non-rigid registration using ANTS [4] between the corrected B0s and T2 image to evaluate the amplitude of the remaining distortion. Our hypothesis was that a more successful EPI-correction would lead to less remaining deformation.
RESULTS
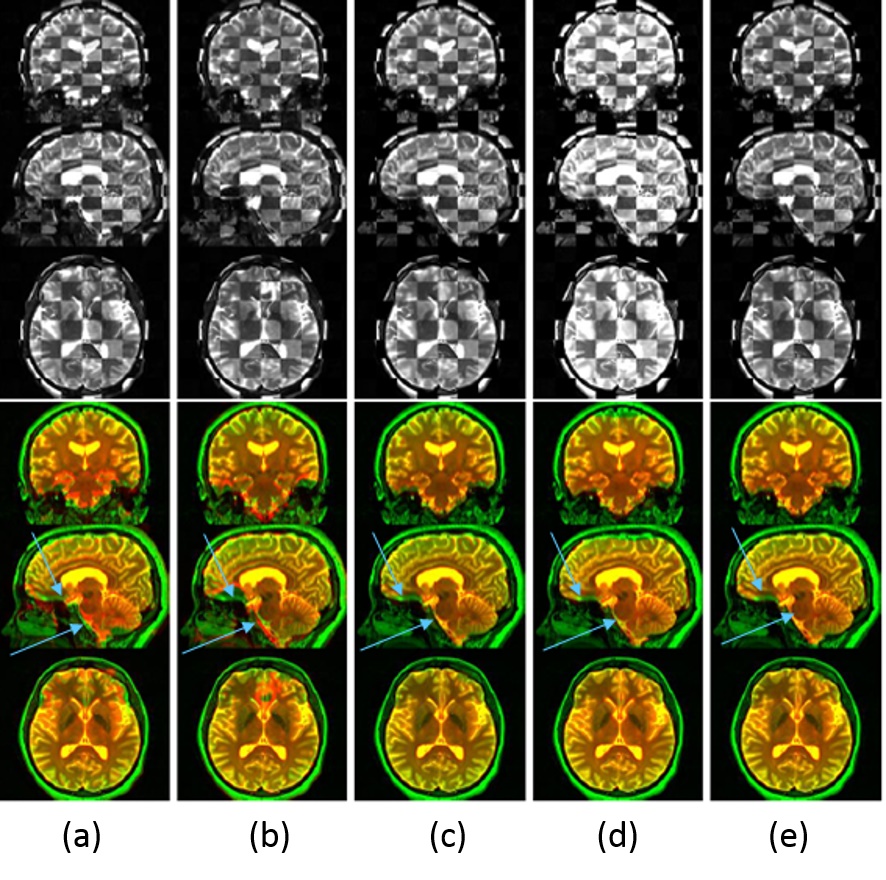
Figure.1 shows examples of the rigidly registered B0 images for one set of the images with sagittal SED and head-foot (HF) foot-head (FH) PEDs. It can be seen that the corrected images resulted by applying the three evaluated methods [1,2,3] (the last three columns) are better aligned to the T2 image compared to the non-corrected images (the first two columns). However, it is hard to identify the best corrected image visually.
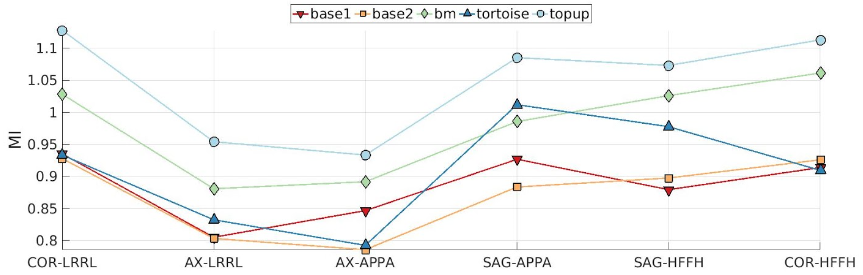
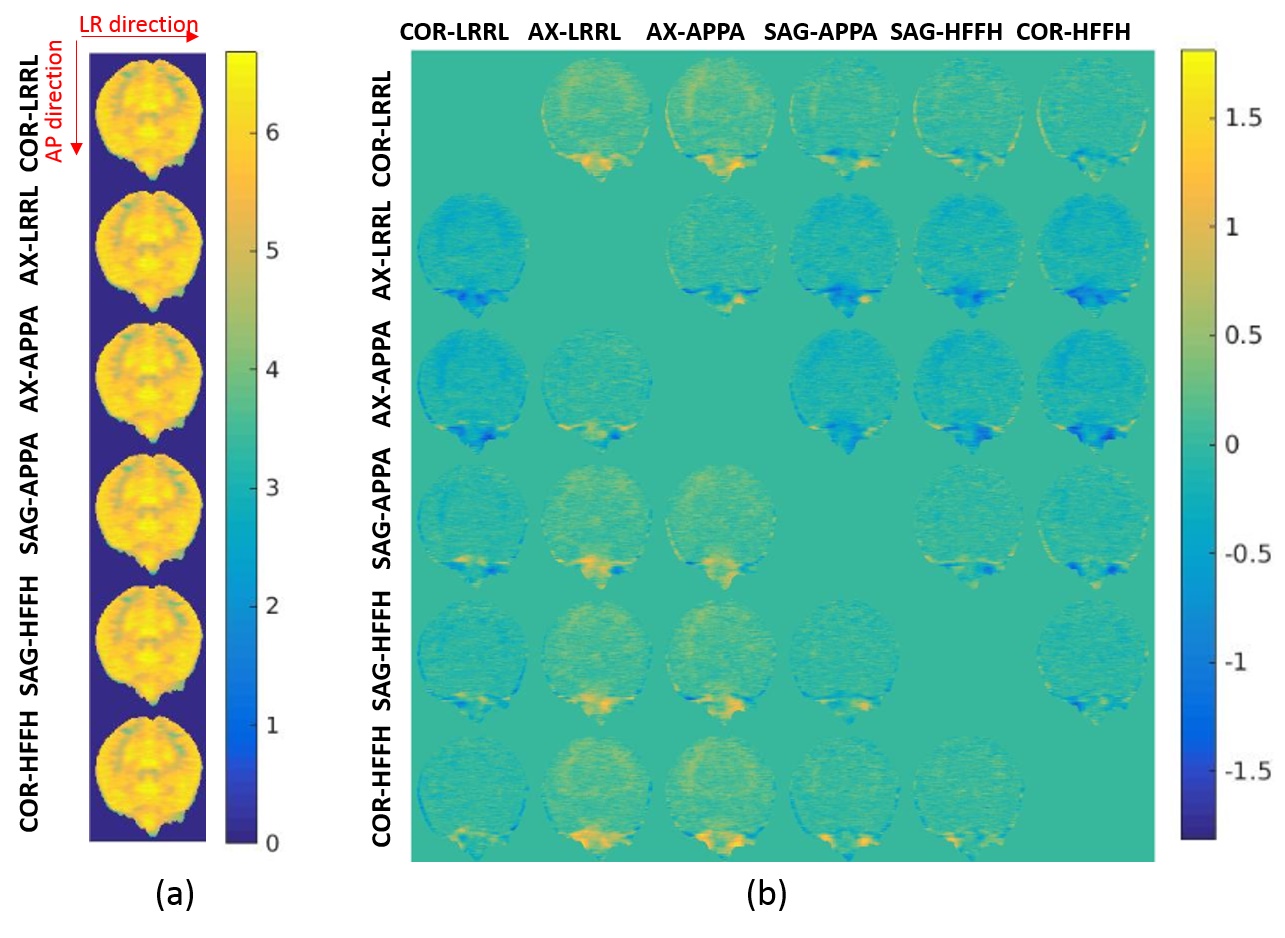
Our quantitative evaluation is reported in Figure.3. It can be seen that MI is higher for coronal and sagittal SED compared to the scans with axial SED. Further, it can be noted that based on MI metric, Topup leads to the highest similarity. The localize MIs computed at patches of size 5x5x5 are shown in Figure.3. The results indicate that the maximum differences are achieved between COR-LRRL and the axial images specifically at the sinus region.
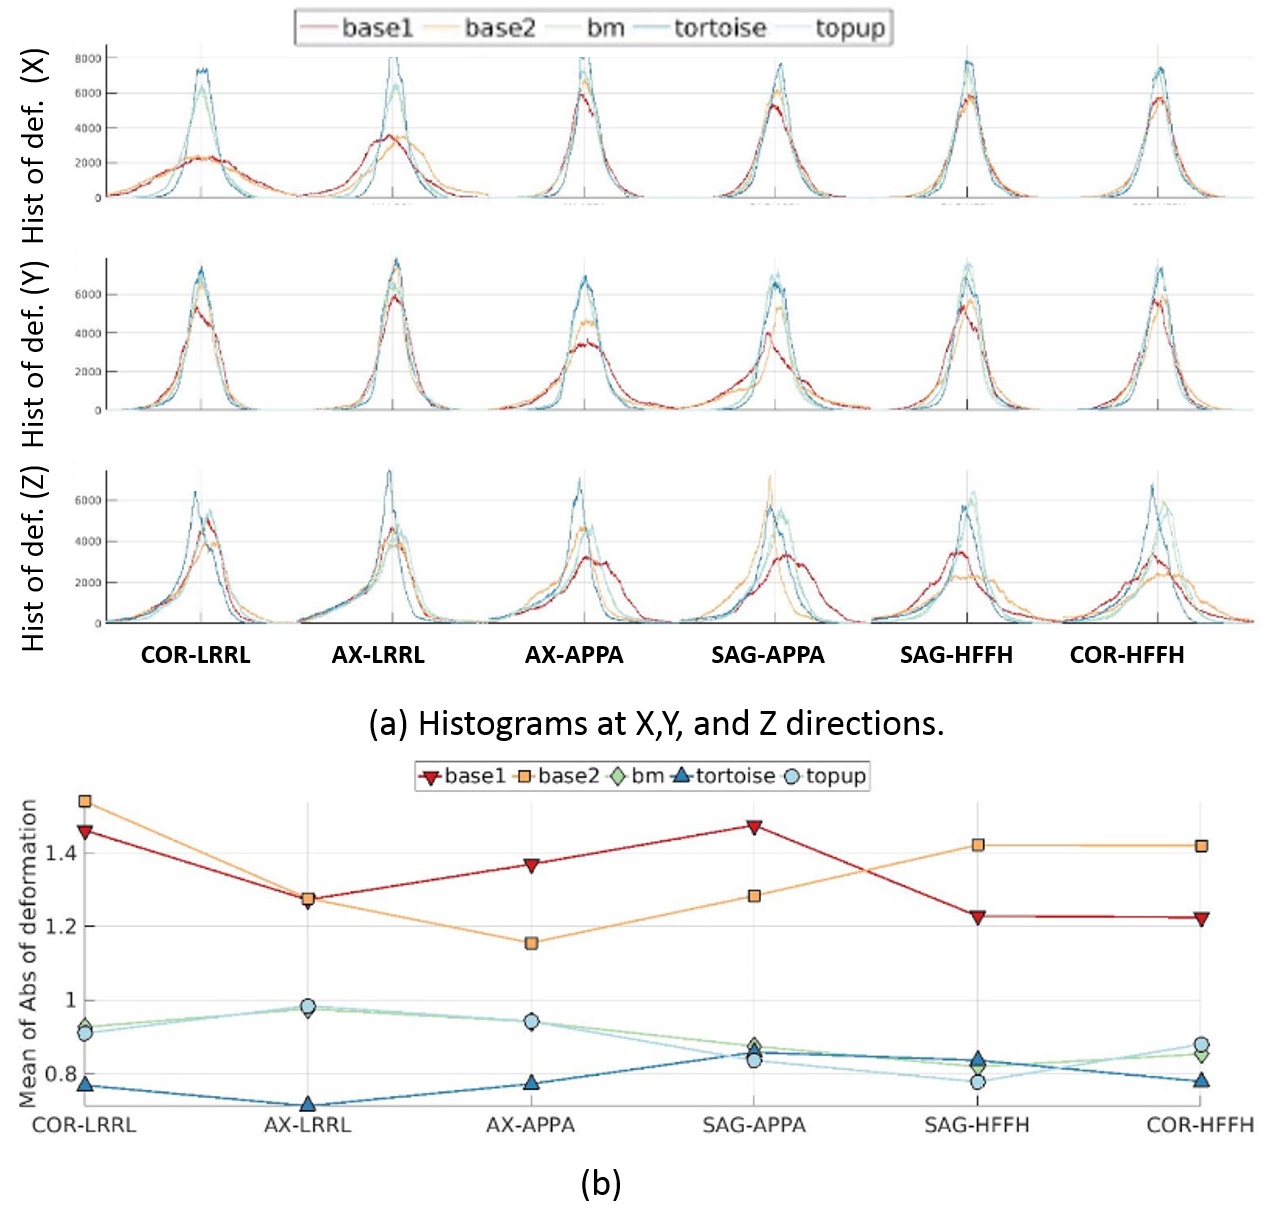
We performed non-rigid registration over the B0 images. The means and histograms of the remaining deformations after correction are reported in Figure.4. It can be seen that without any correction (baseline images, red and orange plots) have more deformation compared to the corrected images, as expected. Moreover, the plot shows that Tortoise leads to the least remaining distortion.
Comparing the results for different SEDs and PEDs, it can be seen that the quantitative results by Topup and block-matching are consistent for both metrics and the results indicate that sagittal and coronal SEDs lead to better accuracies/similarities/less-remaining deformation compared to the axial images. Our results indidate that PED does not matter for a given SED as long as FOV is large enough to avoid aliasing.
DISCUSSION and CONCLUSION
To the best of our knowledge, this is the first work to assess the impact of both SED and PED on the performance of EPI-distortion correction, which is an important issue to be considered in the settings of the DW-MRI protocols. On HCP dataset, the PED was chosen to be LR with axial plane in order to minimize the number of phase encodes and therefore the distortion. It was stated that axial-LRRL allows an approximately 20% reduction in echo time compared with axial-APPA, leading to an additional SNR benefit. However, there is not any direct comparison among EPI-corrections at different SEDs and PEDs [5]. Our quantitative results based on MI and remaining distortion suggest that COR-LRRL may provide better results. However, this also would result in a longer scan time since coronal acquisition requires a higher number of slices. Future work will focus on confirming these findings using a MR simulator of the the image formation that incorporates the simulation of susceptibility related distortions.Acknowledgements
The authors would like to acknowledge the following grants which supported this work: R01 EB019483, R01 EB018988, R01 NS07978, R01 EB013248, R01 NS079788.References
[1] Andersson J, Skare S, Ashburner J, How to correct susceptibility distortions in spin-echo echo-planar images: application todiffusion tensor imaging, Neuroimage, 2003; 870-888.
[2] Irfanoglu M, Modi P, Nayak A, Hutchinson E, Sarlls J, Pierpaoli C, DR-BUDDI (Diffeomorphic Registration for Blip-Up Blip-Down Diffusion Imaging) Method for Correcting Echo Planar Imaging Distortions, Neuroimage, 2015; 284–299.
[3] Hédouin R, Commowick O, Taquet M, Bannier E, Scherrer B, Warfield S. K, Barillot C,Symmetric block-matching registration for the distortion correction of Echo-Planar images, IEEE ISBI, 2015; 717-720.
[4] Avants, B., Tustison, N., Johnson, H.: Advanced Normal-ization Tools. (2014)
[5] Sotiropoulos et al., Advances in diffusion MRI acquisition and processing in the Human Connectome Project, Neuroimage, 2013; 80:125-43.
Figures