1388
Characterization of k-space trajectory error using time delay correction for EPI1Institute of Biomedical Engineering, National Taiwan University, Taipei, Taiwan, 2Medical Physics, Department of Radiology, University Medical Center Freiburg, Freiburg, Germany, 3Department of Neuroscience and Biomedical Engineering, Aalto University, Espoo, Finland
Synopsis
The ghosting artifacts in echo-planar imaging can be greatly reduced by aligning the k-space coordinates between odd and even lines based on their relative time delay. However, we found this approach is limited in artifact reduction. Specifically, we found that the image still has prominent artifacts and high spatial frequency k-space coordinates for even and odd lines still differ from each other significantly after time delay correction. This result suggested the origin of the ghosting artifact is beyond the time delays between neighboring readouts. The image artifact, however, can be greatly reduced using trajectory correction.
Target audience
Scientists and physicians interested in high-quality echo-planar imaging.Introduction
Echo-planar imaging (EPI) is a popular fast imaging method because of its fast k-space traversal, fast image reconstruction, and easy B0 off-resonance correction. Due to gradient delays, eddy currents, and data sample timing errors, the actual k-space coordinates of sampled data points often differ significantly from the derived ones. Therefore, a calibration measurement is necessary to quantify this difference and correct for the artifact. Acquiring a calibration scan without phase encoding gradient can partially solve this problem by estimating the time delay between even and odd echoes1. Ghosting artifacts can be greatly reduced by aligning odd or even sampled k-space lines by shifting their k-space coordinates based on this time delay. Addy et. al. showed that this time delay correction for EPI image reconstruction can achieve similar image quality to images reconstructed using a measured trajectory2. However, in high-resolution fMRI, we found that the image quality of EPI is not satisfactory after the time delay correction. To investigate the cause of this problem, we measured the k-space coordinates of one even and one odd lines using a field probe array3 and applied time delay correction. Ideally there should be minimal difference between odd and even lines after the correction. However, the k-space frequency encoding coordinates of odd and even lines still differed significantly between each other at high spatial frequencies. Our results suggested the limit of time delay correction in reducing artifacts caused by incorrect information at high spatial frequencies.Method
A 24-channel field probe array was used to estimate the k-space trajectory3. Multi-slices segmented GRE-EPI sequence with 1mm isotropic resolution (TR/TE=3000/37ms, FA=90o, FOV=200x200x33mm3, segments=4, bandwidth per pixel=890Hz) was used in this study. All data were collected on a 3T MRI scanner (Skyra, Siemens). The instantaneous linear gradient strength was calculated by fitting the resonance frequencies measured from all field probes using the 0th- and 1st-order polynomials4. The estimated gradient waveforms for even and odd k-space lines were averaged separately such that only one even and one odd gradient waveforms were used for calibration and image reconstruction. Three different image reconstruction approaches were used: no correction, time delay correction, and k-space trajectory correction. The delay between echoes needed for the time delay correction was estimated from the measured k-space trajectory.Result
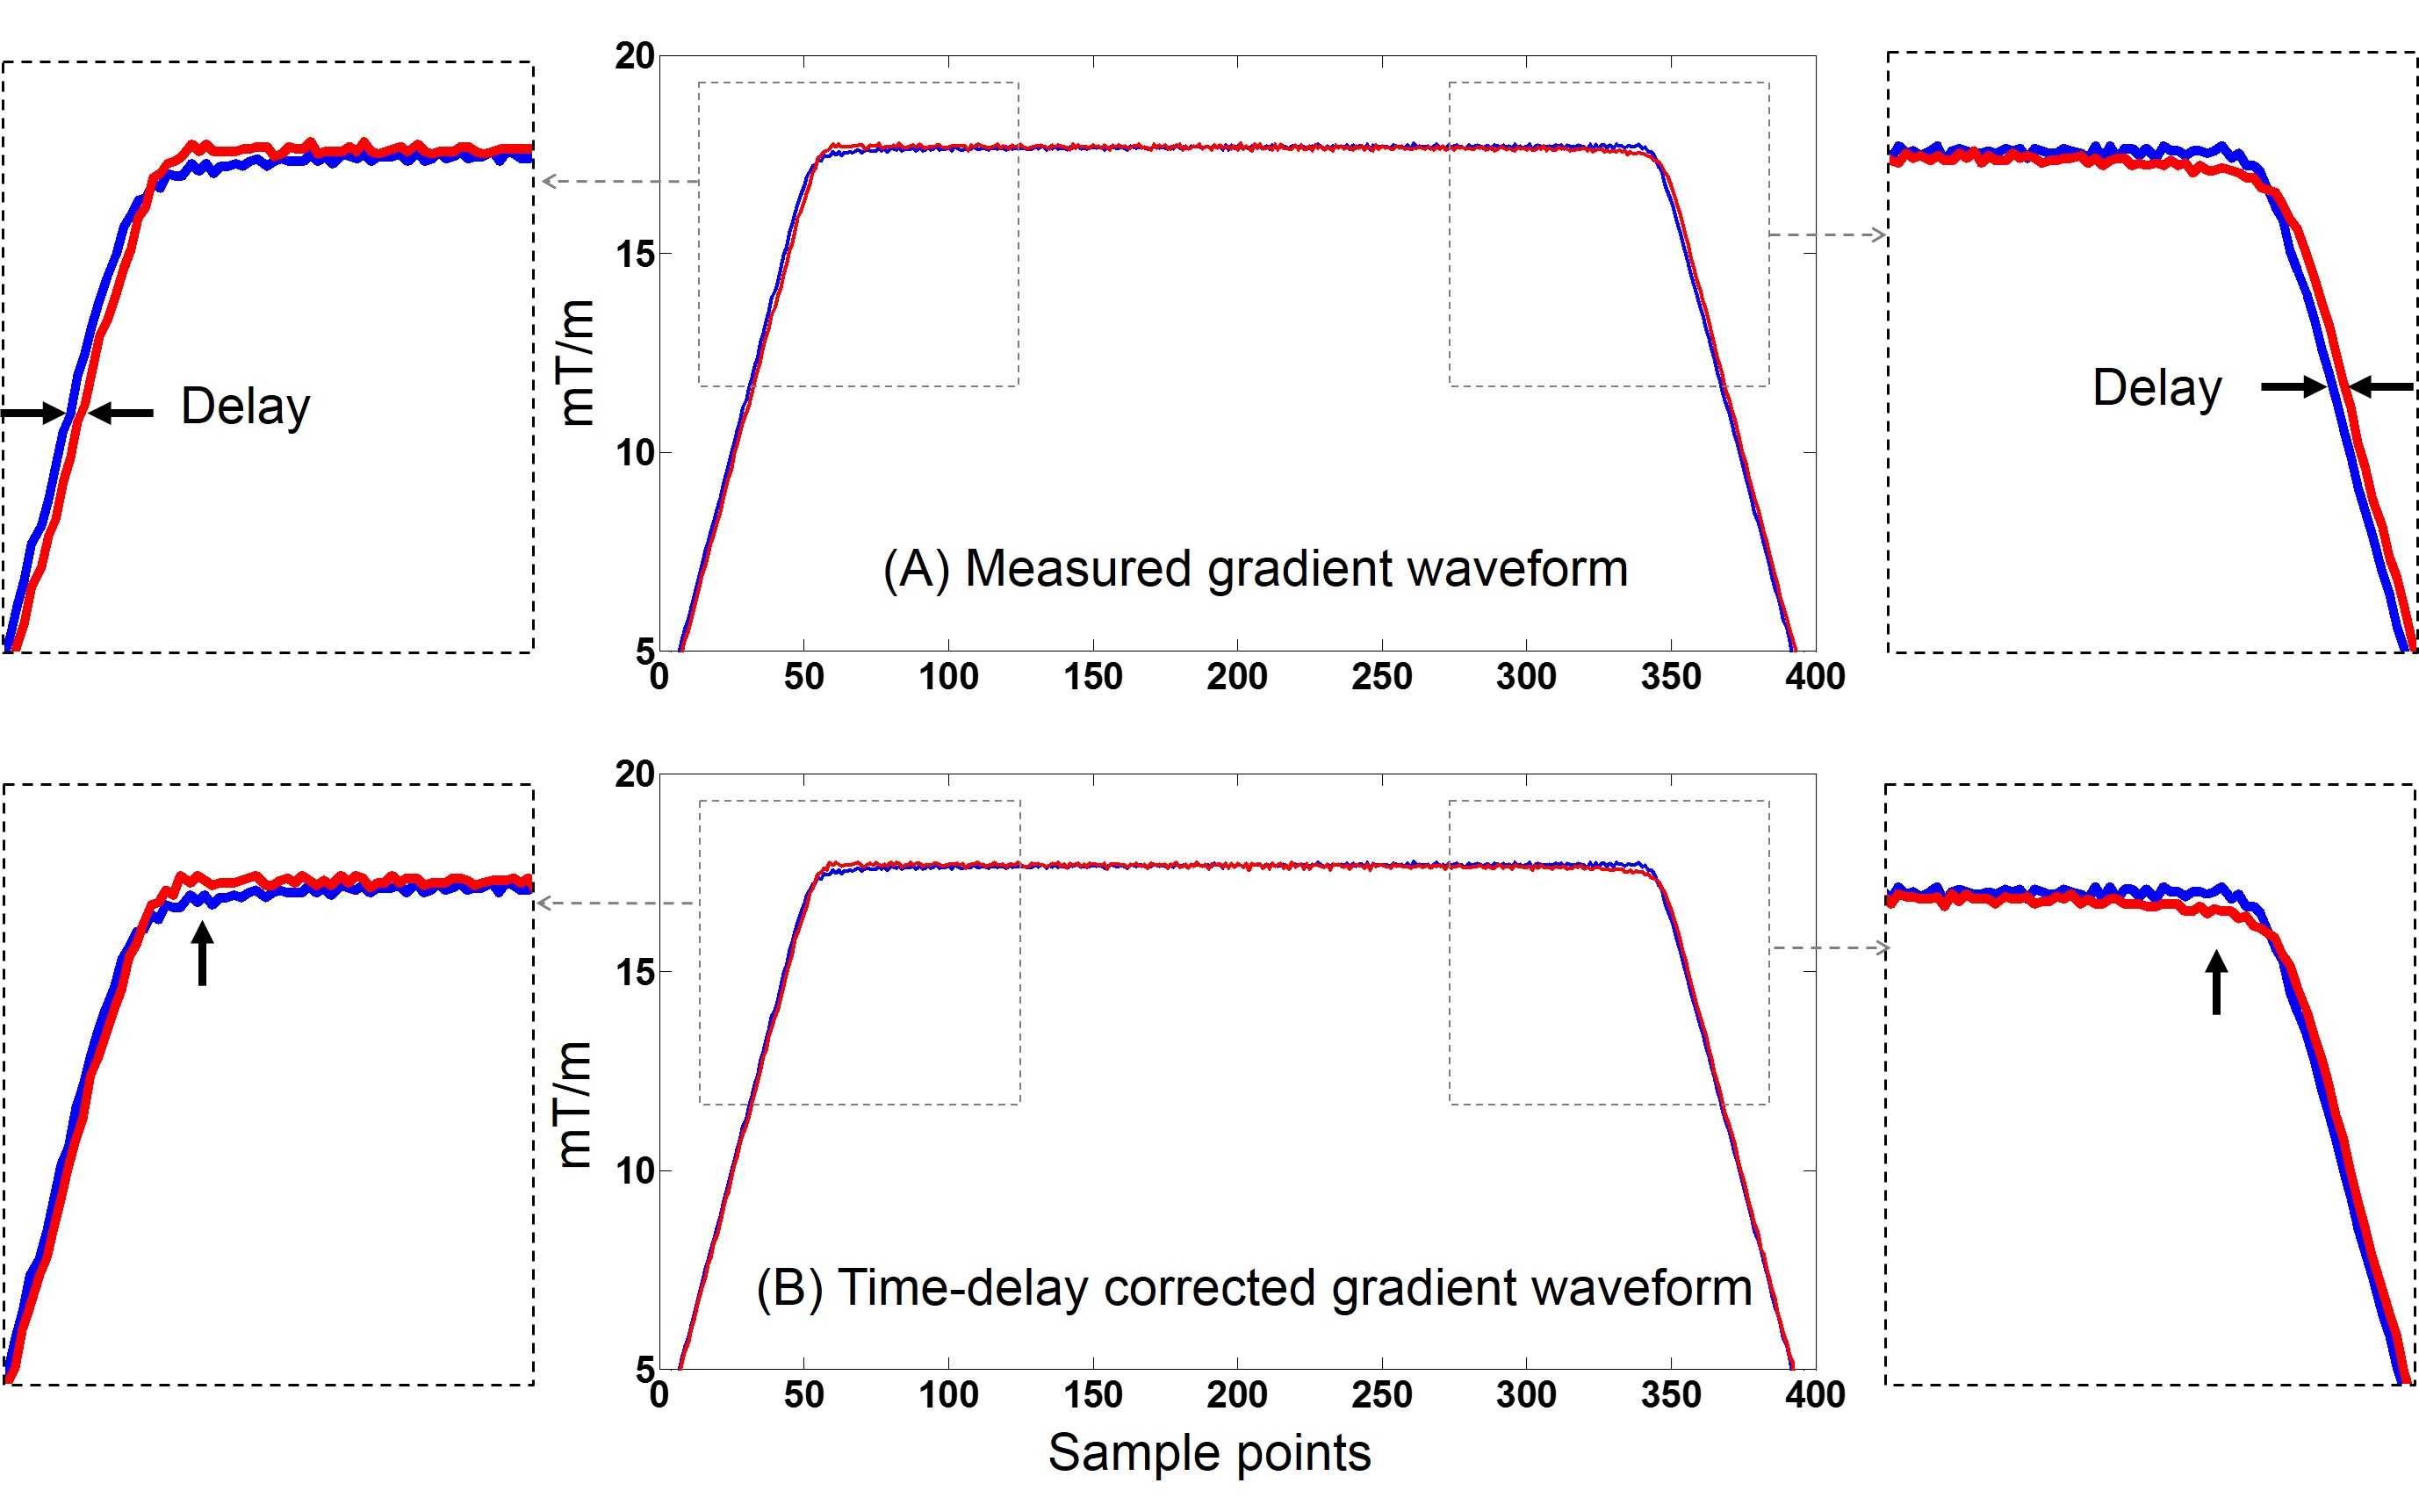
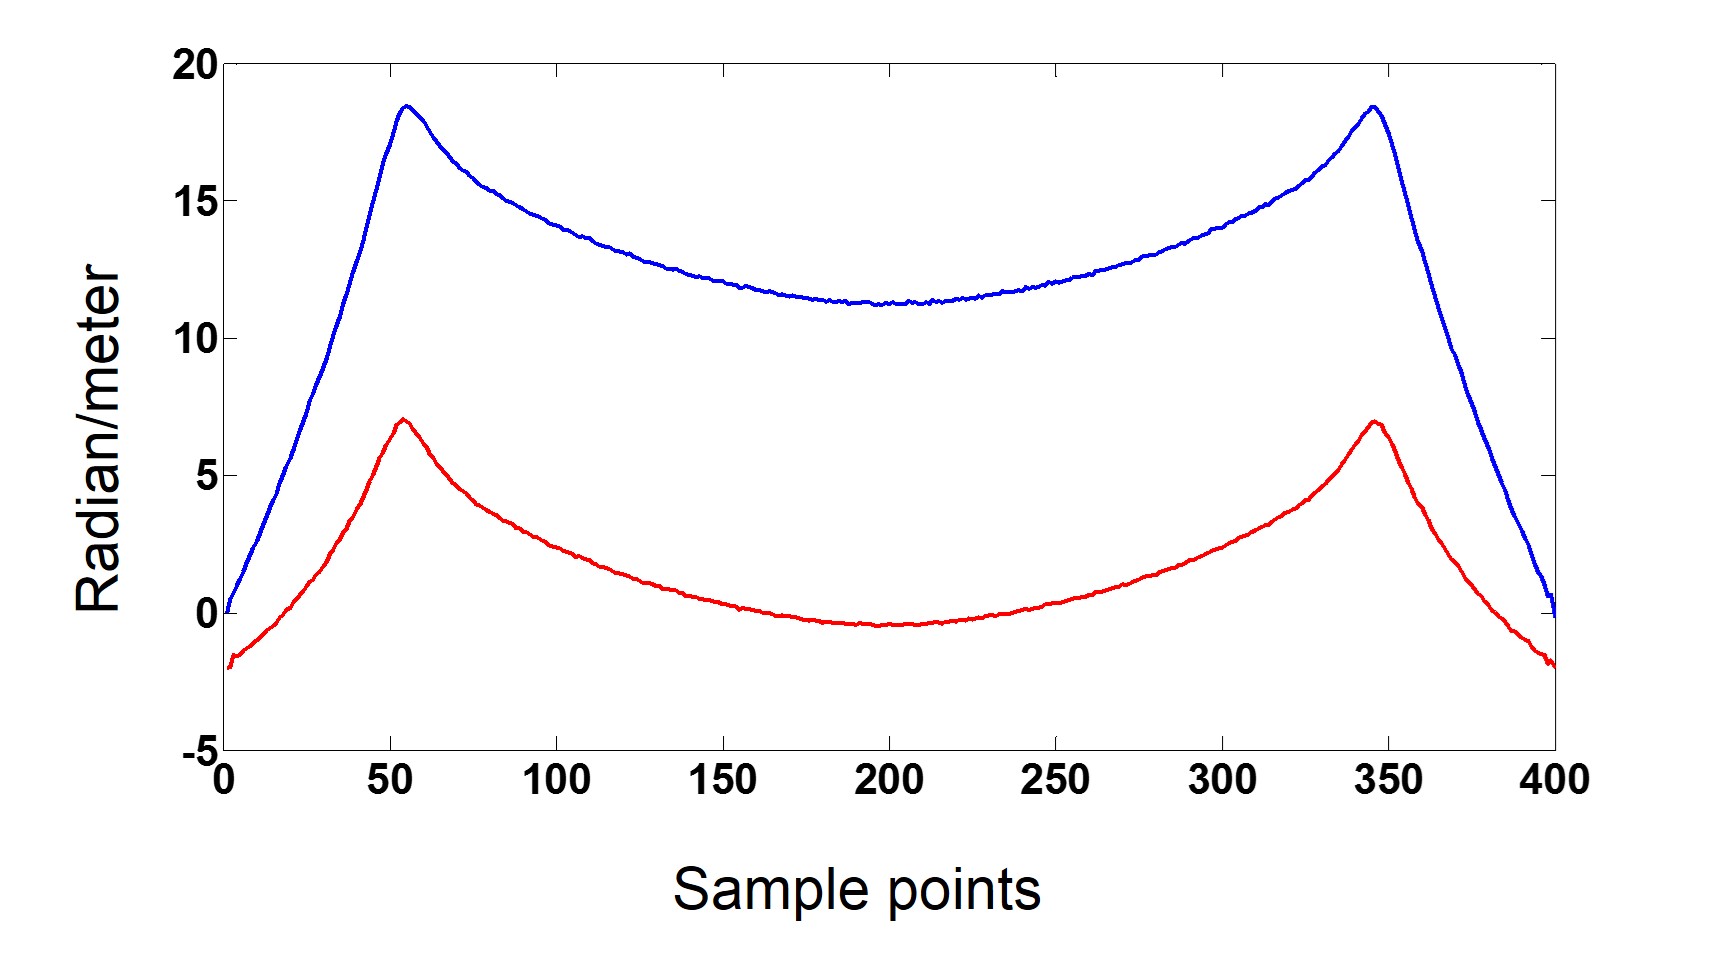
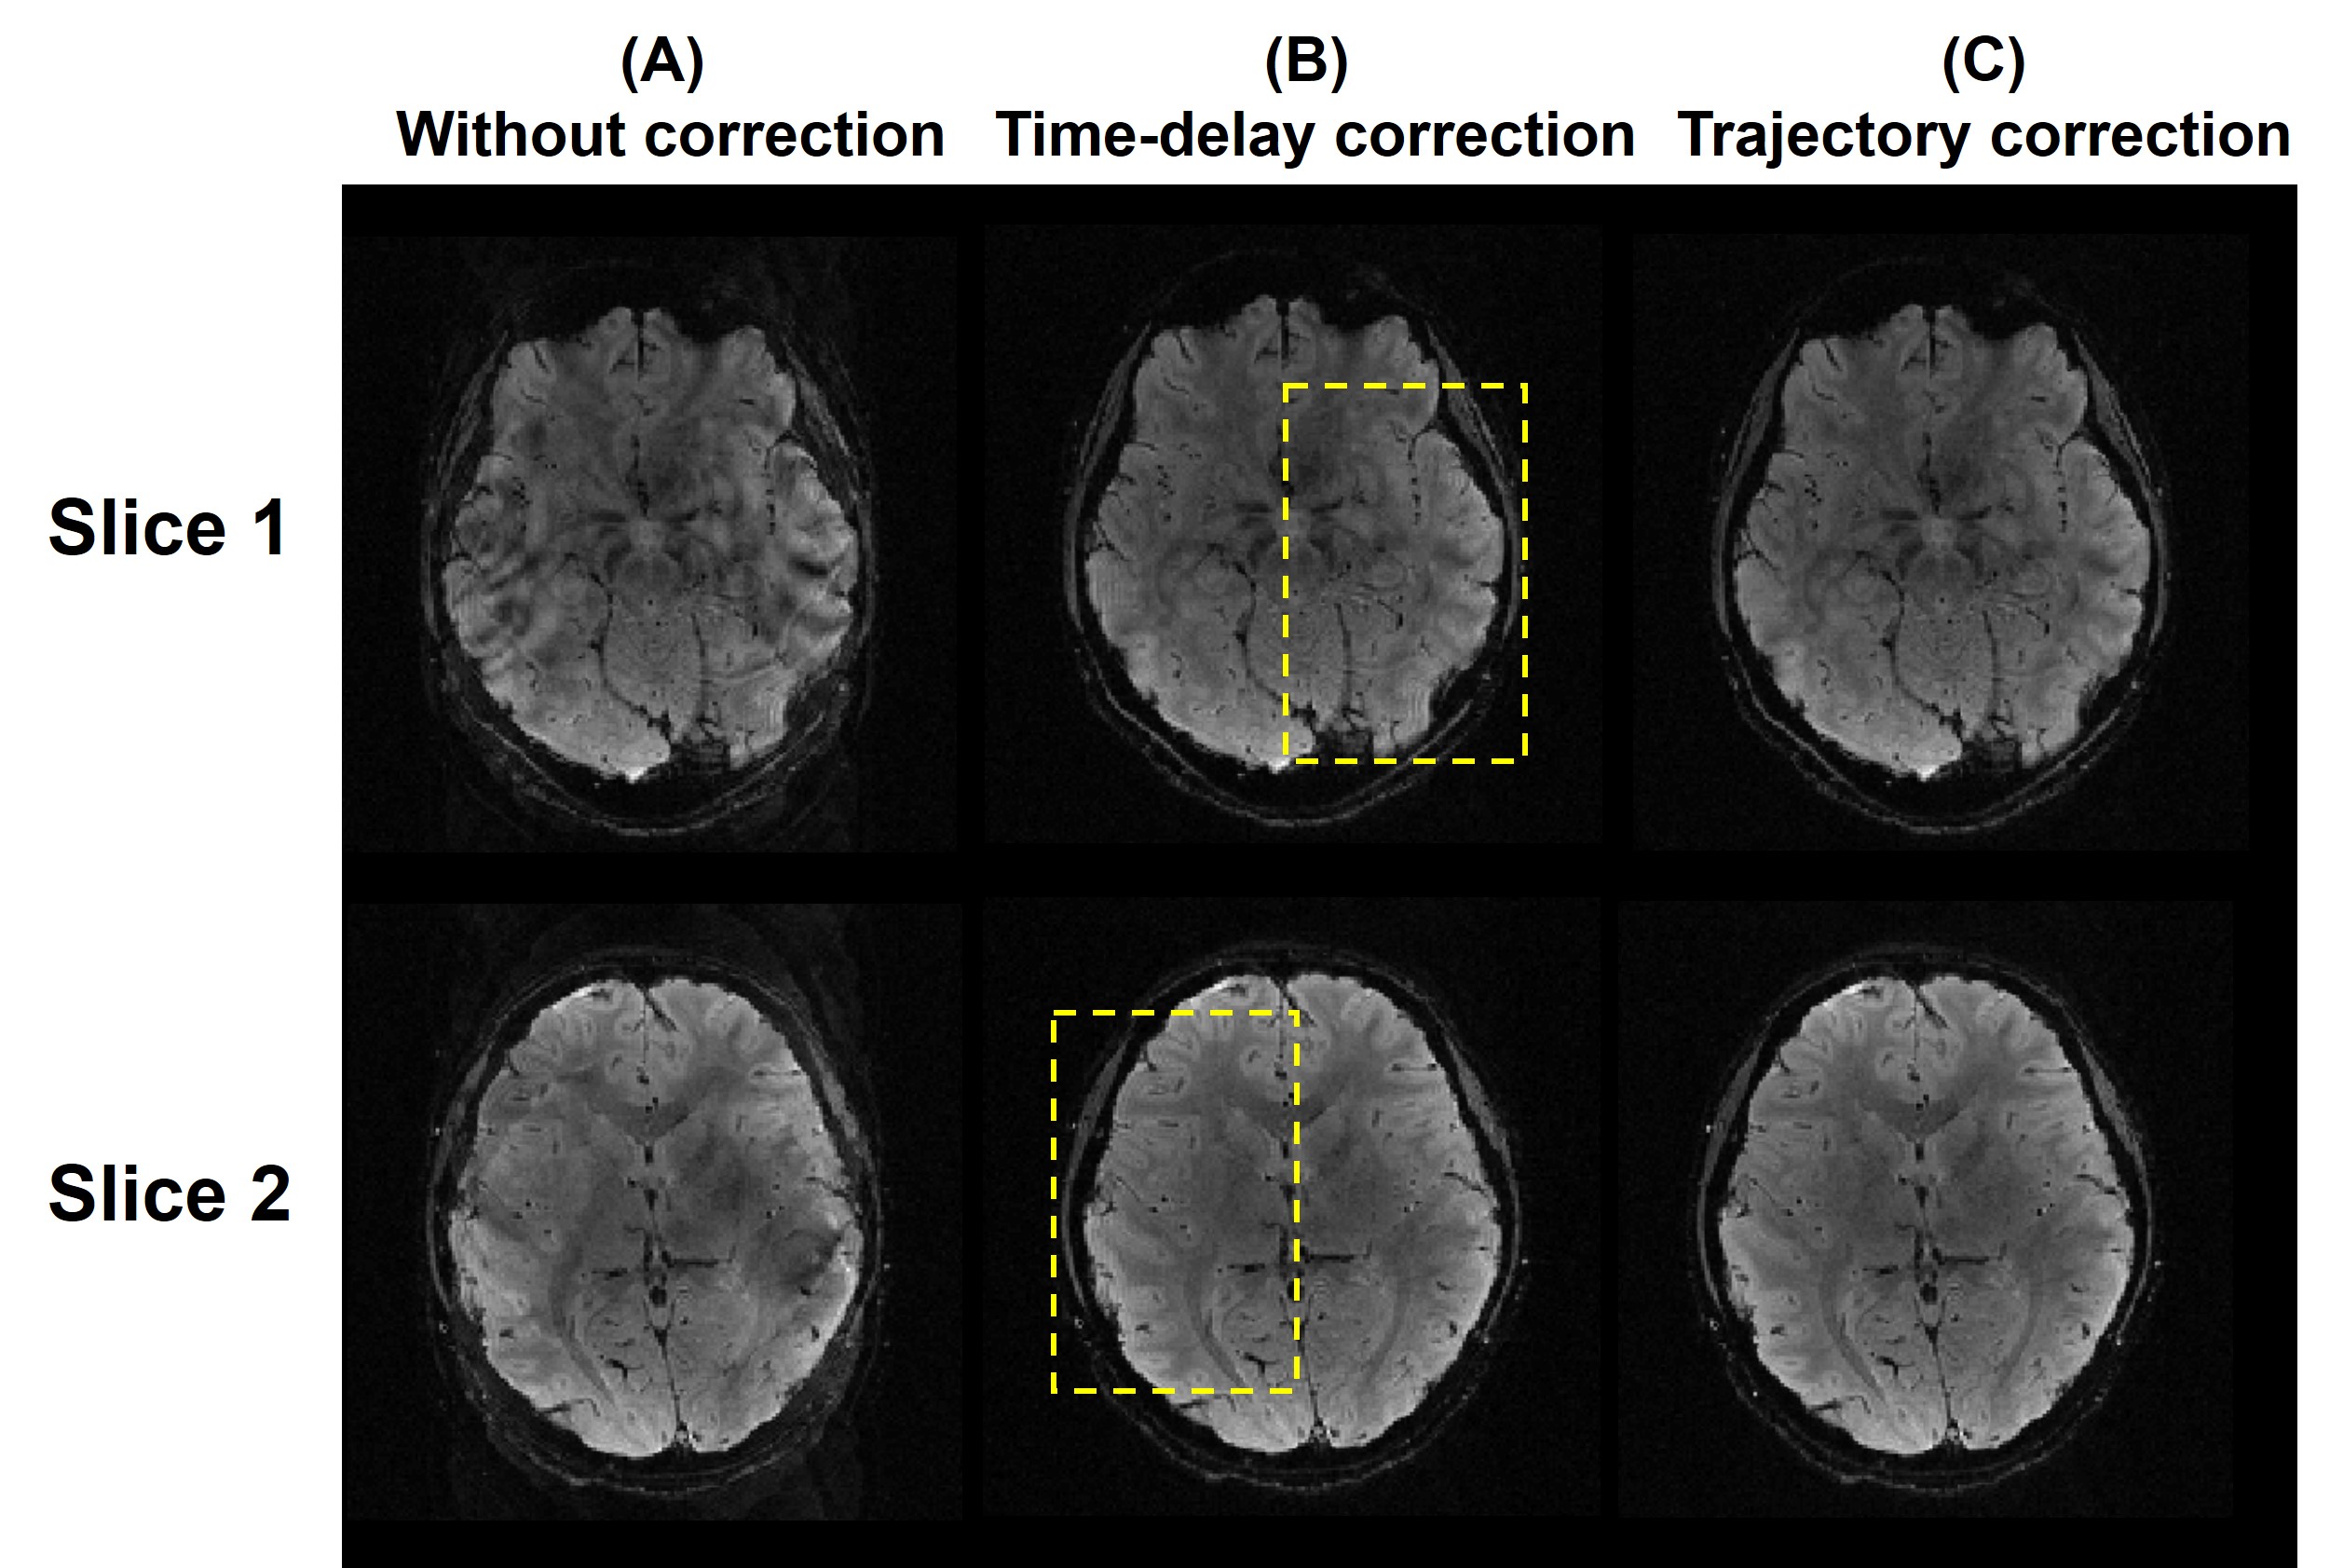
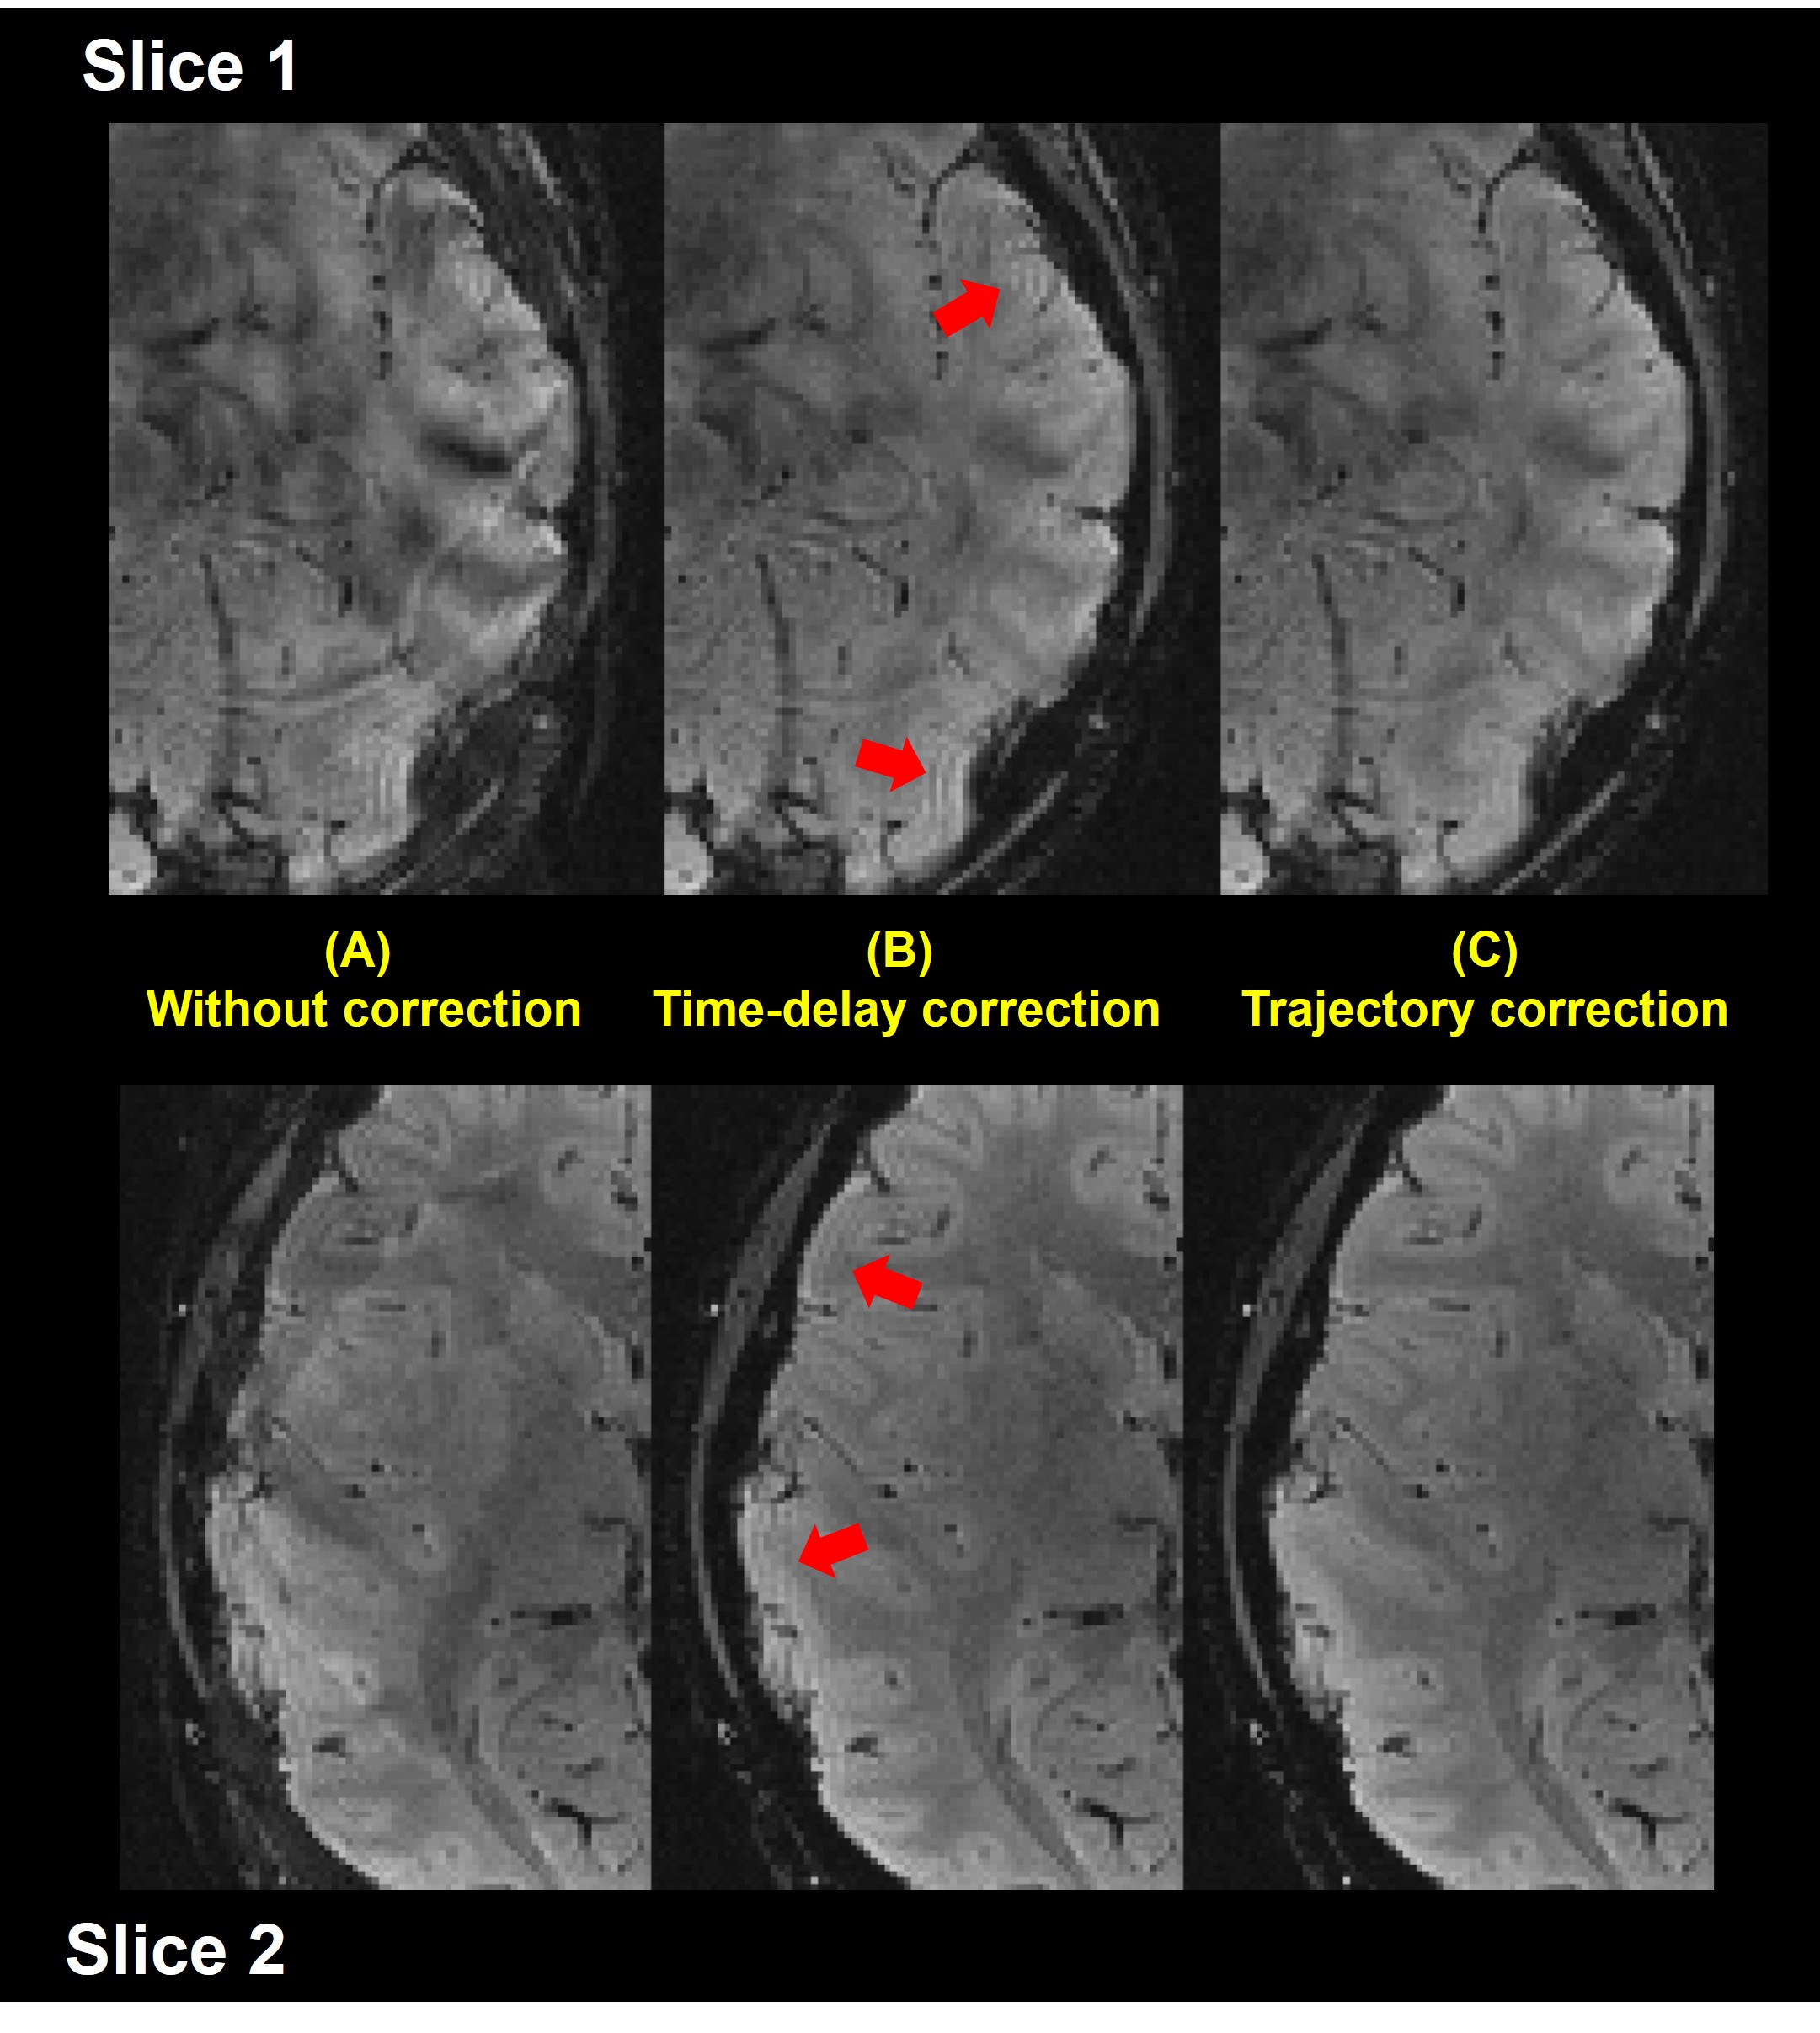
Figure 1A shows the measured readout gradient waveform of an odd (blue) and an even (red) k-space line. In addition to the time delay between these two lines, the gradient waveform was found distorted by the eddy current. Figure 1B shows the gradient waveforms before and after time delay correction. The odd gradient leads at the beginning to compensate suppressed gradient strength after ramping up. Figure 2 shows the difference between the k-space frequency encoding coordinates of odd and even lines before any correction (blue). Along sampled data points over time, this difference started to accumulate and peaked after completing the ramping. Figure 2 shows the difference between the k-space frequency encoding coordinates of odd and even lines after time delay correction (red). While we observed a similar pattern, the difference at the center of sampled k-space data point was zero, suggesting a good correction. However, after time delay correction, the maximal difference was only reduced to 40% (18.5$$$\rightarrow$$$7.1). Figure 3 and 4 shows two axial slices of brain images without any correction, with time delay correction, and with trajectory correction. Without any correction, the images show serious patchy and banding artifacts. After time delay correction, the image artifacts were mostly reduced with still clear streaking artifacts near the peripheral brain region (red arrow). After trajectory correction, there was no visible artifact.Discussion
Our results suggested that the time delay correction of EPI may not be enough to achieve high-quality images. Instead of using field probes, exciting thin slices along the frequency encoding direction to monitor readout gradient could be sufficient for trajectory measurement5. This calibration can be done quickly at the beginning of image acquisition. For high-resolution quantitative imaging using EPI, such as quantitative susceptibility mapping6, even weak image artifacts may result in a substantial bias in the estimation. We expect that the trajectory correction method can potentially reduce this error. We found that time delay correction depends on different MRI systems: the maximal difference in the k-space between odd and even lines after time delay correction was about 1.5 radians/m (Prisma, Siemens), which was smaller than results on another system (Skyra, Siemens, Figure 2, 7.1 radians/m).Acknowledgements
This work was partially supported by Ministry of Science and Technology, Taiwan (103-2628-B-002-002-MY3, 105-2221-E-002-104), and the Academy of Finland (No. 298131).References
1. Reeder, S.B., et al., Quantification and reduction of ghosting artifacts in interleaved echo-planar imaging. Magnetic resonance in medicine, 1997. 38(3): p. 429-439.
2. Addy, N.O., H.H. Wu, and D.G. Nishimura, Simple method for MR gradient system characterization and k-space trajectory estimation. Magnetic resonance in medicine, 2012. 68(1): p. 120-129.
3. Chu, Y., Y. Hsu, and F. Lin, Spiral imaging trajectory mapping using high density 25-channel field probe array. Proceedings of the 23th Annual Meeting of ISMRM, 2015: p. 1014.
4. Barmet, C., et al., A transmit/receive system for magnetic field monitoring of in vivo MRI. Magnetic resonance in medicine, 2009. 62(1): p. 269-276.
5. Duyn, J.H., et al., Simple correction method fork-space trajectory deviations in MRI. Journal of Magnetic Resonance, 1998. 132(1): p. 150-153.
6. Langkammer, C., et al., Fast quantitative susceptibility mapping using 3D EPI and total generalized variation. Neuroimage, 2015. 111: p. 622-630.
Figures