1385
Optimal spatial resolution for accuracy and precision in simulated and experimental micro-MRE at 11.7 T1Imagerie par Résonance Magnétique Médicale et Multi-Modalités, IR4M, CNRS, Univ. Paris-Sud, Université Paris-Saclay, Orsay, France, 2Centre de Recherche sur l’Inflammation, CRI, Inserm, CNRS, Univ. Pierre et Marie Curie, Paris, France, 3Unité d’Imagerie par Résonance Magnétique et Spectroscopie, NeuroSpin, I2BM, DRF, CEA, Gif Sur Yvette, France, 4Imagerie Moléculaire In Vivo, IMIV, Inserm, CEA, CNRS, Univ. Paris-Sud, Université Paris-Saclay, Orsay, France
Synopsis
MRE outcomes depend on various factors, which include SNR, spatial resolution, mechanical frequency, induced shear wave amplitude, and reconstruction method. It was formerly shown in a simulation study that 7 to 10 voxels were needed to properly resolve the shear wavelength, λref, and both accurately and precisely quantify the mechanical properties of the targeted tissue by inversion of the equation of motion. The purpose here is to experimentally reproduce the conditions defined by the simulation to determine the actual influence of the acquisition voxel size, a, on MRE acquisitions and validate the predicted λref/a conditions for optimal MRE reconstruction.
Introduction
Magnetic Resonance Elastography (MRE) is a phase-contrast-based MRI technique that can map propagating acoustic strain waves in tissue subjected to harmonic mechanical excitations and yields quantitative measurement of the underlying mechanical properties [1]. Yet, different viscoelastic moduli have been recorded in the same tissues by different research teams. MRE outcomes depend on various factors, which include the SNR, the spatial resolution, the mechanical frequency, the induced shear wave amplitude, and the reconstruction method. It was formerly shown in a simulation study that 7 to 10 voxels were needed to properly resolve the shear wavelength, λ, and both accurately and precisely quantify the mechanical properties of the targeted tissue by inversion of the equation of motion [2]. The purpose here is to experimentally reproduce the conditions defined by the simulation to determine the actual influence of the acquisition voxel size, a, on MRE acquisitions and validate the predicted λref/a conditions for optimal MRE reconstruction.Materials and methods
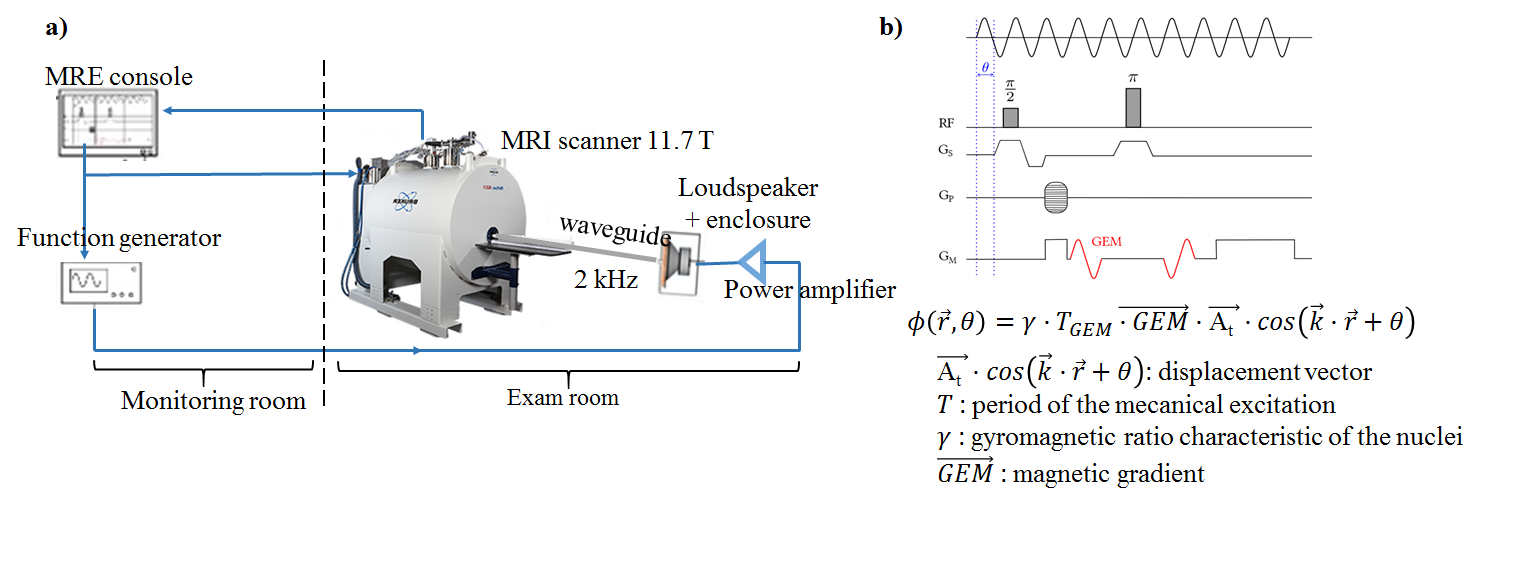
Simulations were carried out for a 2 kHz point source based on elastic Green function assuming an isotropic, homogeneous and quasi-half-space model where shear wave propagated at Vr=2.68 m·s-1, hence λ=1.34 mm, with total displacement field amplitude lower than 0.5 µm and experimental SNR [4]. Point source excitation at 2 kHz, reflection- and interference-free wave propagation, 300 µm3, 200 µm3 and 150 µm3 isotropic voxels were implemented at 11.7 T (Bruker, Germany) on a (20 mm diameter-5 mm height) homogenous cylindrical polyvinyl alcohol phantom (PVA= 7%) in a volume circularly-polarized MRI transceiver coil (Figure 1a). MRE data was acquired with an interleaved multi-slice spin-echo pulse sequence, sensitized to motion by 44 cycles of sinusoidal gradients at 452 mT/m, and synchronized with the mechanical excitation induced in the PVA by guided pressure waves at 2 kHz (Figure 1b). For the given FOV=(21×21×6) mm3 and a={300, 200, 150} µm, the acquisition matrices respectively were {(70×70×20), (105×105×30), (140×140×40)}, TR={790, 1185, 1580} ms, and TE={28.5, 30, 32} ms. The MR signal was averaged over {1, 12, 64} times to maintain similar SNR over a. The 3D displacement field was acquired at four time points over the mechanical wave cycle. Experimental mean SNR over the phantom were used for simulations. To extract and compare both simulated and recorded shear velocities, data were processed [3] and masked around the experimental mean <SNRexp>(1±10%) and total field displacement amplitude <Atexp>(1±10%).Results
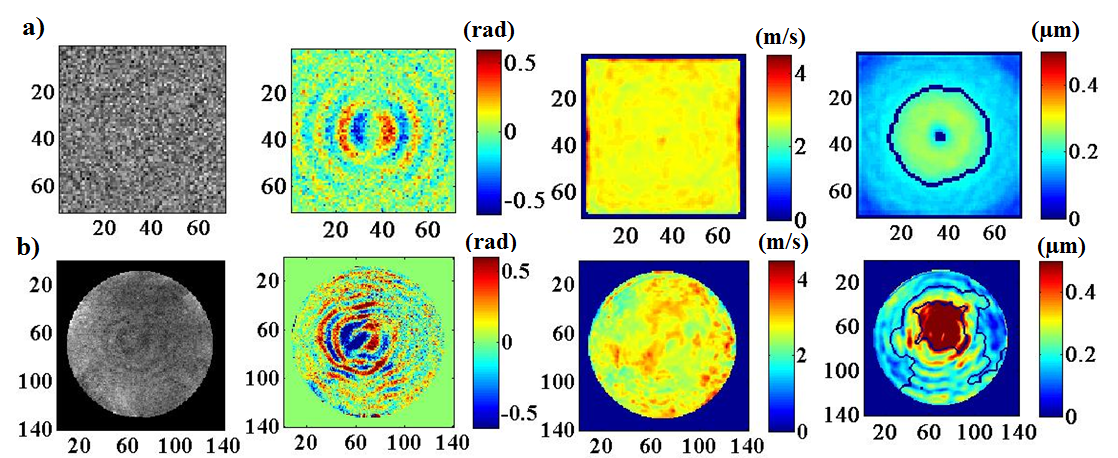
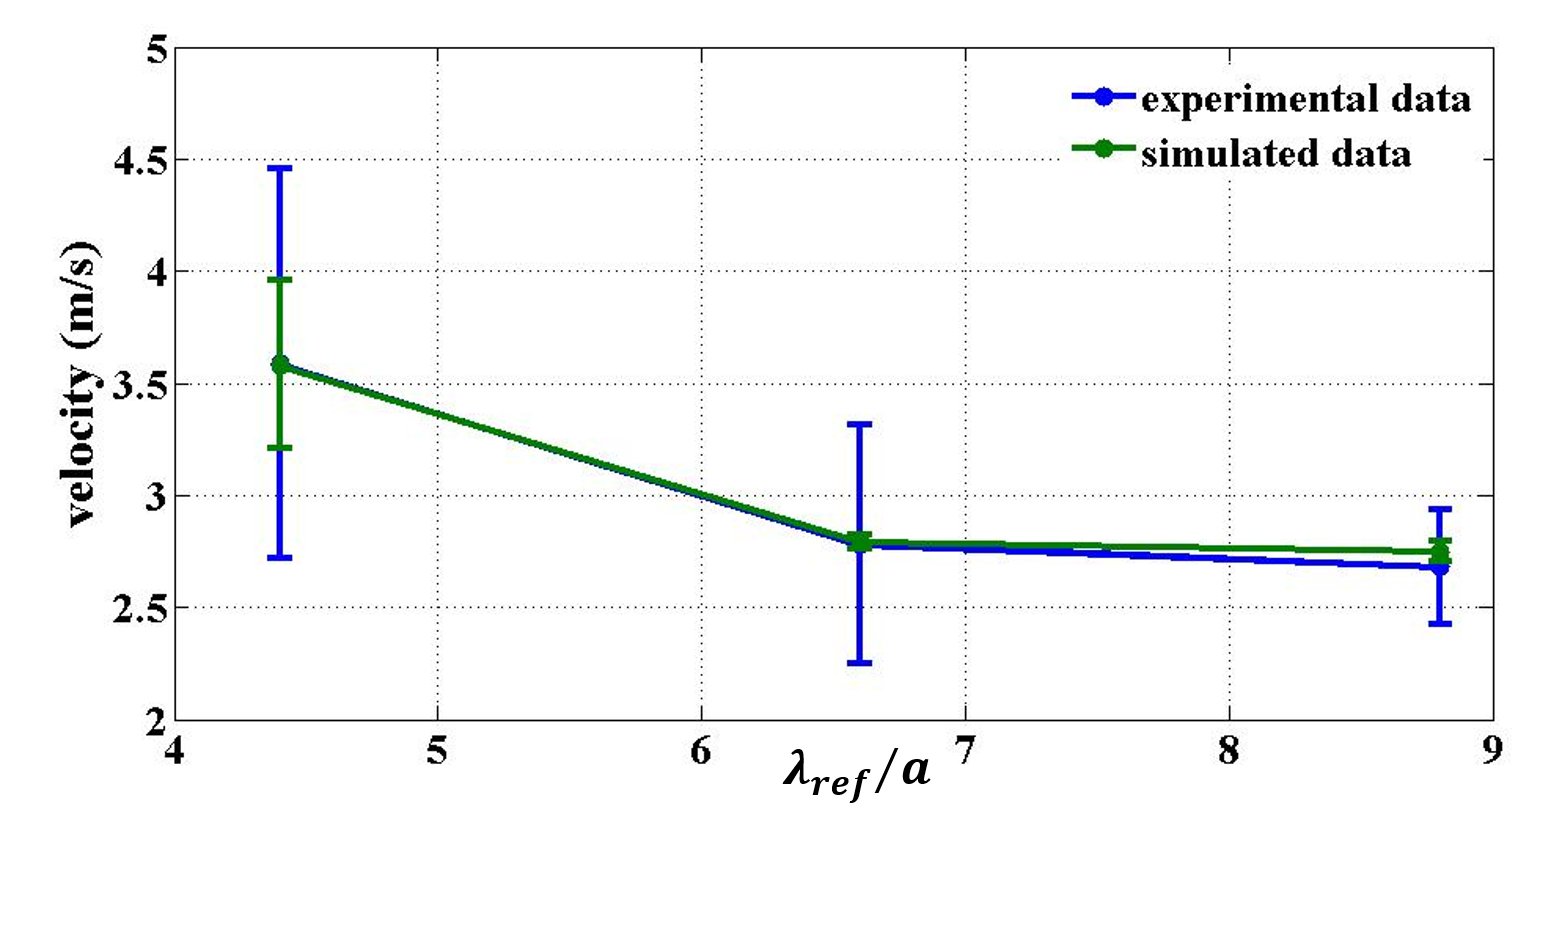
Simulated and acquired magnitude and phase images are shown for a=150 µm on Figure 2. Over the phantom, for a={300, 200, 150} µm, experimental <SNRexp>={3.47, 7.33, 8.67} and <Atexp>={0.39, 0.46, 0.26} µm. Over the masks (Figure 2 for a=150 µm), <Vsim>={3.58±0.38, 2.79±0.032, 2.75±0.05} m·s-1 and <Vexp>={3.59±0.87, 2.78±0.53, 2.68±0.26} m·s-1. The mean and standard deviation of the simulated and experimental shear velocities are plotted with respect to λref/a on Figure 3.Discussion and Conclusion
Mean and standard deviation of the simulated shear velocity follow the expected trend with λref /a. Mean experimental shear velocity faithfully agrees with the simulated data as it reduces with λref/a towards the expected reference value Vr=2.68 m·s-1. The corresponding standard deviation becomes minimal when approaching the optimal conditions on λref/a (for a<200 µm). From a=300 µm to a=150 µm, the reconstruction accuracy is improved by 30% and, the precision, by a factor 3. The simulated shear velocity standard deviations are smaller than the experimental ones as the effective ROIs for the simulated data turned out to be 10-fold smaller. For both simulation and experiment, the conditions for optimally precise and accurate MRE are fulfilled at 2 kHz in a 7% PVA phantom for a=150 µm. Adapting the experimental spatial resolution to the expected wavelength is critical for quantitative MRE.Acknowledgements
MRE experiments were performed on the 11.7 T preclinical MRI platform of CEA/NeuroSpin, affiliated to the France Life Imaging network (grant ANR-11-INBS-0006).References
1. Muthupillai et al. Magnetic Resonance Elastography by Direct Visualisation of Propagating Acoustic Strain Waves. Science 1995, 269, 1854-1857
2.Yue et al. Discretization, accuracy, and precision in Magnetic Resonance Elastography reconstruction. ESMRMB 2016 Abstract-54
3.Sinkus et al. Viscoelastic shear properties of in vivo breast lesions measured by MR elastography MRM 2005, 23 : 159-165
4. Aki and Richards. Quantitative Seismology 2002, 85-97.
Figures