1384
Magnetic Resonance Elastography based on Finite Deformation Imaging and Topology OptimizationLuyao Cai1, Claus Pedersen2, and Corey Neu1,3
1Biomedical Engineering, Purdue University, West Lafayette, IN, United States, 2Dassault Systèmes, Germany, 3Mechanical Engineering, University of Colorado Boulder, CO, United States
Synopsis
We developed an inverse modeling approach for magnetic resonance elastography of tissues undergoing finite (large) deformations at physiologically-relevant loading rates. Inverse modeling was designed to directly incorporate displacement-encoded MRI with topology optimization to reveal stiffness distributions. The approach was validated using forward simulations with known material properties and boundary conditions, and sensitivity analyses. Inverse modeling may enable noninvasive characterization of material stiffness for complex tissues like articular cartilage in disease and repair.
PURPOSE
The stiffness of articular cartilage is known to decrease in the pathogenesis of osteoarthritis [1], suggesting that the nondestructive measurement of stiffness in vivo may be an important imaging biomarker of disease [2-3]. Traditional magnetic resonance elastography (MRE) can be used to estimate the stiffness of soft tissues under high frequency loading, however, the large dissipation of waves in human body, especially in stiff cartilage, restricts MRE to ex vivo applications [4-5]. To avoid these limitations, we aimed to develop and validate an inverse modeling workflow that combined displacement-encoded MRI [2], to directly measure intratissue deformation, with topology optimization, in the application of heterogeneous (layered) materials representative of the complex gradient architecture of articular cartilage [3].METHODS
In the present study, topology optimization, which is typically usually used to design stiff, durable, and light-weight structures, was applied to determine the stiffness distribution of layered agarose (hydrogel) materials as a model for articular cartilage. We modified traditional topology optimizations to minimize the maximum absolute difference of the displacement between simulation and experimental measurements. Generally, the workflow was solved using finite element method software (Abaqus) and optimization software Tosca (Dassault Systèmes), to iteratively update the stiffness of each element representing the material. To validate our workflow, displacement-encoded MRI was used to measure internal displacements and strain within layered agarose gels to establish baseline deformation and noise levels commonly observed in small materials or explanted tissues [6]. Briefly, finite displacements were determined using dualMRI [2] under cyclic compressive loading (0.23 Hz, 0.67N) with a DENSE-FISP imaging sequence on both 7T and 14.1T MRI systems (Bruker). Separately, a forward simulation of a bi-layer cylindrical model was created (top layer: E=1000Pa, n=0.3; bottom layer: E=500Pa, n=0.3), such that displacement patterns calculated were consistent with MRI data. With the bottom edge of the model fully constrained, the top edge was indented to 15% of the thickness, and resulting displacements were calculated, assuming linear elasticity constitutive relations[CN1] . Inverse modeling was accomplished using linear elastic and plane stress assumption (Figure 1). The workflow bias and precision was evaluated using Monte Carlo simulations. The pixel number, model dimensions, and data noise (standard deviation = 0.1mm), were set according to displacement-encoded MRI data [6]. Simulations were repeated 100 times, and bias and precision were calculated as the root mean square error and pooled standard deviation, respectively, of each element [7]. The sensitivity of all numerous factors (e.g. 2D assumptions, boundary conditions) involved in the workflow were evaluated using Cotter’s method [8]. [CN1]Please check thisRESULTS
Our inverse modeling approach restored original stiffness patterns from forward simulations (Figure 1). Monte Carlo simulations identified the stiffness ratio between top/bottoms material layers to be 2.019, which was very close to the known value of 2.0 (Figure 2). The bias and precision were 0.092 and 0.066, respectively. The sensitivity analysis identified the 2D assumption as the most important factor, which indicated the deficiency of the 2D assumption and the importance of the out-of-plane strains measurements (Table 1). The inverse modeling was also sensitive to boundary geometries and smoothing process.DISCUSSION
The purpose of this study was to define a workflow to enable inverse modeling-based stiffness calculations that take advantage of displacement-encoded MRI data. Our inverse modeling approach produced a distinctive bilayer configuration of stiffness ratio 2:1 between two material layers, which was robust to noise. Some systemetic bias persisted (Figure 2D), especially near material interfaces and edges. The interface bias could be due to the smoothing process and regularization constraints that could blur out the gradient. We were surprised that 2D assumptions in the sensitivity analysis revealed the greatest differences, and indicated that it is important to describe the out-of-plane displacement instead of using geometric simplifications of plane stress or strain. Three-dimensional MRI acquisitions would therefore be helpful to solve this problem. In addition, further signal averaging is advisable for displacement-encoded MRI to reduce the noise.CONCLUSION
In summary, our inverse modeling workflow, which was built on displacement-encoded MRI, can provide a more intuitive result of the stiffness distribution inside the tissue during conditions of large deformation and physiologically-relevant (e.g. low frequency) loading. The nondestructive nature of image acquisition, combined with the versatility of topology optimization, potentially allow for broad application of this method. For articular cartilage, inverse modeling may be useful to analyze softening observed in osteoarthritis or provide a unique imaging biomarker for tissue repair.Acknowledgements
The authors would like to acknowledge funding from NIH R01 AR063712 and NSF CAREER 1349735.References
1. Waldstein, Wenzel, et al. OARSI osteoarthritis cartilage histopathology assessment system: a biomechanical evaluation in the human knee. Journal of Orthopaedic Research 2016;34(1):135-140.[CN1] 2. Chan, Deva D., et al. In vivo articular cartilage deformation: noninvasive quantification of intratissue strain during joint contact in the human knee. Scientific reports 2016;6. 3. Neu, Corey P. Functional imaging in OA: role of imaging in the evaluation of tissue biomechanics. Osteoarthritis and Cartilage 2014;22.10: 1349-1359. 4. Hardy, Peter A., et al. Imaging articular cartilage under compression—cartilage elastography. Magnetic resonance in medicine 2005;53.5: 1065-1073. 5. Lopez, Orlando, et al. Developments in dynamic MR elastography for in vitro biomechanical assessment of hyaline cartilage under high-frequency cyclical shear. Journal of Magnetic Resonance Imaging 2007;25.2: 310-320. 6. Griebel, A. J., et al. Direct noninvasive measurement and numerical modeling of depth-dependent strains in layered agarose constructs. Journal of biomechanics 2014;47.9: 2149-2156. 7. Chan, Deva D., David Toribio, and Corey P. Neu. Displacement smoothing for the precise MRI-based measurement of strain in soft biological tissues. Computer methods in biomechanics and biomedical engineering 2013;16.8: 852-860. 8. Cotter, Sarah C. A screening design for factorial experiments with interactions. Biometrika 1979;66.2: 317-320. [CN1]Please format the rest of the references like this one—please pay careful attention to the formatting details.Figures
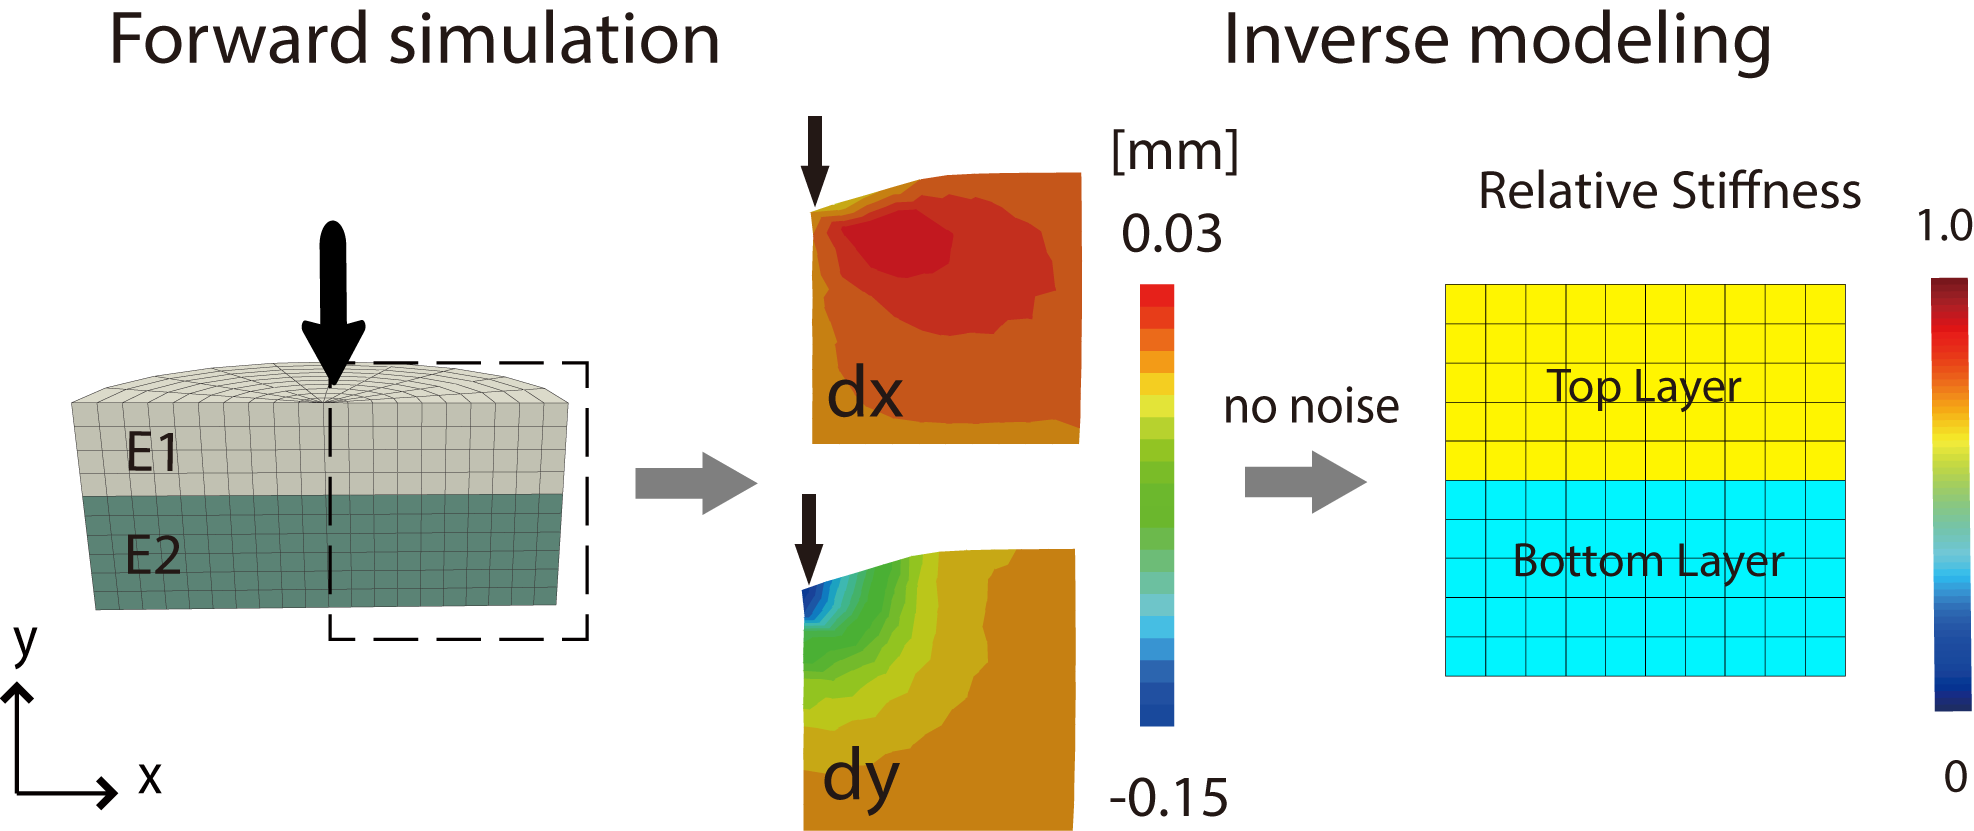
Figure 1.
Workflow for inverse modeling utilizing displacement-encoded MRI, finite
elements, and topology optimization. The displacement data from forward
simulation of a two layer cylinder (with E1:E2=2:1), with no noise added,
restored the relative stiffness to known values.
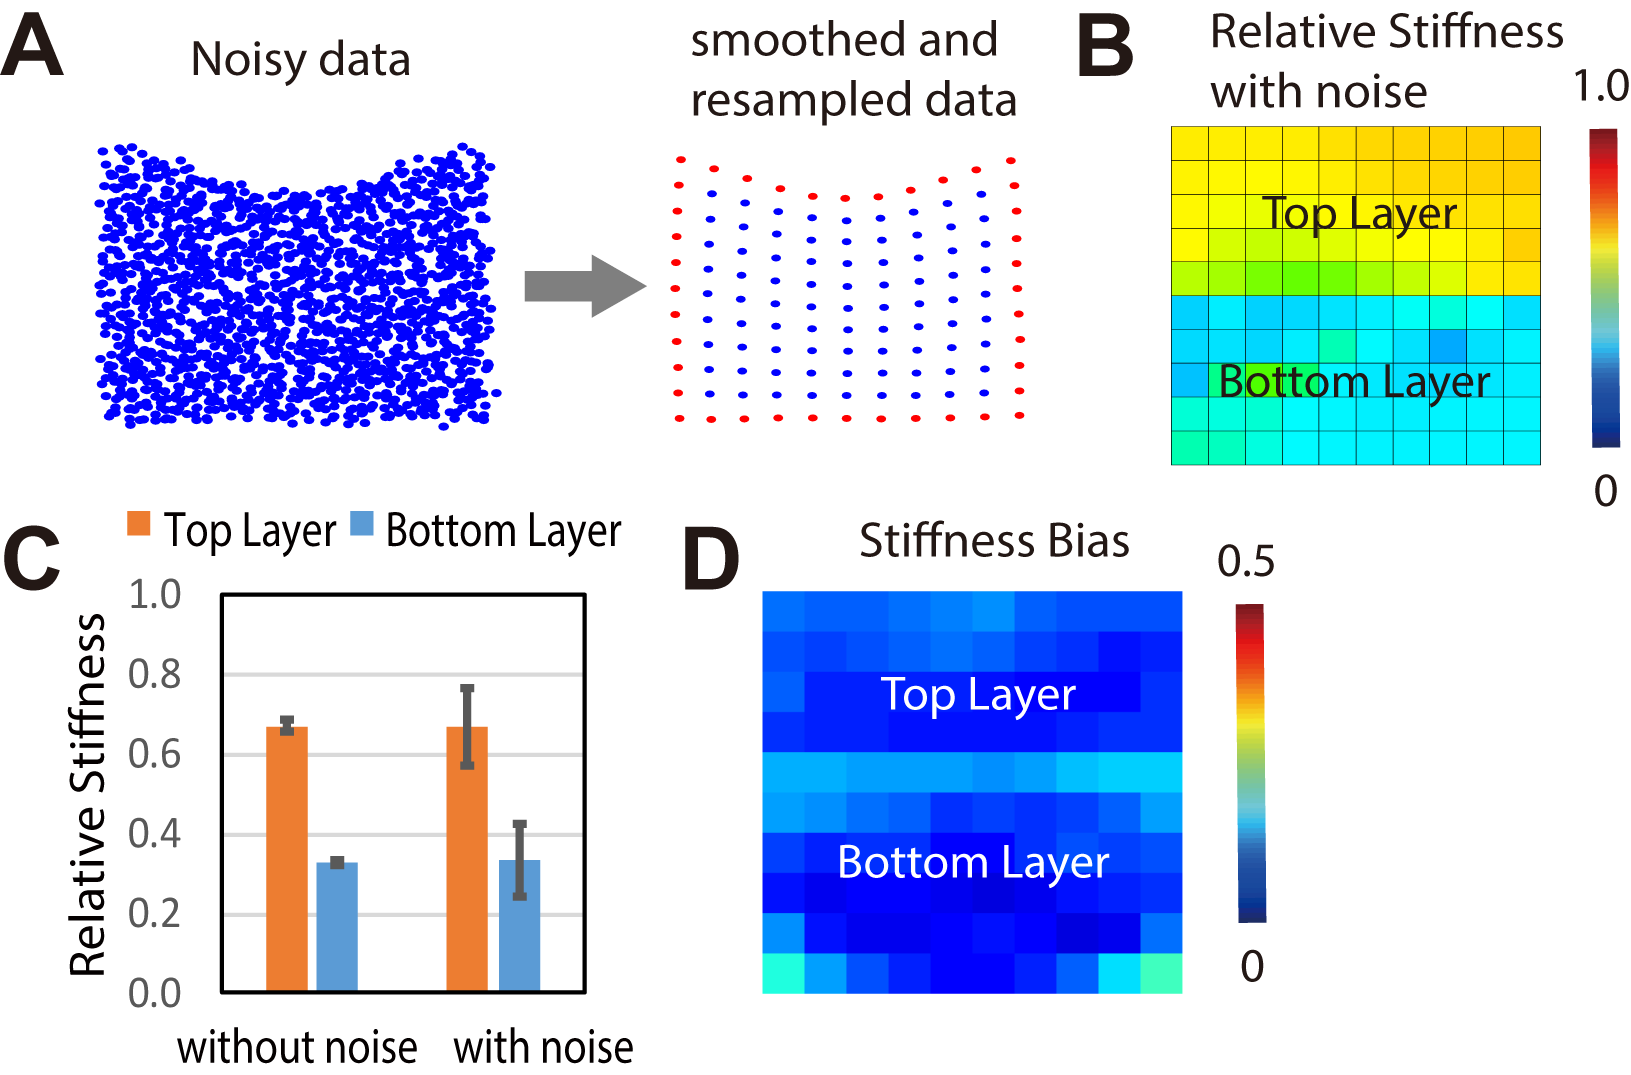
Figure 2.
Noise typical of displacement-encoded MRI data [6] introduces heterogeneity in
stiffness distributions, but regional patterns are robust to noise. (A) Ideal
data with added noise was smoothed and resampled. (B) Relative stiffnes with
and without noise (with ideal E1:E2=2:1) was calculated. Monte Carlo
simulations were completed with random noise generated 100 times. The mean stiffness
value of each layer was presented (C) and the stiffness bias of each element
was plotted (D).
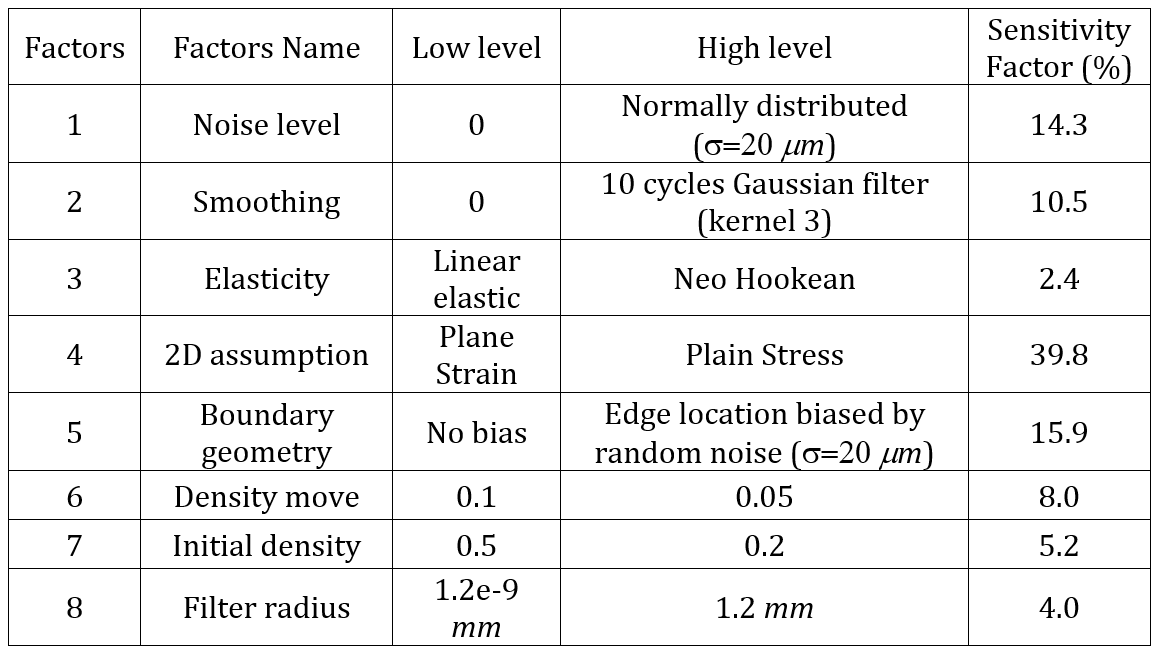
Table 1. Factor
sensitivity calculated by Cotter’s method.