1379
Development and validation of spin-echo planar imaging (SE-EPI) based MR Elastography on 3T: A phantom and volunteer study1Philips, Cincinnati, OH, United States, 2Radiology, Cincinnati Children's Hospital Medical Center, Cincinnati, OH, United States, 3Philips, Cleveland, OH, United States
Synopsis
While MRE based on 2D gradient recalled echo (GRE) MRI is FDA approved at 1.5T, the utility of 2D GRE MRE in the liver at 3T is limited by susceptibility effects and relatively long echo times that results in less SNR. MRE performance, particularly at 3T, can be improved by developing a faster technique that is less sensitive to liver T2* effects. In this work, we describe the development of SE-EPI MRE and its validation with respect to 2D GRE MRE in phantoms and healthy volunteers.
Introduction
MR Elastography (MRE) allows noninvasive measurement of hepatic stiffness which correlates with histopathologic grading of fibrosis (ref 1-3). 2D gradient recalled echo (GRE) based MRE is the standard implementation for 1.5T MRI. However, GRE MRE is limited at 3T by susceptibility effects (T2*) which result in signal loss. Spin-echo echo-planar imaging (SE-EPI) is an alternative means of performing MRE that is less susceptible to signal loss and is faster with single shot EPI readout. In this work, we describe the development of an SE-EPI MRE pulse sequence at 3T and the validation of this sequence relative to a 2D GRE MRE technique on phantoms and in healthy volunteers.Materials and Methods
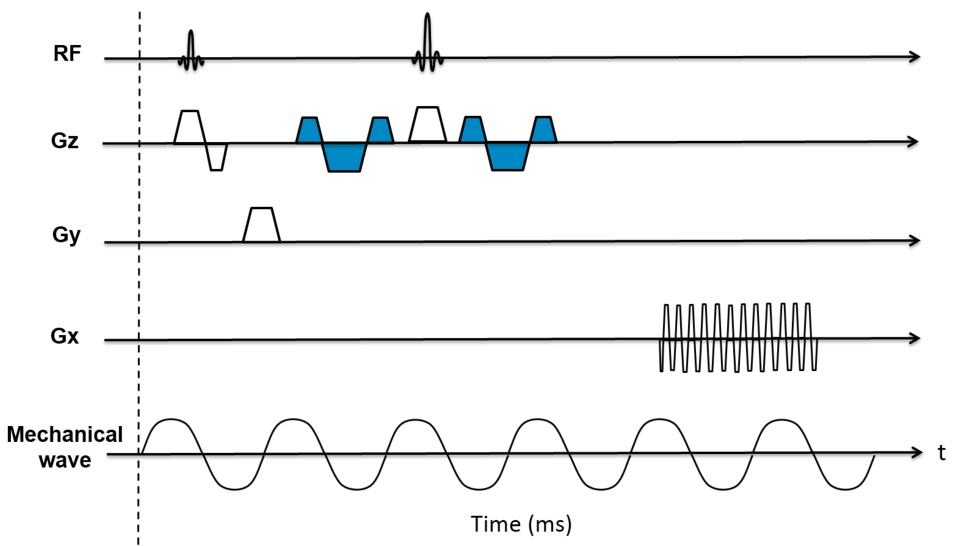
The SE-EPI MRE sequence was developed for use at 3T. Fig. 1 shows the pulse sequence diagram. A pair of Motion Encoding Gradients (MEG, 16.7ms and 18mT/m) were added on each side of the refocusing pulse of a modified phase contrast sequence. The polarity of the MEG is reversed every TR. Trigger pulses were produced by the pulse sequence to synchronize the active driver to the imaging sequence. Phantom studies and volunteer imaging were performed using both GRE and SE-EPI MRE on a Philips Ingenia 3T scanner (Best, Netherlands). GRE MRE scan parameters were as follows: TR=50ms; TE=22ms; FA=30°; acquisition matrix=256x64; 3 motion cycles per TR. SE-EPI MRE scan parameters were as follows: TR=1000ms; TE=58ms; FA=90°; acquisition matrix =64x64; 60 motion cycles per TR. Identical parameters for both sequences were: motion frequency=60 Hz; slice thickness=8mm, slice gap=2.5mm; SENSE factor=2. Phantom data was acquired using a gel phantom (Resoundant Inc., MI, USA) with an amplitude setting of 5% for the active driver for both the GRE and SE-EPI MRE sequences. Measurements were repeated 4 times on 4 slices and mean stiffness values were recorded. For human studies, 24 volunteers (19 female, 5 male; mean age 38.8 years; range 22.7-55.3 years) (6 hours fasting status) were recruited under an approved IRB protocol. Liver MRE scans were performed using the posterior and anterior coil array. GRE MRE was acquired in 4 breath holds of 15 seconds each, and SE-EPI MRE was acquired in a single breath hold of 19 seconds. Four axial slices through the liver were obtained for each sequence. MR elastograms were generated using a multimodal direct inversion (MMDI) algorithm (Mayo Clinic, Rochester, MN) with liver stiffness calculated as a mean of mean stiffness measured on each slice (kPa). The size of the reliable Region of interest (ROI) provided by the MMDI algorithm was recorded for volunteer data. Mean liver stiffness values between GRE and SE-EPI MRE were compared using paired t-tests and Bland-Altman difference plots. ROI size was compared with paired t-tests.
Results
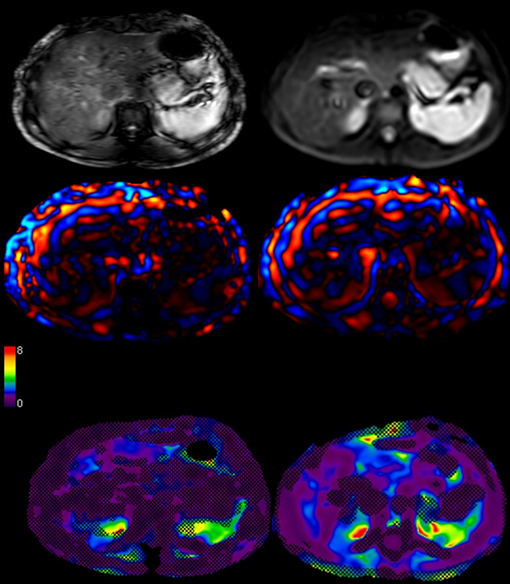
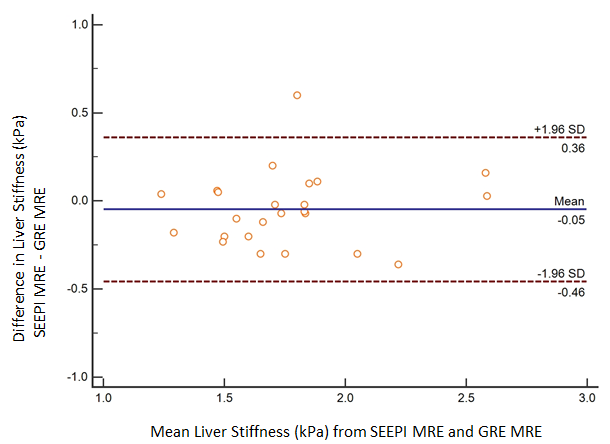
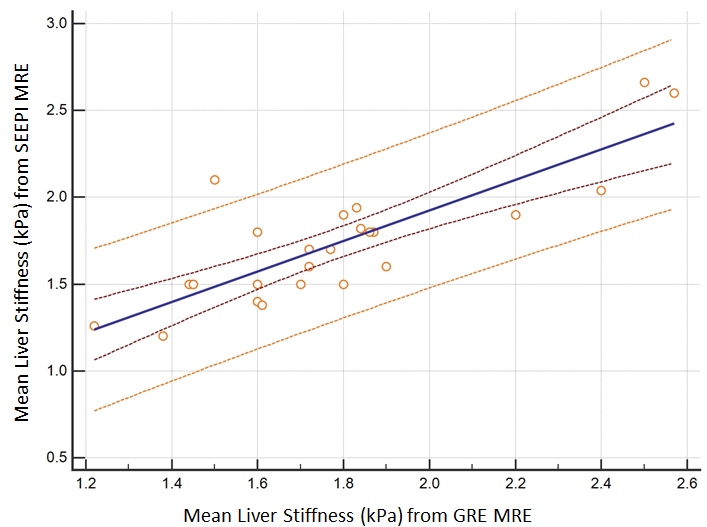
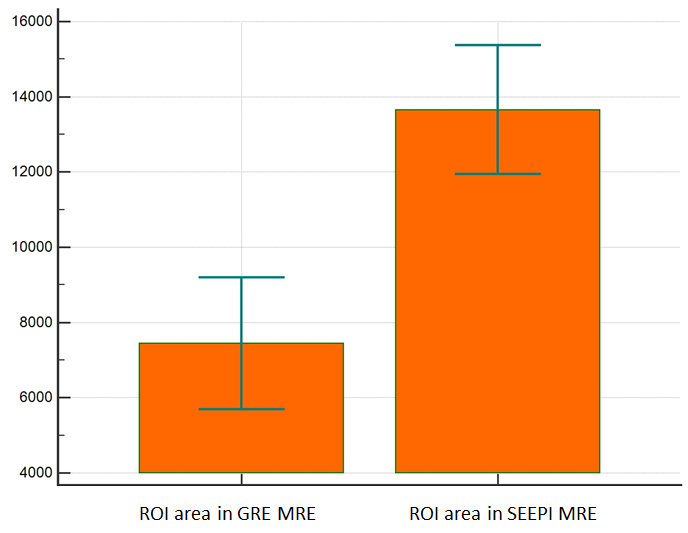
Mean measured stiffness of the phantom was 5.59±0.55 kPa for SE-EPI MRE and 5.60±0.13 kPa for GRE MRE (n = 4; p = 0.97). For healthy volunteers, mean liver stiffness was 1.78 ± 0.5 by SE-EPI MRE and 1.75 ± 0.4 kPa by GRE MRE (n = 24; p = 0.82). Fig.2 shows an example of MRE data from one of the healthy volunteers. Mean bias for normal volunteers between techniques was 0.08 kPa by Bland-Altman analysis with all values except one borderline outlier, falling within two standard deviations (Fig. 3). Scatter plot shows stiffness values between two acquisition techniques (GRE MRE and SE-EPI MRE) fall within 95% prediction limits with the exception of one outlier (Fig. 4). Measurable regions of interest (ROI) were 74.9% larger with SE-EPI MRE (13,654 ± 4,060 mm2 vs. 7,804 ± 3,995 mm2 for GRE MRE) (p<0.001) (Fig. 5). Since liver fibrosis is a heterogeneous disease, having the ability to include larger ROI’s on SE-EPI generated elastograms allows for the best estimate of overall liver stiffness and minimizes the limitations related to sampling errors.Conclusion
We have successfully developed and validated SE-EPI MRE on a 3T MR system. In phantom studies and 24 volunteers, we have demonstrated no significant differences in measured stiffness between 2D GRE MRE and SE-EPI MRE confirming the adequacy of the new technique.Acknowledgements
We would like to thank Dr. Richard L. Ehman, Dr. Kevin Glaser, and Dr. Roger Grimm of Mayo Clinic, Rochester, Minn., Dr. Amol Pednekar and Dr. Alex Dresner of Philips for providing technical advice.References
[1] Yin et.al, Radiology 2016, 278(1):114-24. [2] Xanthakos et. al, J Pediatr 2014, 164(1):186-8. [3] Serai et. al, Abdom Imaging 2015, 40(4): 789-94.Figures