1377
Comparison of mechanical properties of porcine brain tissue in vivo and ex vivo using MR elastography1Mechanical Engineering, Washington University in St. Louis, St. Louis, MO, United States, 2Biomedical Engineering, Washington University in St. Louis, St. Louis, MO, United States, 3Biomedical Engineering, University of Delaware, Newark, DE, United States
Synopsis
Computational models of traumatic brain injury (TBI) require accurate estimates of brain tissue mechanical properties, however properties of brain tissue ex vivo may differ from corresponding properties in vivo. To characterize possible differences, we performed MR elastography (MRE) on four Yucatan mini-pigs in vivo. Brain tissue samples from the same animals were later tested using ex vivo MRE. Shear moduli of both in vivo and ex vivo brain tissue were estimated using local direct inversion. Our results suggest that in vivo tissue is stiffer than ex vivo tissue at the same frequency, which has important implications for TBI model development.
Purpose
Traumatic brain injury (TBI) causes over 1.7 million new cases of disability and death in the United States each year1. TBI occurs when sudden linear or angular head acceleration leads to stretching and shearing of brain tissue2. In principle, simulations of TBI can be used to develop and evaluate preventative measures, but accurate, validated computer models of TBI are still lacking2. Such models require accurate mechanical properties of brain tissue. Many mechanical tests of brain tissue have been performed ex vivo, but there is limited research on the relationship between tissue properties measured ex vivo and actual behavior in vivo3. MR elastography (MRE), an imaging modality capable of noninvasively estimating tissue material properties, enables characterization of in vivo and ex vivo brain tissue. There are many factors that differentiate the intact, living brain from ex vivo samples3,4, such as perfusion, residual stress, and metabolic state. In the current study, material properties of porcine brain tissue estimated from MRE were obtained in vivo at frequencies of 50 and 100 Hz and ex vivo at frequencies of 100, 200, and 300 Hz.Methods
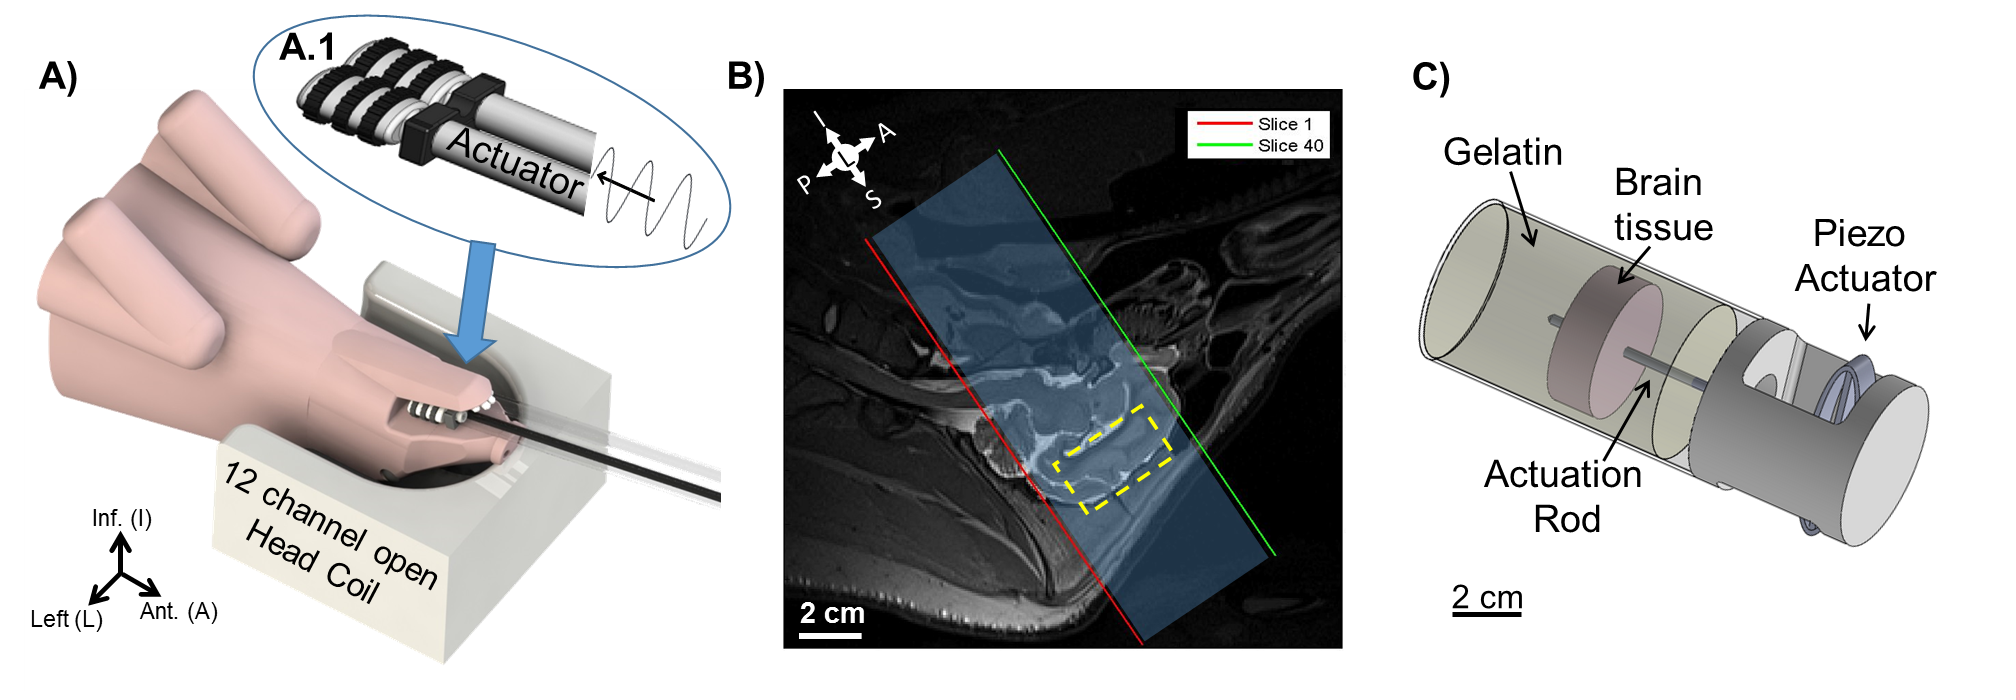
In vivo MRE of the Yucatan mini-pig (N=4) was performed on a Siemens Prisma® 3T MRI scanner. Skull vibrations were induced at frequencies of 50 and 100 Hz with a commercially available system (ResoundantTM, Rochester, MN) using a custom end-effector placed between the back molars of the mini-pig jaw (Figure 1A). MRE data encoding 3D displacements as phase were acquired with a 2D multishot spiral sequence5 with 1.5 mm isotropic voxels, covering a volume of 180 x 180 x 60 mm3 (Figure 1B).
Ex vivo MRE of the same Yucatan mini-pig brains was performed on an Agilent/Varian DirectDrive 4.7T small-bore animal MRI scanner. Brains were extracted immediately after euthanasia; 42 mm diameter cylindrical samples, each containing corpus callosum and gray matter, were extracted with a sharp punch and embedded in gelatin/glycerol6. MRE studies were performed in brain/gel samples at room temperature (21-23°C) within 2 hours post mortem. Shear waves of 100, 200, and 300 Hz were excited by a central rod (Figure 1C) driven by an MR-compatible piezoelectric actuator (APA150, Cedrat Technologies, Meylan, France). Data were acquired with a modified 2D multi-slice spin-echo sequence with 1 mm isotropic voxels, covering a volume of 48 x 48 x 24 mm3.
Local direct inversion (LDI)6 was performed on both the in vivo and ex vivo MRE displacement fields to estimate the complex shear modulus of the mini-pig brain at each of the measured frequencies. Estimates of shear modulus were made for the entire brain in vivo. The results were averaged over a region of interest corresponding to the location of the ex vivo brain samples.
Results
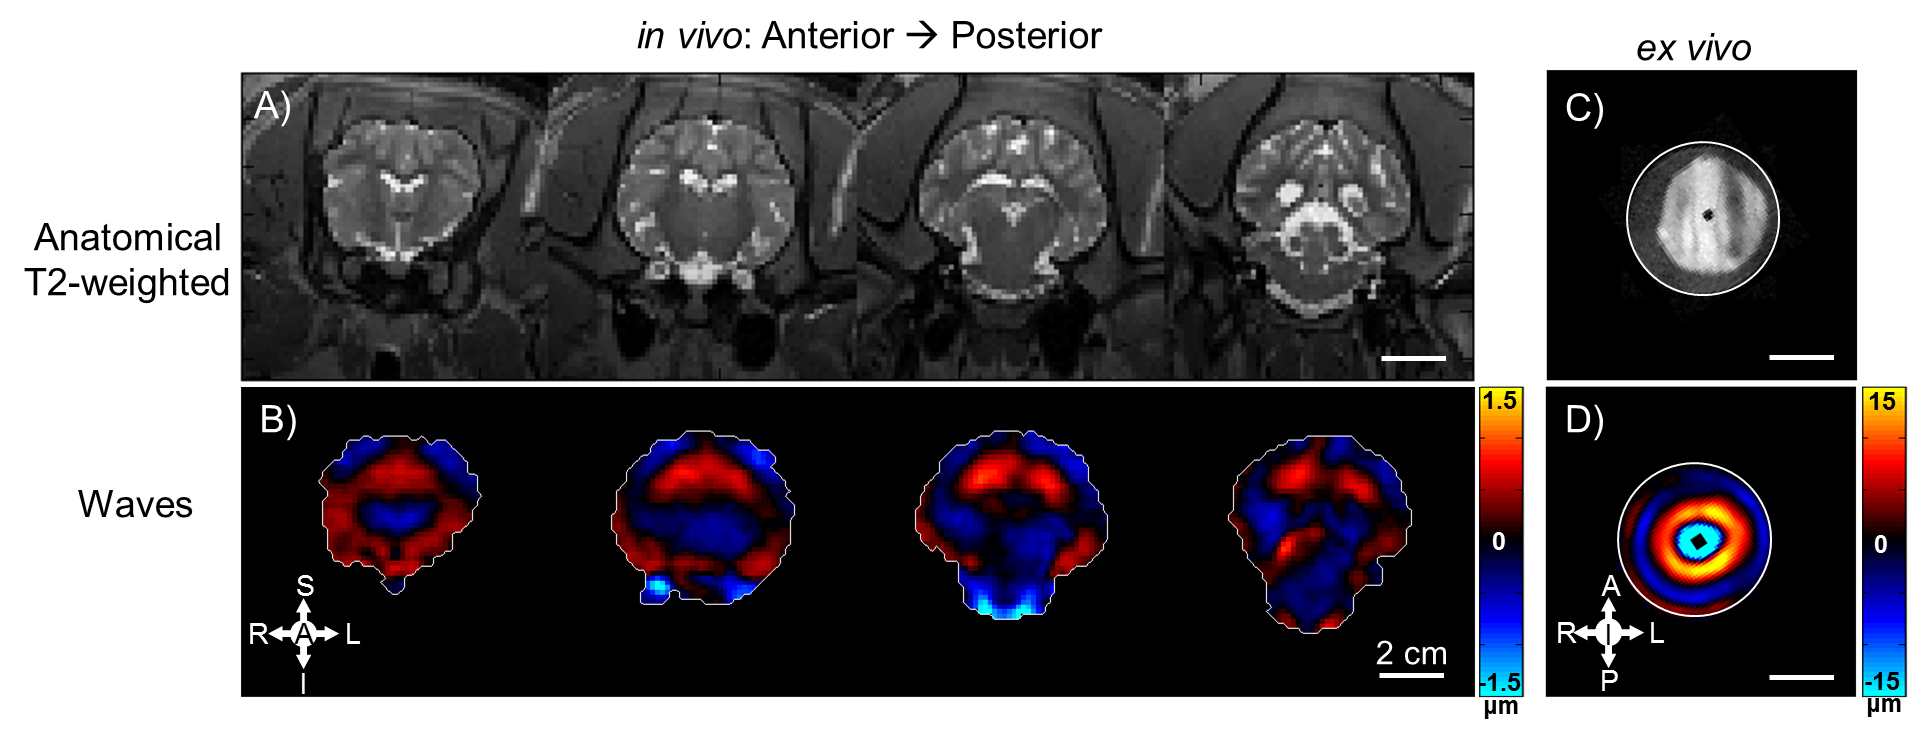
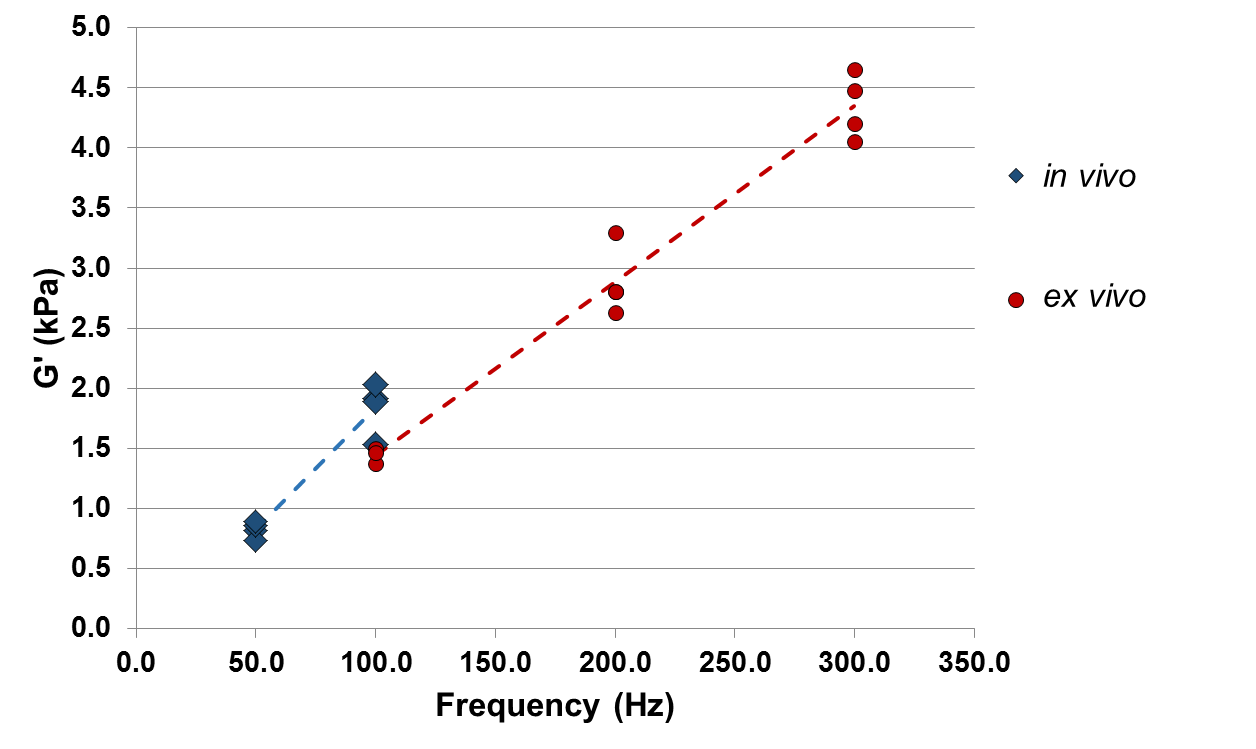
Brain tissue motion measured by MRE is shown for both in vivo and ex vivo data (Figure 2). Estimates of mean storage modulus (G’) for in vivo and ex vivo data are shown in Figure 3. Both in vivo and ex vivo shear modulus estimates increase with frequency. At the one common frequency of 100 Hz with both measurements, estimated shear modulus of in vivo brain tissue is higher than that of ex vivo tissue.Discussion
This study is the first comparison of in vivo / ex vivo MRE on the same samples of brain tissue. MRE estimates of shear modulus suggest that intact, living brain tissue is stiffer than ex vivo samples. Both in vivo and ex vivo shear moduli estimates increase with frequency, which is expected for viscoelastic tissue. Limitations of in vivo MRE measurements are due to the size of the porcine brain and its position deep inside the skull, which limits the amplitude of shear waves induced in the brain. Ex vivo measurements can be performed at a higher resolution and with direct actuation of brain tissue. The dominant direction of shear displacement relative to anatomy differed between in vivo and ex vivo, but in both cases was perpendicular to corpus callosum fibers. Apart from these methodological differences, the observed differences in tissue stiffness in vivo and ex vivo may be due to residual stress, perfusion, or metabolic state.Conclusion
MRE can detect measurable differences between in vivo and ex vivo mechanical properties, which are important to our understanding of brain tissue mechanical properties and their use in the development of accurate simulations of TBI. The observation that in vivo brain tissue is stiffer than ex vivo samples has significant implications for the use in computer models of mechanical properties measured ex vivo.Acknowledgements
This project was supported by ONR N00014-15-C-5160, NIH NS055951, NSF CMMI-1332433, and NIH 5T32EB01485505.References
1. Faul, M., et al. CDC: National Center for Injury Prevention Control, 2010.
2. Feng, Y, et al. Measurements of mechanical anisotropy in brain tissue and implications for transversely isotropic material models of white matter. J Mech Behav Biomed Mater. 2013;23:117-132.
3. Rashid, B, et al. Mechanical characterization of brain tissue in compression at dynamic strain rates. J Mech Behav Biomed Mater. 2012;10:23-38.
4. Gefen, A et al. Are in vivo and in situ brain tissues mechanically similar?. J Biomech. 2004;37(9):1339-1352.
5. Johnson CL, et al. Magnetic resonance elastography of the brain using multishot spiral readouts with self-navigated motion correction. Magn Reson Med. 2013;70(2):404-412.
6. Okamoto RJ, et al. Viscoelastic properties of soft gels: comparison of magnetic resonance elastography and dynamic shear testing in the shear wave regime. Phys Med Biol. 2011;56(19):6379-400.
Figures