1374
Waveguide Effects in Cardiac Magnetic Resonance Elastography: A Finite Element Study1Physiology and Biomedical Engineering, Mayo Clinic, Rochester, MN, United States, 2Division of Engineering, Mayo Clinic, Rochester, MN, United States, 3Radiology, Mayo Clinic, Rochester, MN, United States
Synopsis
MR elastography is increasingly being applied to thin or small structures in which wave propagation is dominated by waveguide effects, which can bias stiffness results with common processing approaches. Finite element simulations of a realistic cardiac geometry were used to investigate the importance of waveguide effects, and to study the ability of the curl operator to remove these effects. The results establish that waveguide effects in a cardiac geometry can strongly bias stiffness results, but can be correctly handled by application of the curl operator to the measured displacement field, followed by true 3D inversion.
Introduction
MR elastography (MRE) non-invasively measures mechanical material parameters, such as shear modulus, in soft tissue. In MRE, an external source generates shear waves in a tissue of interest. A phase contrast based MRI technique then measures the vibrational displacements as they propagate through the tissue. Finally, the displacement field is inverted to generate a map of material properties1-2. MRE has proven clinically useful in the liver3-5, and is showing promise for clinical applications in the brain6-8; other possible applications are being explored. In some applications, thin or small structures are being investigated (e.g. bladder, small tumors, etc.) Waveguide or boundary effects dominate wave propagation in such structures as the ratio of the wavelength to the thinnest dimension falls below unity, and propagation depends critically on geometry as well as on the underlying material properties. In particular, cardiac MRE is actively being investigated by several groups9-13. The myocardium is a thin shell, and at current MRE driving frequencies, waveguide effects are strongly present. Many MRE processing approaches can yield biased results if they do not account for these effects. Applying the curl operator to the displacement field can remove waveguide effects in principle, leaving only a field that propagates at the shear wave speed, although at the expense of noise amplification14-15. The purpose of this work is to investigate the importance of waveguide effects, and the ability of the curl operator to remove these effects, on MRE inversions in a realistic cardiac geometry.Methods
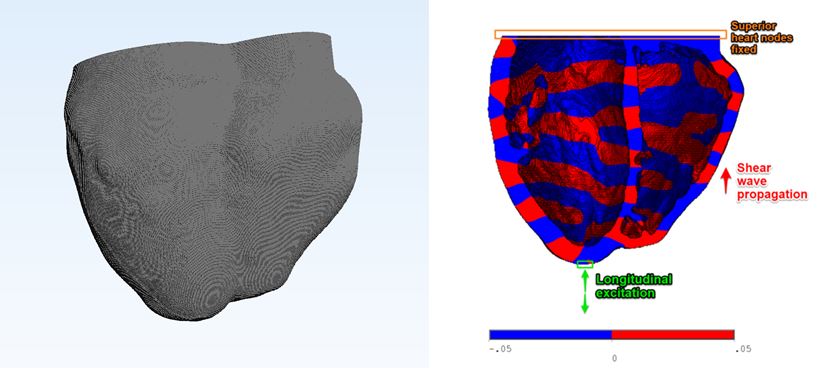
Finite element simulations of a realistic cardiac geometry were performed with ANSYS 16.1. A linear viscoelastic material was used with a complex shear modulus of G* = 4 + 1i kPa (thought to be close to diastolic heart stiffness), Poisson’s ratio of 0.49995, and mass density of 1 g/cm3. The 3D realistic cardiac geometry was obtained from a segmented ECG-gated computed tomography image volume of a patient’s heart [AM1] in diastole. The models contained ~6 million nodes with ~22 million degrees of freedom at 0.29x0.29x0.2 mm resolution. Harmonic displacement excitation with 0.05 mm amplitude was applied in either a shear or longitudinal direction to a group of exterior nodes at the base of the geometry at various frequencies from 60-220 Hz. The nodes on the most superior face of the heart wall geometry were fully constrained in all degrees of freedom (Fig 1). The shear modulus was calculated by direct inversion (DI) of the Helmholtz equation on either the displacement or curled wave field2. Spatial derivatives were taken using a 3x3x3 6-nearest neighbor kernel at a resolution of 0.29 mm.Results
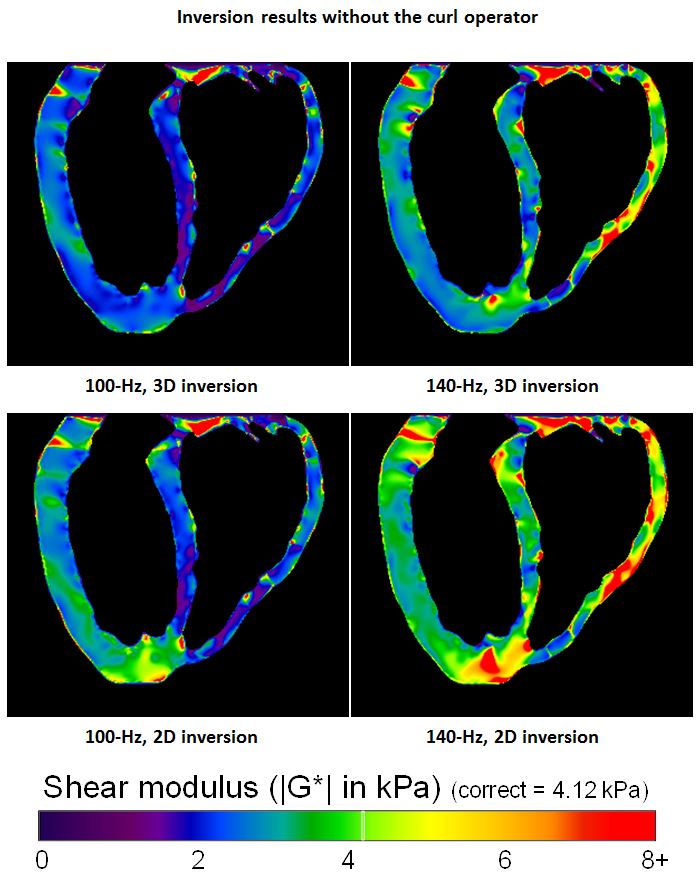
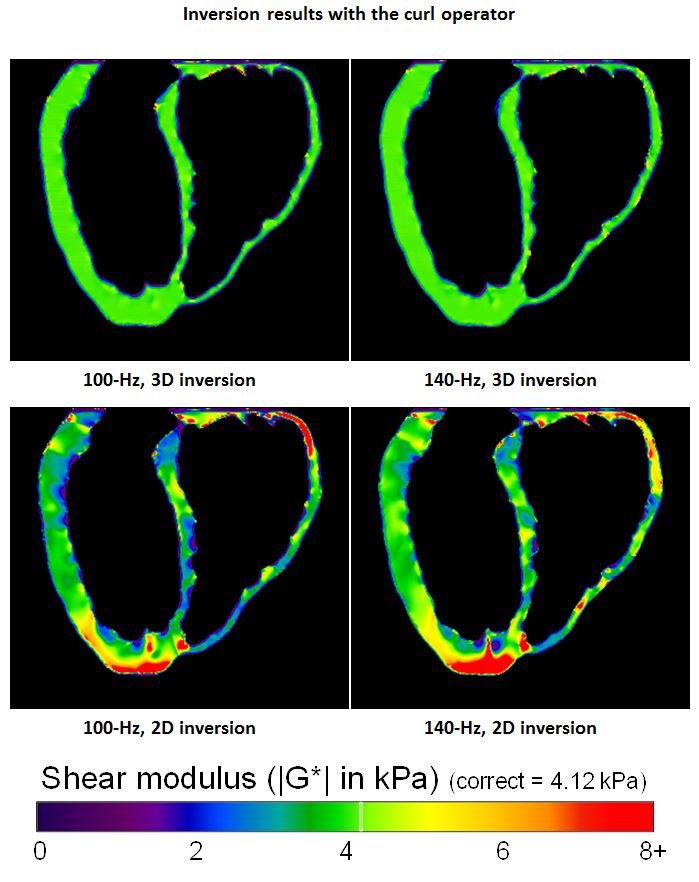
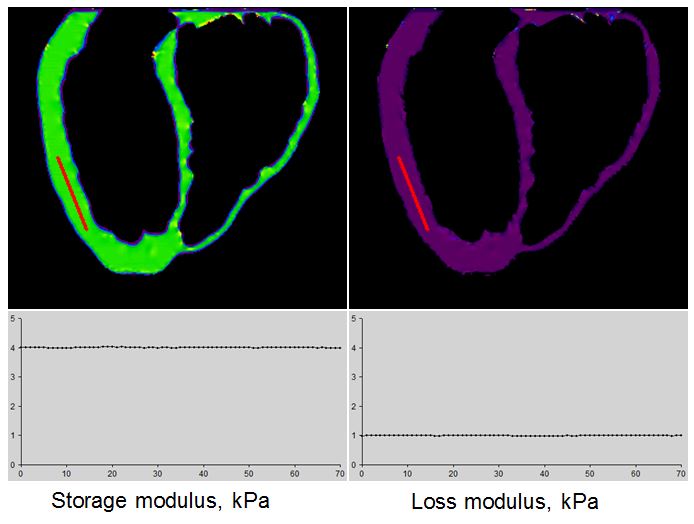
Figs. 2-3 show results for the realistic cardiac geometry at 100 Hz and 140 Hz, with longitudinal driving at the apex. Results without the curl (Fig. 3) are incorrect and show many artifacts. Results with the curl (Fig. 4) are fairly uniform and report the correct value with 3D inversion. Results with 2D inversions, while somewhat improved, remain incorrect with numerous artifacts. Storage and loss moduli results for a sample case (100 Hz, curl) are shown in Fig. 4, and the values along the profile show accurate recovery of both parameters. Similar results to those shown occur with shear instead of longitudinal driving and at other frequencies (not shown), with biases more severe at lower frequencies.Discussion and Conclusions
Removing waveguide effects by inverting the curl of the 3D displacement field has only been validated to a limited degree with simple models and phantoms14-15, and not in a complex, realistic heart geometry. These results show that substantial biases can occur in this geometry, but that applying the curl and performing full 3D inversion allows accurate recovery of the complex shear modulus. This is the first demonstration that 3D MRE can, in principle, give accurate shear modulus measurements for a realistic cardiac geometry. This study had several limitations. The models assumed a homogeneous object and isotropic material properties, whereas the myocardium is anisotropic and far more complex. The models did not include noise, and applying the curl amplifies noise in the data, which biases DI results towards softer stiffness values. The models were inverted with an effective pixel resolution of 0.29 mm, which minimizes discretization effects, but such effects can become important at realistic MRE resolution. However, these results establish that at a minimum, taking the curl of the wave field and performing a full 3D inversion are both necessary (although not sufficient) steps for accurate estimation of shear modulus in a cardiac geometry.Acknowledgements
This work was supported in part by grants from the National Institute of Health R01 EB001981 and R01 HL115144.References
1. Muthupillai R, Lomas DJ, Rossman PJ, Greenleaf JF, Manduca A, Ehman RL. Magnetic resonance elastography by direct visualization of propagating acoustic strain waves. Science 1995;269:1854–1857.
2. Manduca A, Oliphant TE, Dresner MA, Mahowald JL, Kruse SA, Amromin E, Felmlee JP, Greenleaf JF, Ehman RL. Magnetic resonance elastography: Non-invasive mapping of tissue elasticity. Med Img Anal 2001;5:237-254
3. Yin M, Talwalkar JA, Glaser KJ, et al. Assessment of hepatic fibrosis with magnetic resonance elastography. Clin Gastroenterol Hepatol 2007;5:1207–1213.
4. Huwart L, Peeters F, Sinkus R, et al. Liver fibrosis: non-invasive assessment with MR elastography. NMR Biomed 2006;19:173–179.
5. Yin M, Glaser KJ, Talwalkar JA, Chen J, Manduca A, Ehman RL. Magnetic resonance elastography of the liver: Observations from a review of 1,377 exams. Radiology 2016;278:114-124.
6. Streitberger K-J, Sack I, Krefting D, Pfuller C, Braun J, Friedemann P, Wuerfel J. Brain viscoelasticity alteration in chronic-progressive multiple sclerosis. PlosONE 2012;7(1):e29888.
7. Murphy MC, Huston J, 3rd, Glaser KJ, et al. Preoperative assessment of meningioma stiffness using magnetic resonance elastography. J Neurosurg. 2013;118(3):643-8.
8. Murphy MC, Huston J III, Jack CR, Jones DT, Glaser KJ, Senjem ML, Chen J, Manduca A, Felmlee JP, Ehman RL. Regional brain stiffness changes across the Alzheimer’s disease spectrum. Neuroimage:Clinical 2016;10:283-290.
9. Kolipaka A, Aggarwal SR, McGee KP, Anavekar N, Manduca A, Ehman RL, Araoz PA. Magnetic resonance elastography as a method to estimate myocardial contractility. Journal of magnetic resonance imaging. JMRI 2012;36(1):120-127.
10. Elgeti T, Knebel F, Hattasch R, Hamm B, Braun J, Sack I. Shear-wave amplitudes measured with cardiac MR elastography for diagnosis of diastolic dysfunction. Radiology 2014;271(3):681-687.
11. Elgeti T, Sack I. Magnetic resonance elastography of the heart. Curr Cardiovasc Imaging Rep 2014;7:9247.
12. Arani A, Glaser KL, Arunachalam SP, Rossman PJ, Lake DS, Trzasko JD, Manduca A, McGee KP, Ehman RL, Araoz PA. In vivo, high-frequency three-dimensional cardiac MR elastography: Feasibility in normal volunteers. MRM 2016;in press, electronic copy available.
13. Wassenaar PA, Eleswarpu CN, Schroeder SA, Mo X, Raterman BD, White RD, Kolipaka A. Measuring age-dependent myocardial stiffness across the cardiac cycle using MR elastography: a reproducibility study. MRM 2016: 75:1586–1593.
14. Sinkus R, Daire J-L, Vilgrain V, Van Beers BE. Elasticity imaging via MRI: Overcoming the waveguide limit, and clinical liver results. Cur Med Img Reviews 2012; 8:56-63.
15. Nenadic I, Bernal M, Brum J, Gennison J-L, Pernot M, Greenleaf JF, Tanter M, Urban MW. Recovering shear wave velocity in boundary sensitive media with two-dimensional motion tracking. Proc IUS Ultrasonics Symposium 2014;1093-1096.
Figures