1373
Utilization of MR Elastography for selective boost to dominant intraprostatic lesions1Medical Physics Department, Saskatoon Cancer Centre, Saskatchewan Cancer Agency, Saskatoon, SK, Canada, 2Division of Biomedical Engineering, University of Saskatchewan, Saskatoon, SK, Canada, 3Department of Medical Imaging, University of Saskatchewan and Saskatoon Health Region, Saskatoon, SK, Canada, 4Department of Electrical & Computer Engineering, University of Saskatchewan, Saskatoon, SK, Canada
Synopsis
MRE has the ability to distinguish between elastic properties of the tissue. Furthermore, it is maturing as a technique to differentiate normal and cancerous tissue. In this work we present a strategy to establish
Purpose
MRE has shown the ability of quantitatively revealing the mechanical properties of both healthy and cancerous tissue 1,2. This information could be used to segment a dominant intraprostatic lesion (DIL) and then use this information to boost the amount radiation to the DIL, in turn increasing tumour control probability. To improve workflow, an optimized scan procedure designed for radiation treatment planning was developed which includes fusing MRI, MRE and CT scans. This work focuses on investigating the feasibility of integrating the MRE into the Radiation Therapy (RT) process with the aid of a tissue-equivalent prostate phantom.Materials and Methods
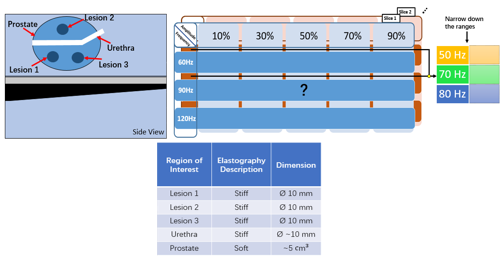
To conduct a feasibility experiment, we utilized a prostate phantom with three DILs (053L CIRS Inc., Norfolk, VA). All MRE/MRI and CT images were carried out on a 3T Skyra MRI system (Siemens Healthcare, Erlangen, Germany) and GE Lightspeed CT simulator (GE Healthcare, Chicago, USA). The MRE scans were obtained using the Resoundant Inc. (Rochester, MN) system in combination with MRE WIP SE-EPI sequence (WIP 923B, Siemens VE11A) for acquisition, and MRE/Wave software 3. To determine the optimal MRE scan parameters to identify “stiff” and “soft” structures, we performed a panel test examining critical parameters including slice thickness, driver frequency and relative signal amplitude. The phantom characteristics, and panel test schema is shown in Figure 1. Using the panel test, we determined the best MRE scan parameters based on how close the MRE defined volume matched the DILs defined on anatomical scans. Once, the combined MRE/MRI scan was obtained, we fused the MRE/MRI to the planning CT scans using Eclipse treatment planning software (Varian Medical Systems, Pal Alto, USA). An external beam radiation treatment was generated utilizing volumetric modulated arc therapy (VMAT). DILs identified on the MRE scans were boosted to 85 Gy, while keeping the dose the prostate gland to 78Gy. Dose coverage, and conformity index were calculated for the prostate and DILs.Results and Discussions
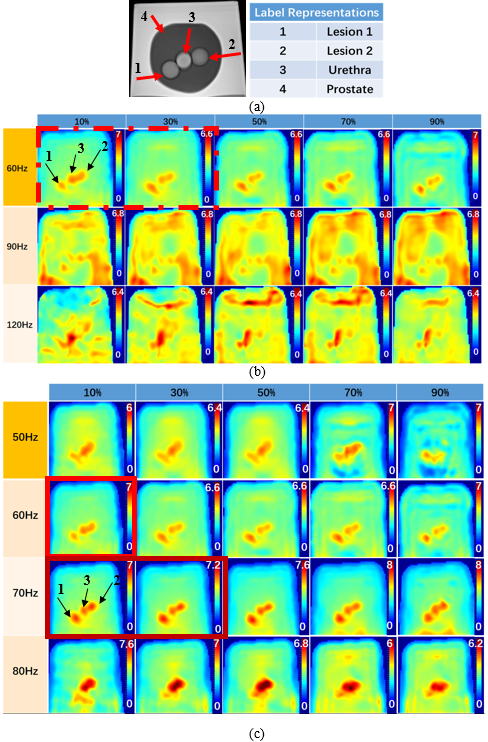
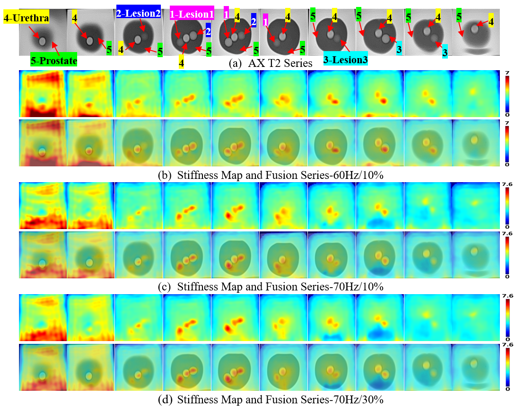
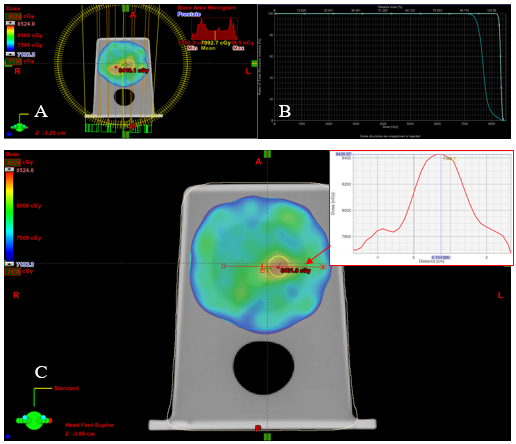
In our previous work, we demonstrated that the Resoundant MRE system may potentially be used outside the its intended use for liver, and presented quality assurance measurements on a novel phantom design specifically designed for the system 4. The results of the coarse and fine panel tests are shown in Figure 2. The coarse panel test helped narrow the range of frequencies, and the fine panel tests demonstrate the minimum, and maximum frequencies/amplitudes that could be used to obtain good quality MRE data. Figure. 2 (b) and (c) shows, that for this phantom, good quality MRE images can be obtained over the range of 50- 70 Hz, and between 10-30% relative driver amplitude. The lesions and urethra of this phantom are clearly visible on the MRE scans. In comparison to the T2 axial image (Figure.2 (a)) the shape and size of the ROIs match closely to the volumes identified by the MRE images. The best MRE image (see Figure 3) were obtained with settings at 60Hz/10%, 70Hz/10% and 70Hz/30%. Multi-slice MRE scans across the whole prostate were obtained (see Figure. 3). The results in Figure 3 verified that all the “stiff” regions in the prostate are well detected. High quality MRE data provides a direct avenue to integrate this information into radiation treatment planning. In Figure 4, we show an axial view of the dose distribution over-layed on top of the fused MRE/MRI and CT scan of the prostate. Using the combined information were able to boost the MRE defined DILs to 85 Gy, while keeping the prostate 75 Gy. Using a VMAT technique we were able to achieve a highly conformal plan (conformity index for the prostate and combined DILs was 1.1 and 1.25, demonstrating the feasibility of using MRE data for targeted radiation dose escalation.Conclusion
In this work we have validated a strategy for identifying optimal parameters for MRE data acquisitions. Using a prostate like phantom we showed that the reconstructed MRE images of the DILs matched closely to the anatomical MRI images. Using the optimized workflow we collected MRE/MRI data and fused them to the CT planning scan and achieved an optimized radiation treatment plan with intraprostatic boost to MRE defined regions. The culmination of this work demonstrates the feasibility of using MRE data for radiation treatment planning.Acknowledgements
No acknowledgement found.References
1. Mariappan, Yogesh K., Kevin J. Glaser, and Richard L. Ehman. “Magnetic Resonance Elastography: A Review.” Clinical Anatomy 23, no. 5 (2010): 497–511.
2. Glaser, Kevin J., Armando Manduca, and Richard L. Ehman. “Review of MR Elastography Applications and Recent Developments.” Journal of Magnetic Resonance Imaging 36, no. 4 (2012): 757–774.
3. MRE/Wave - Magnetic Resonance Imaging Lab: Richard L. Ehman - Mayo Clinic Research. at <http://www.mayo.edu/research/labs/magnetic-resonance-imaging/mre-wave?_ga=1.251021446.1640793623.1433887874>
4. Cui, Lumeng, Conrad Yuen, Ted Lynch, Paul Babyn, Francis Bui, and Niranjan Venugopal. “Development of a Novel Phantom for Routine Quality Assurance of an MR Elastography System.” Proceedings of the 16th Annual Meeting ISMRM, 2016.
Figures