1365
68Ga-PSMA dose reduction for imaging the pelvic region with simultaneous PET/MREdwin E.G.W. ter Voert1,2, Hannes W. Nagel1, Gaspar Delso3, and Irene A. Burger1
1Nuclear Medicine, University Hospital Zurich, Zurich, Switzerland, 2University of Zurich, Zurich, Switzerland, 3GE Healthcare, Waukesha, WI, United States
Synopsis
When performing simultaneous single station PET and MR scans in the pelvic region, the PET acquisition time could be increased to match the usually more extensive MR protocol acquisition time. The gain in detected coincidences could be applied to decrease the PET tracer dose and thus the patient’s radiation burden, while maintaining the same image quality. In this study we investigate the minimal 68Ga-PSMA dose for a 15-minute single station PET(/MR) scan to match image quality of the standard 2 minutes scan at full dose.
Purpose
The combination of 68Ga-PSMA (prostate-specific membrane antigen) PET with multiparametric MRI (mpMRI) has a high potential for staging prostate cancer (PCa).1 So far mainly high risk PCa were investigated with PET/MR with the main focus on detection of lymph node or distant metastasis for the PET component. For those patients a partial body scan covering 6 bed positions is usually performed. However, first results suggest an increased detection rate of primary PCa. Since simultaneous PET/MR has a field of view of 25cm, a single frame 68Ga-PSMA PET/MRI scan might be enough for local tumor assessment (eg. PET/MR for biopsy guidance, or focal therapy assessment). Therefore, the PET acquisition time could be extended from the standard 2 minutes to 15 minutes per bed, thereby matching the acquisition time of the mpMRI protocol. The increase in detected PET coincidences could be used to decrease the PET tracer dose and the radiation burden for the patient. The purpose of this study was to find the minimal 68Ga-PSMA dose for a 15 minute PET(/MR) scan that still matches the image quality of a 2 minute scan at full dose without impairment of lesion detectability.Methods
We retrospectively sequentially included 10 patients (range 53-78 years) with 68Ga-PSMA PET positive pelvic lymph nodes undergoing routine PET/MR for biochemical recurrence. The clinical whole-body PET/MR protocol contains a 15 minute (1 bed) simultaneous PET and MR examination of the pelvic area as well as a whole body scan with 2 minutes per bed position. The injected 68Ga-PSMA dose was 150 MBq. Scans were started after 60 minutes uptake time. For each patient, the 15 minute PET frame was reconstructed 12 times: a normal reconstruction with 3 iterations; a reconstruction of the first 2 minutes with 2 iterations for reference; and reconstructions simulating 40%, 33%, 27%, 20%, and 13% of the original dose, performed with 2 and 3 iterations. Dose reductions were simulated by removing the indicated amount of counts from the listmode data. This was performed on a second by second basis to include normal effects like decay, biodistribution and possibly patient motion. The reconstruction algorithm was 3D-OSEM based and included all default corrections and time-of-flight information. The number of subsets was 28 and the image grid 256x256. For each patient and dataset a region of interest (ROI) around a lymph node was drawn and the SUVmaxLN was extracted. The background SUVmeanBG and the standard deviation (STD) were obtained from a 50mm diameter spherical ROI located in homogeneous tissue. To assess noise, we used the coefficient of variation (CoV=STD/SUVmeanBG). The contrast recovery was calculated with the 2 minute 2 iterations reconstruction as a reference (ref): ((SUVmaxLN/SUVmeanBG)-1)/((SUVmaxLN,ref/SUVmeanBG,ref)-1)). The reconstructed PET images were also visually assessed.Results
An example dataset with the 12 reconstructions are shown in Figure 1 and 2. Reconstructions with 3 iterations had the highest contrast recovery (Figure 3) even at very low doses. However, the low counts in combination with 3 iterations, introduced an excessive amount of noise: mean CoV was 0.47±0.09 for the 2 minute reference, compared to 0.50±0.11 and 0.56±0.12 for 20% and 13%, respectively (Figure 3). As a result, the PET positive small lymph nodes could no longer be clearly distinguished from other, noise based, background hotspots, for datasets lower than 33% of the original dose. The reconstructions with 2 iterations performed better and allowed for a dose reduction down to 27% of the original dose.Discussion
In this study we simulated 68Ga-PSMA dose reductions for 15 minute PET scans and its effect on contrast recovery and image quality compared to the full dose with 2 minute acquisition time. The 40% and 33% dose combined with 3 iterations performed well, with high contrast recovery and acceptable noise. Further dose reduction to 27% while keeping the same image quality as the 2 minutes reference scan, including acceptable noise, can be achieved when reconstructing with 2 iterations, while noise increased substantially for 3 iterations with the same dose. A limitation of this study is the assumption that a reduction in the amount of detected PET coincidences is directly related to the injected tracer dose. In reality a lower injected dose could e.g. result in a different biodistribution, leading to even lower counts in some areas. In future work we could use these results for investigating real dose reductions.Conclusion
This study indicates that the (simulated) 68Ga-PSMA dose for 15 minute PET scans could be decreased down to 27% of the original dose, while the image quality remains similar to a standard 2 minutes PET scan with normal dose.Acknowledgements
We would like to thank T. Deller (GE Healthcare) for the technical support.References
1. Eiber M, Weirich G, Holzapfel K, et al. Simultaneous 68Ga-PSMA HBED-CC PET/MRI Improves the Localization of Primary Prostate Cancer. European urology 2016
Figures
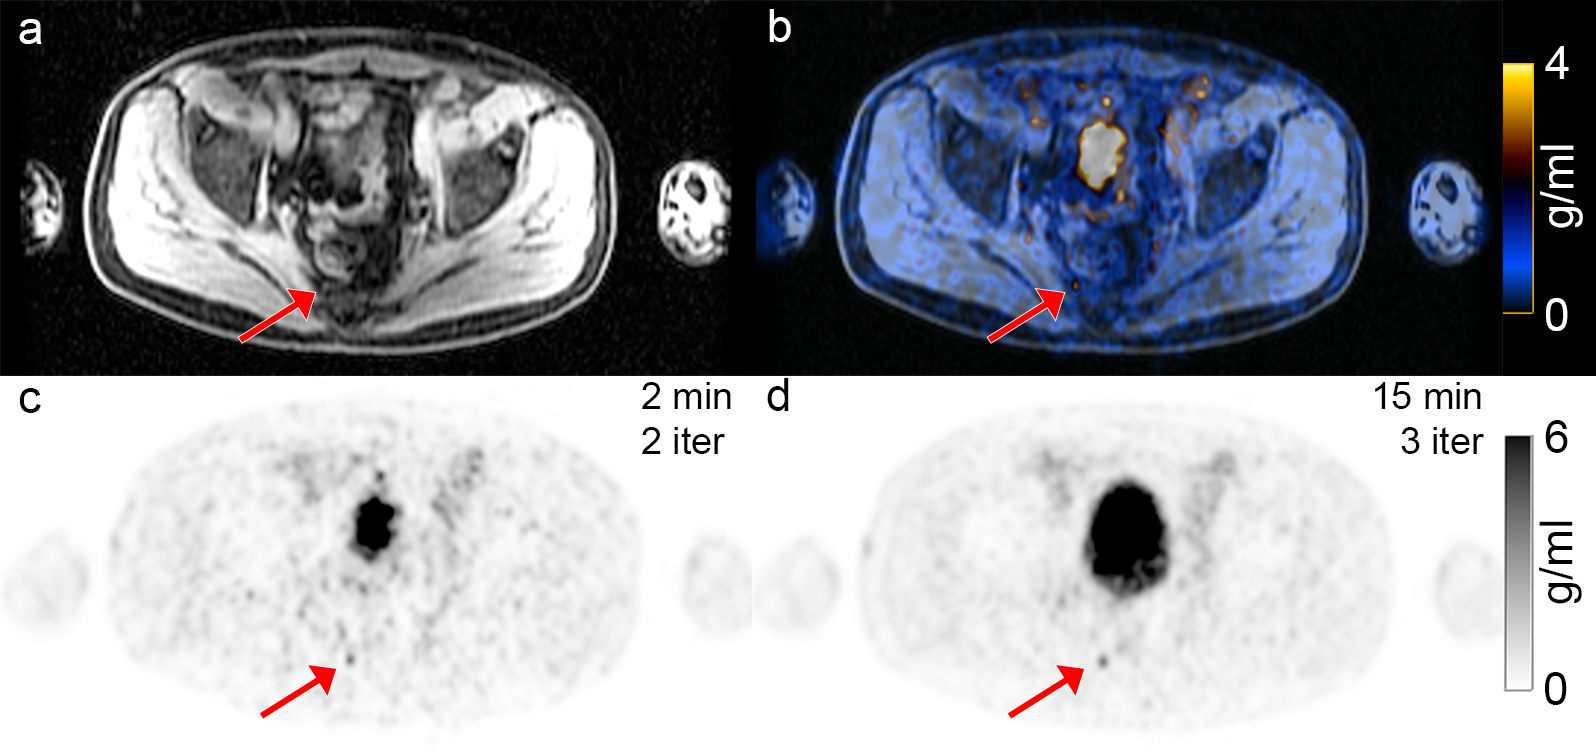
Figure 1: Example axial PET/MR images of
the pelvic region with a small low uptake lesion (SUVmax 3.9 g/ml)
(red arrow). All images show the same slice location. (a) MRI based water map; (c)
the reference 2 minute PET reconstructed image with 2 iterations; (b) the fused
images (a) and (c); (d) the 15 minute PET reconstructed image with 3 iterations.
During the 15 minute scan the activity in the urinary bladder increased.
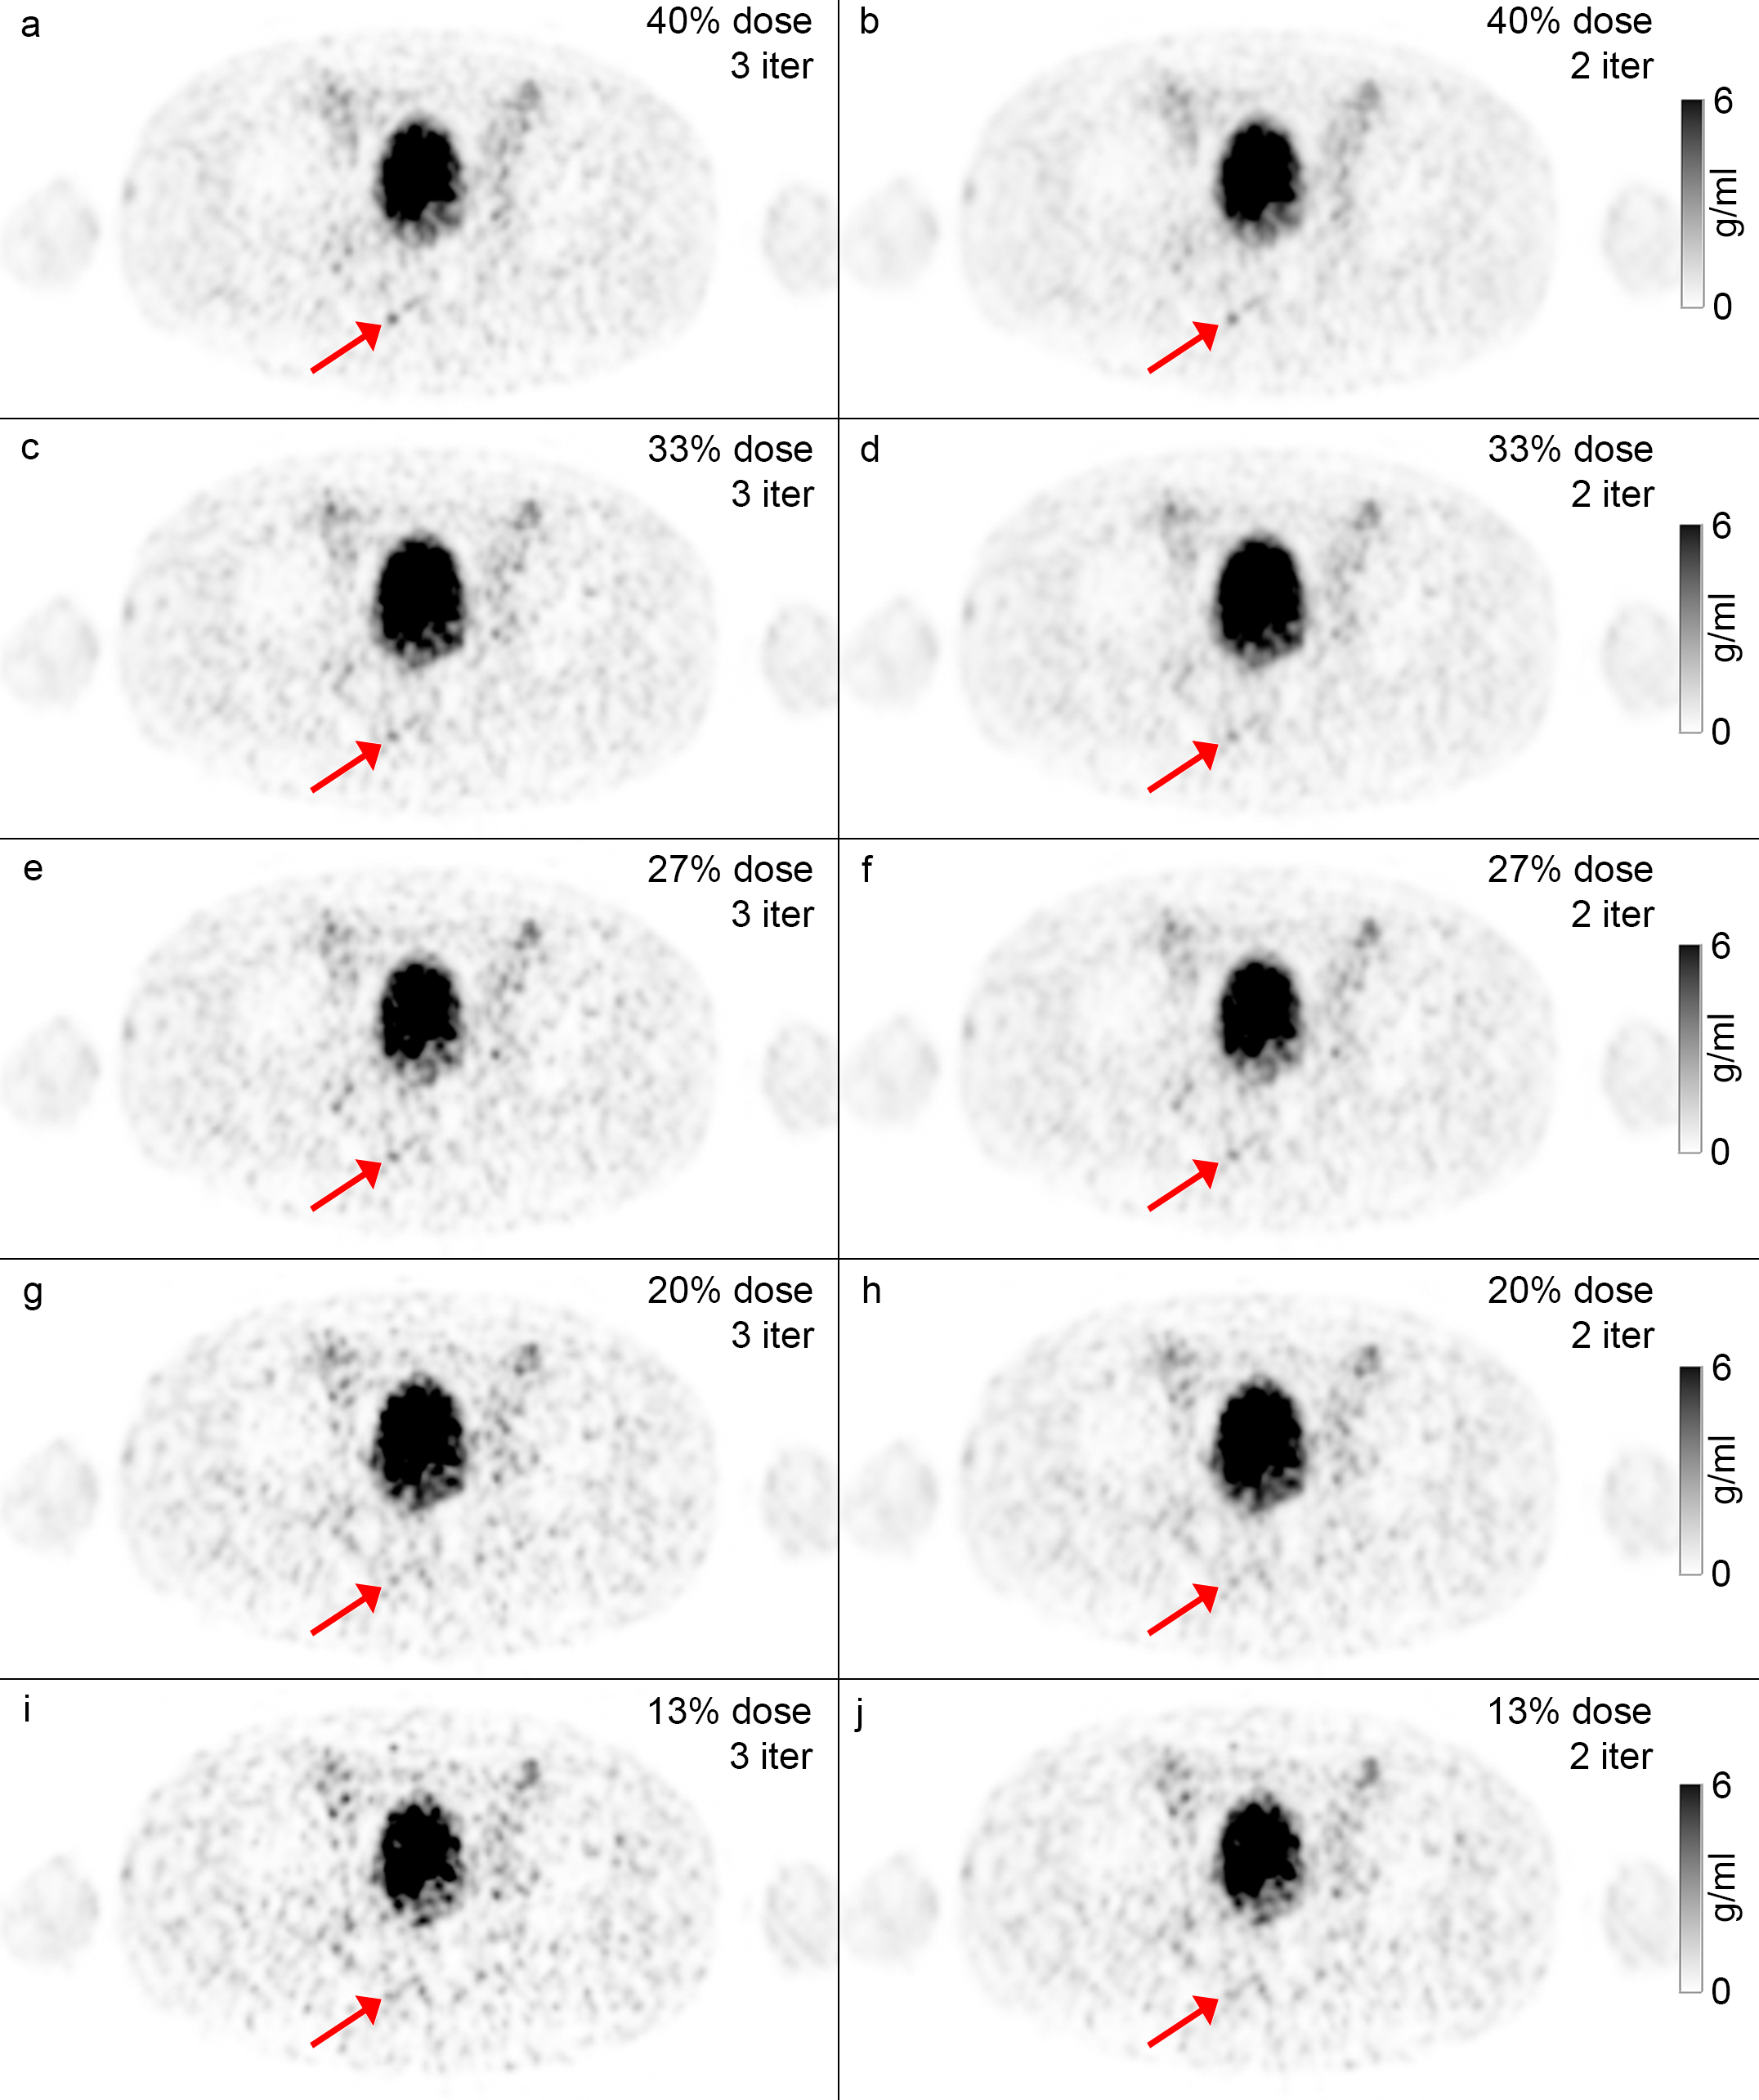
Figure 2: Example axial PET(/MR)
reconstructed images showing 5 simulated doses reconstructed with 3 and 2
iterations (left/right column). The small lesion of figure 1 is clearly visible
in the reconstructions with 40% (a,b) and 33% (c,d). On the 27% dose images
(e,f) the lesion is on the edge of still being detectable. The lesion
disappears in the background noise on the 20% (g,h) and 13% dose (i,j) PET
images.
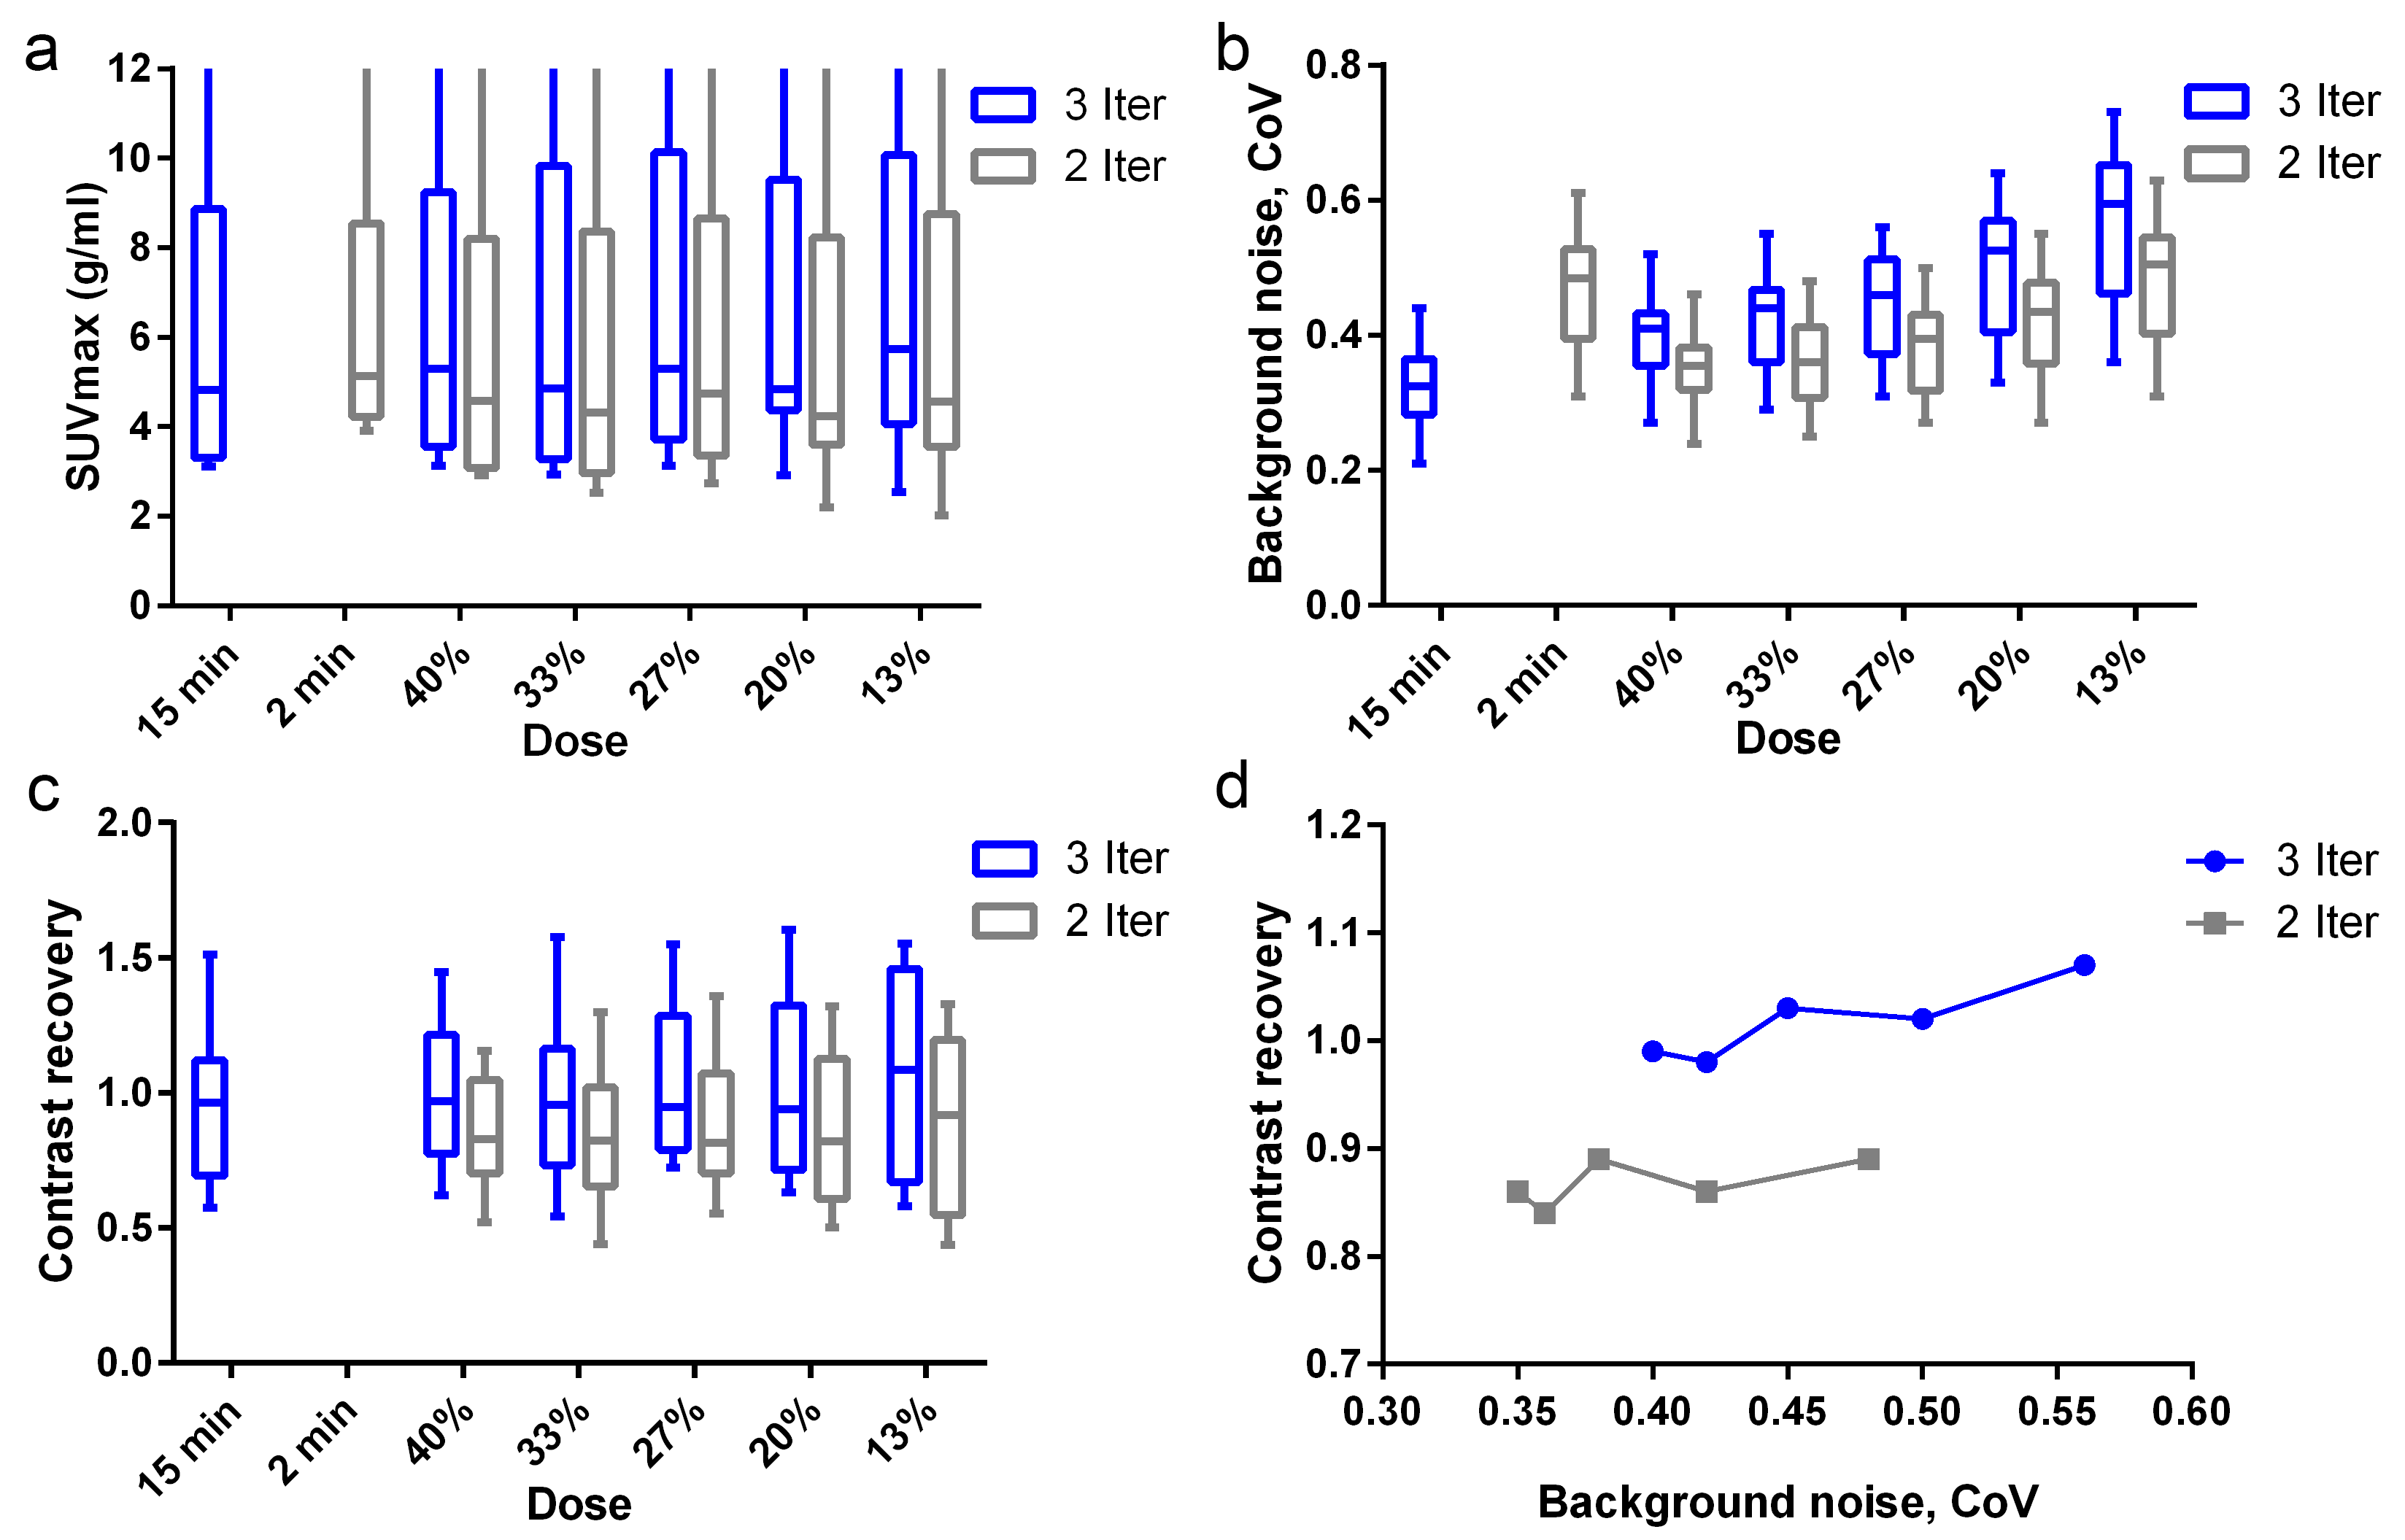
Figure
3: Box-and-whiskers plots (a-c) and the contrast recovery versus background
noise graphs (d) for 3 iterations (blue) and 2 iterations (gray). The Box-and-whiskers
plots show the median value, the 25th and 75th percentiles, and the minimum and
maximum value. In one patient the SUVmax value was 54.7 g/ml; this value is not
indicated in (a) for clarity of the graph. The markers in the contrast recovery
versus background noise graphs (d) represent, from left to right in each graph,
the reconstructions with 40%, 33%, 27%, 20%, and 13% of the original
dose.