1364
A short protocol for determining apparent kurtosis validated in a hybrid MR-PET clinical environment1INM-4, Research Centre Jülich, Jülich, Germany, 2Instituto de Biofísica e Engenharia Biomédica, Sciences Faculty, University of Lisbon, Lisbon, Portugal
Synopsis
Mean kurtosis (MK) obtained from the kurtosis tensor is often associated with acquisition protocols that may be long for clinical demands. Apparent kurtosis (Kapp), obtained from the direct fit of the signal to an exponential decay, is faster to acquire and may provide with similar information. Directional averaging is required to preserve spherical invariance; however, in clinical applications the trace of diffusion tensor measured with 3 directions is often used as tissue marker with good results. In this study we investigate Kapp derived from trace data in forty brain tumour patients and compare it to mean kurtosis. Kapp was found to be underestimated but the two metrics show a significantly high degree of correlation.
Purpose
Mean kurtosis (MK) as obtained from conventional diffusion kurtosis imaging (DKI) has shown grading power in brain tumours, a definite advantage over parameters measured with standard diffusion tensor imaging (DTI)1. However, full blown DKI acquisition protocols use typically 30 diffusion probing directions at 3 diffusion weightings2. These protocols end up being lengthy (approx. 10-15 minutes / full brain) and therefore may not meet the strict demands of the clinic. Apparent kurtosis ($$$K_{app}$$$) can be obtained from the direct fit of the signal to the exponential decay described by the kurtosis model2. Directional averaging is required to preserve spherical invariance3; however, in clinical applications the trace of diffusion tensor measured with 3 directions is often used as tissue marker with good results. A short kurtosis protocol has been proposed4 and validated5 using two non-zero b-values and 13 acquisitions. However, especially in clinical context, additional diffusion-related information is relevant besides kurtosis. We show in the following that a protocol designed for simultaneous IVIM/perfusion, diffusion and kurtosis mapping, based on trace only, delivers good kurtosis measures. The redundancy of multi-b valued information can be further used to provide very good data denoising and improve parameter estimation. Multiple aspects of tissue can thus be investigated in a clinical context with high quality in short acquisition times (4 minutes). We concentrate in the following on the comparison between $$$K_{app}$$$ derived with this new approach and MK, a relevant parameter in tumour grading1.Materials & Methods
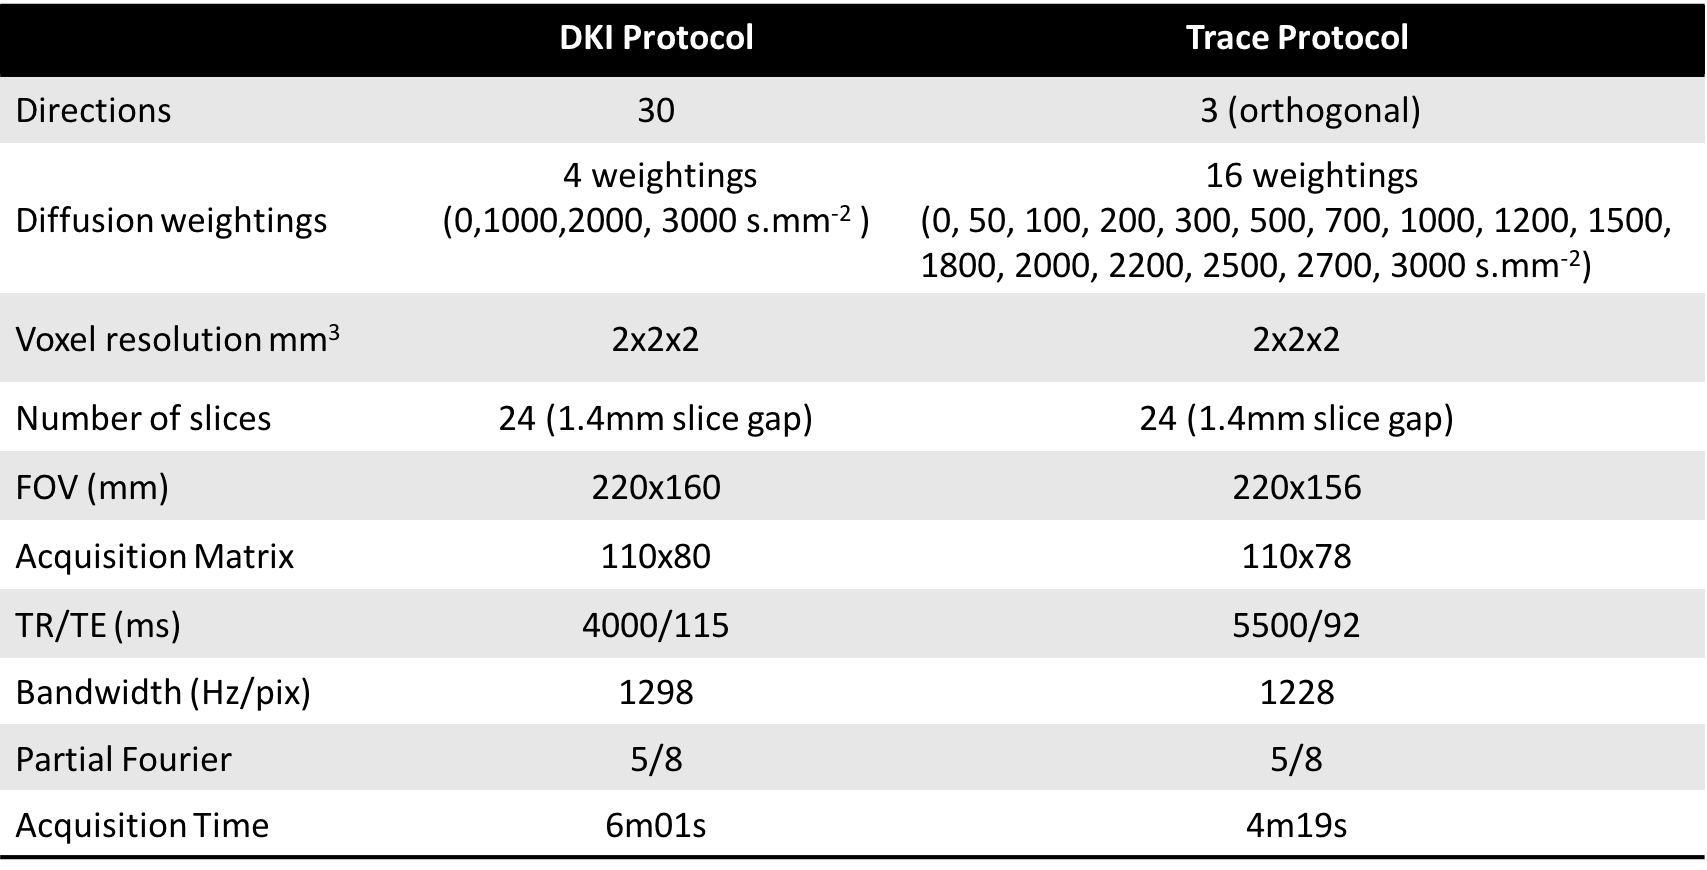
A cohort of 40 brain tumour patients was considered in this study (25 females, mean±std age 45,7±14,25), where 8 were determined to have low grade glioma (LGG) and 10 to have high grade glioma (HGG). All other have histology studies in progress. For the quantitative evaluation of brain tumours, data were acquired in a hybrid MRI-PET Siemens scanner at 3T. The MRI dataset is composed of two diffusion imaging protocols based on SE-EPI. All imaging parameters are in Table I. Both datasets were denoised using a multiscale PCA-based denoising algorithm developed in house6,7, independently from, but similar to [8]. As already noticed in [6], denoising over b-values performs better than denoising over directions (higher data similarity. The trace data were also smoothed with the same filter and then fit to $$S(b)=S(0)-exp(-bD_{app}+1/6b^2D^2_{app}K_{app})$$ from which both Dapp and Kapp were extracted, and later registered to MK space using SPM12, by means of affine transformations. Only relevant b-values (0, 1000-3000s/mm2) from the trace protocol were included in the fit. For the identification of the active tumour, dynamic 18F-fluoro-ethyl-tyrosine (18F-FET) positron emission tomography (PET) scans were acquired9.Results & Discussion
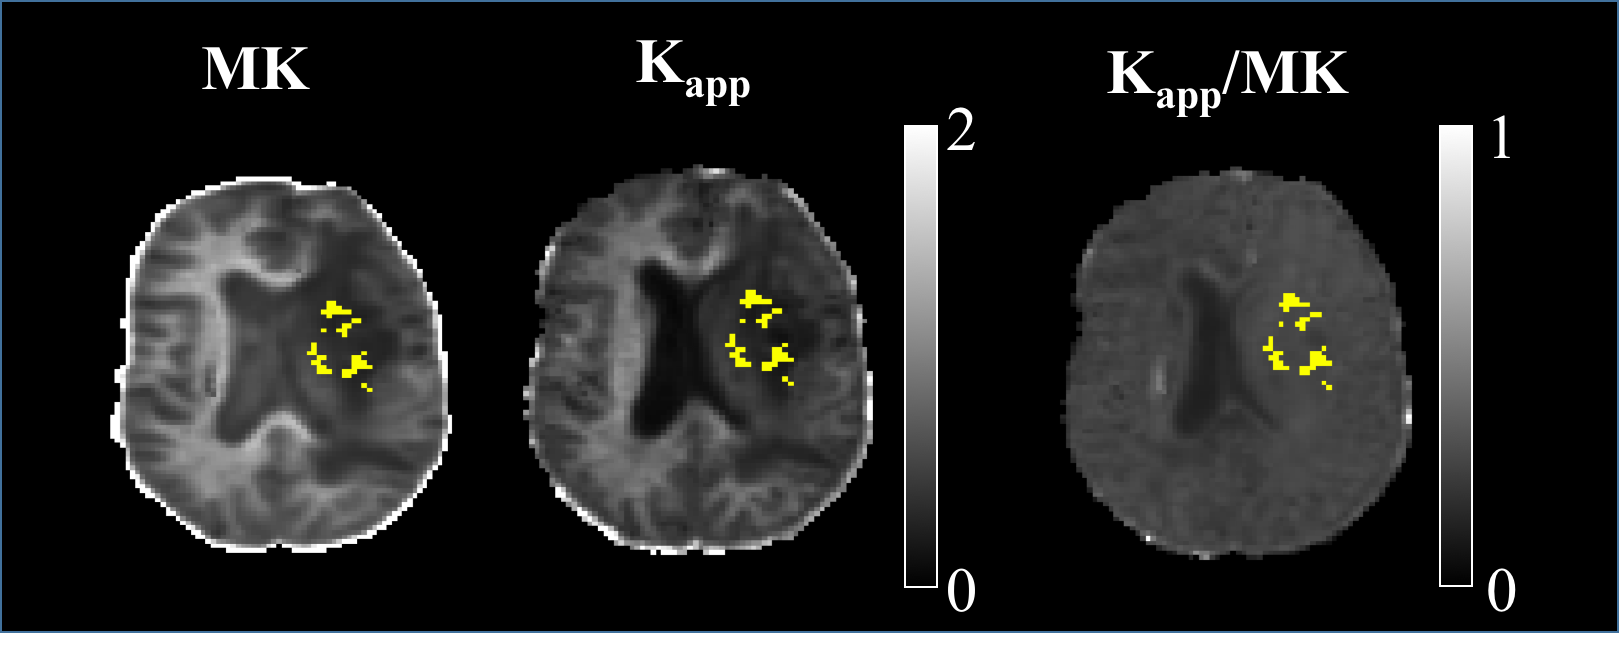
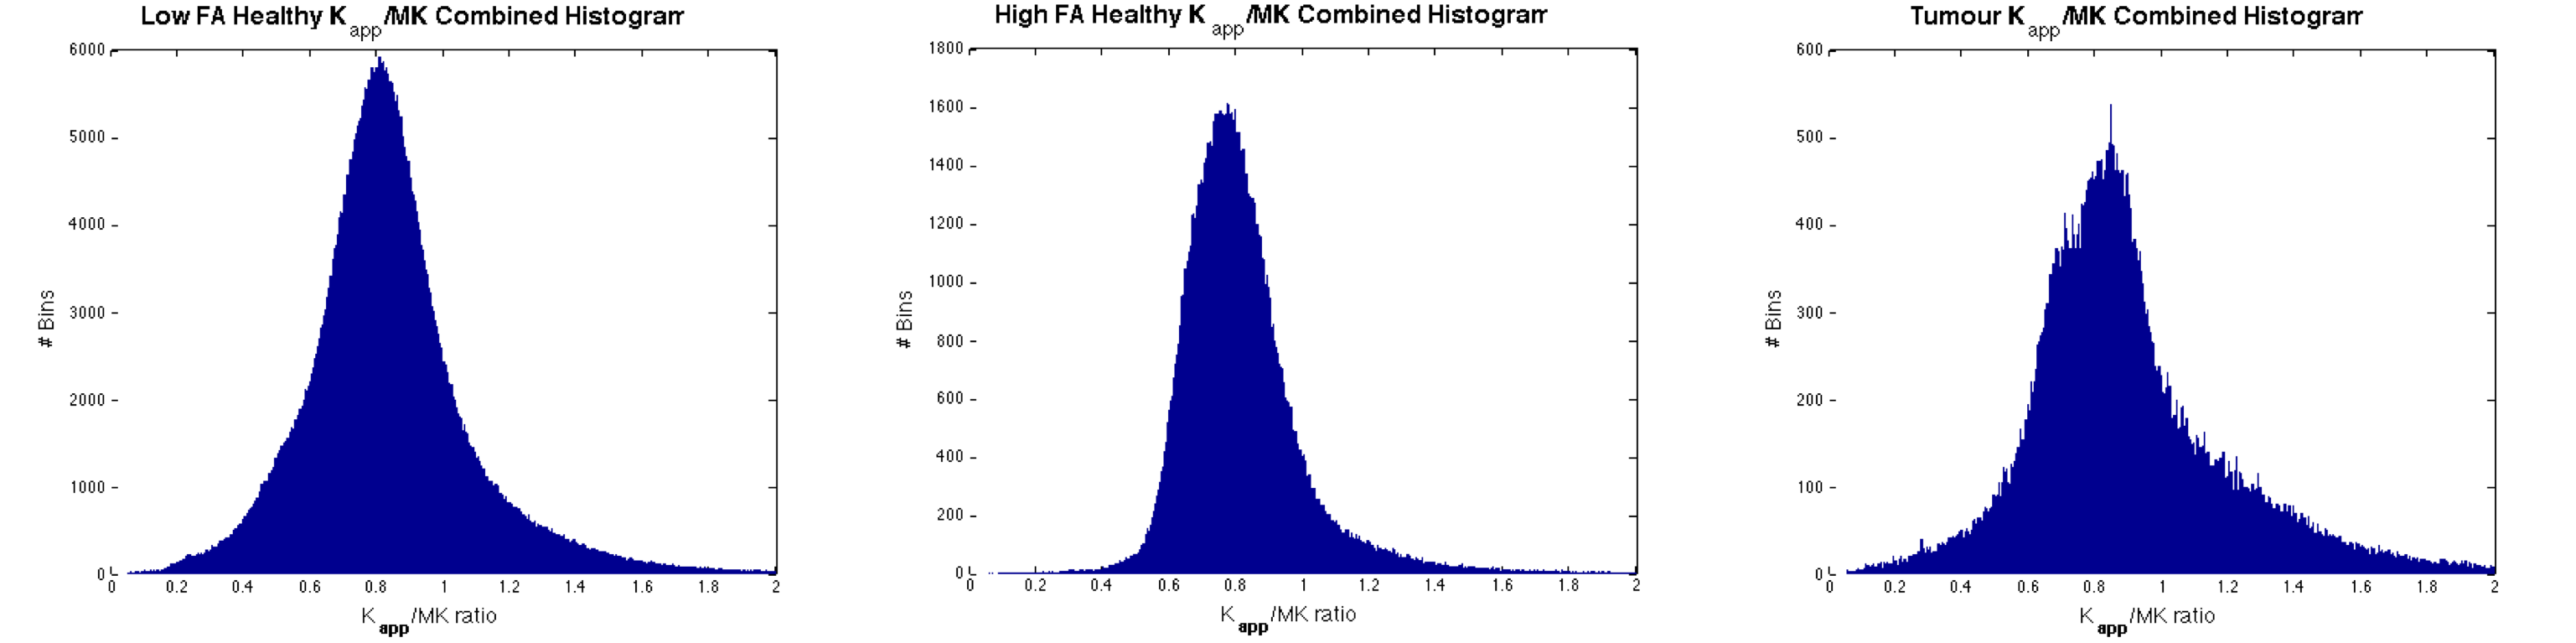
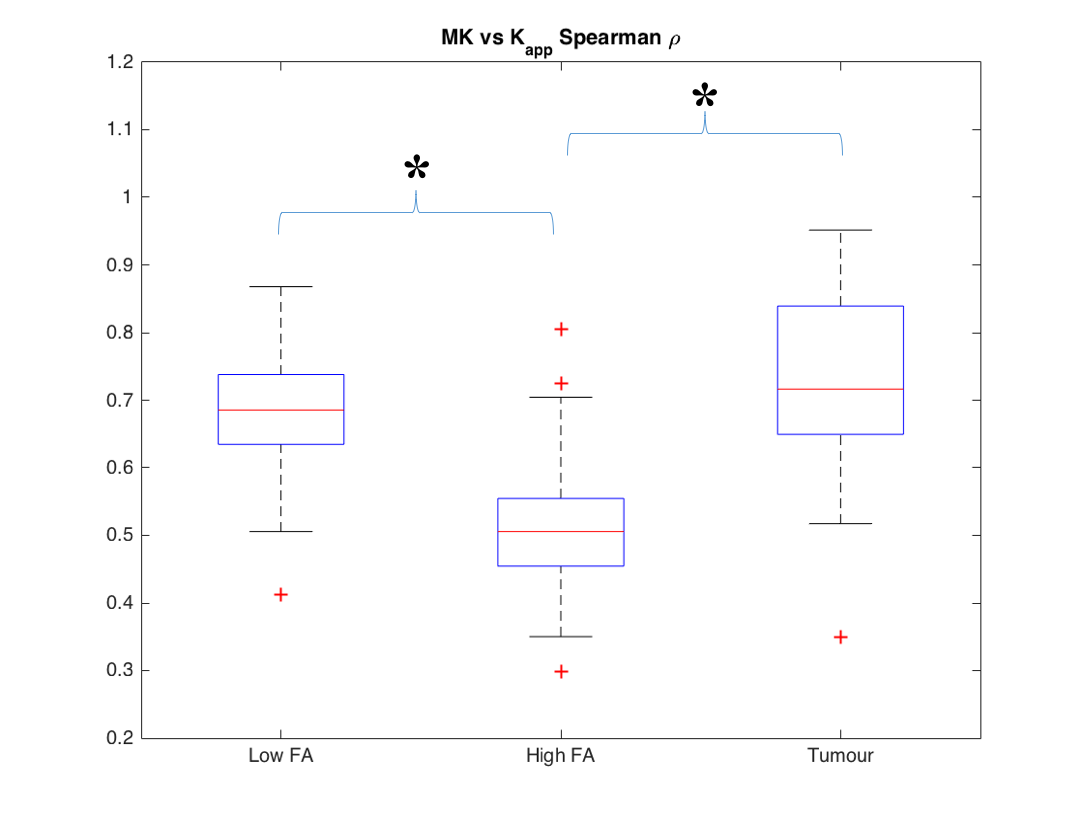
In Figure 1 a slice of a representative patient is shown with the PET mask overlay, for $$$K_{app}$$$, MK and the $$$K_{app}$$$/MK ratio. Histograms of $$$K_{app}$$$/MK ratios are depicted Figure 2. The mode of the $$$K_{app}$$$/MK ratio distribution is 0.8, with 82% of the voxels being below 1. This shows that $$$K_{app}$$$ is systematically underestimated when compared to MK. To correlate MK with $$$K_{app}$$$, Spearman’s $$$\rho$$$ was calculated for all subjects within the high FA, low FA and tumour masks, which are showcased in Figure 3. No significant differences were detected when comparing MK or $$$K_{app}$$$ between the LGG and HGG patients (P>0.05). The differences seen between MK and $$$K_{app}$$$ are likely caused by the lack of directions sampled in the trace protocol. Since trace data are essentially isotropic, it is less sensitive to fibre directionality and to the overall complexity of the microstructures of the brain. This means that $$$K_{app}$$$ will be inherently underestimated. This is also evidenced by the lower correlation values in the high FA voxels. For low FA voxels, diffusion tends to be more isotropic and hence the influence of the lack of directions is lower. This results in a strong correlation between MK and $$$K_{app}$$$. Nevertheless, the high correlation between the metrics, particularly in tumour, shows that contrast can still be preserved.Conclusion
In this study we compared MK with $$$K_{app}$$$ derived from a multi-b-valued protocol in forty brain tumour patients. We found that $$$K_{app}$$$ is consistently lower than MK across subjects, but in tumour and low FA regions there is a significant high correlation between both metrics, which is important to maintain grading power. The current trace protocol was designed to provide more than kurtosis information alone, but could be tailored to the kurtosis relevant acquisition and reduced to approx. 1min (4 diffusion weightings at 3 directions).Acknowledgements
No acknowledgement found.References
[1] S. Van Cauter, J. Verhaart et al, “Gliomas: diffusion kurtosis MR imaging in grading”, Radiology, vol 263(2), pp 492-501, May 2012
[2] J. H. Jensen, J. A. Helpern, A. Ramani, H. Lu, K. Kaczynski, “Diffusion kurtosis imaging: The quantification of non-gaussian water diffusion by means of magnetic resonance imaging”, MRM, vol 53(6), pp. 1432-1440, June 2005
[3] D. K. Jones, "The effect of gradient sampling schemes on measures derived from diffusion tensor MRI: a Monte Carlo study", MRM, vol 51(4), pp. 807-815, Apr 2004
[4] B. Hansen, T. E. Lund, R. Sangill, S. N. Jespersen, “Experimentally and computationally fast method for estimation of a mean kurtosis”, MRM, vol 69(6), pp.1754–1760, June 2013
[5] P.Z. Sun, Y. Wang, E. Mandeville, S.T. Chan, E.H. Lo, X. Ji, “Validation of fast diffusion kurtosis MRI for imaging acute ischemia in a rodent model of stroke”, NMR Biomed, vol 27(11), pp. 1413-1418, Nov 2014
[6] A.-M. Oros-Peusquens, N. J. Shah, “A simple and efficient method for acceleration and denoising of multi-contrast diffusion data: application to q-space and HARDI”,ISMRM, 21st Annual Meeting & Exhibition, 20-26 April 2013, Salt Lake City, Utah, USA
[7] M. Zimmermann, MSc Thesis, RWTH Aachen University, Nov. 2014
[8] J. Verhaart, E. Fieremans, D. S. Novikov, “Diffusion MRI Noise Mapping Using Random Matrix Theory”, MRM, vol 76, pp 1582-1593, October 2016
[9] D. Pauleit, F. Floeth, K. Hamacher, M. J. Riemen-schneider, G. Reifenberger, H.-W. Mu¨ller, K. Zilles, H. H. Coenen, and K.-J. Langen, “O-(2-[18f]fluoroethyl)-l-tyrosine PET combined with MRI improves the diagnostic assessment of cerebral gliomas,” Brain, vol. 128, pp. 678–687, Mar. 2005
[10] R. Neto-Henriques, R., Ferreira, H.A., Correia, M.M., 2015. United Diffusion Kurtosis Imaging (UDKI) toolbox. MAGMA 28 (S1): 511-512.
Figures