1360
Comparison of Renal R2* Analysis Methods1Dept. of Radiology, Medical Physics, Medical Center - University of Freiburg, Germany, Freiburg, Germany, 2Medical Center - University of Freiburg, Germany
Synopsis
BOLD MRI can be applied as an indirect measure of the oxygenation level changes in the kidneys while performing an experiment with a functional renal challenge. These changes are detected by the relaxation rate R2* in the renal cortex and medulla. For R2* analysis different methods are proposed, such as the conventional manual ROI method and a compartmental method. Here, these methods and two further compartmental methods are compared to each other by analyzing full time-resolved renal BOLD MR experiments in healthy volunteers.
Introduction
With time-resolved renal BOLD MRI changes of the oxygenation level in both parenchyma and medulla can be measured indirectly. These changes are induced by a functional challenge1–5 (e.g., by drinking water) which is detected as an R2* change in the renal tissue. The R2* calculation is usually done by the conventional manual ROI method3,6,7. Recently, more global analysis methods were introduced, such as the compartmental method8,9. In this work, the manual ROI method and 3 compartmental methods were compared to each other for renal R2* analysis using the data from BOLD experiments acquired under a water challenge10.Material and Methods
Time-resolved renal BOLD MRI was performed in 6 healthy volunteers who had no food or water at least 6 h before the exam. Up to 7 baseline R2* measurements were applied before the volunteers drank up to 1000 ml tap water in the magnet. Then another 25-40 BOLD data sets were collected over about 50 min. The experiments were done on a 3T whole body system (Siemens PRISMA, Erlangen, Germany) applying a 2D multi-echo GRE sequence using the following imaging parameters: TR = 35 ms, TE1 = 2.42 ms, ΔTE = 2.66 ms, 12 echoes, matrix: 192x192, voxel size: 2.2x2.2x5.0 mm3, a = 25°, GRAPPA with 24 reference lines, bandwidth = 810 Hz/Px, TA = 7.6 s. One coronal slice per kidney was acquired, and the KALIBRI method was implemented for renal motion correction10.
Renal medullar and cortical R2* values are assessed using the manual ROI method (mROI) and 3 compartmental methods. With mROI small regions of interest (ROIs) were drawn manually into medullar and cortical regions, and the mean R2* is calculated for those two tissues separately. The same ROIs are placed into all data of a volunteer, and R2* is assessed for each measurement time point.
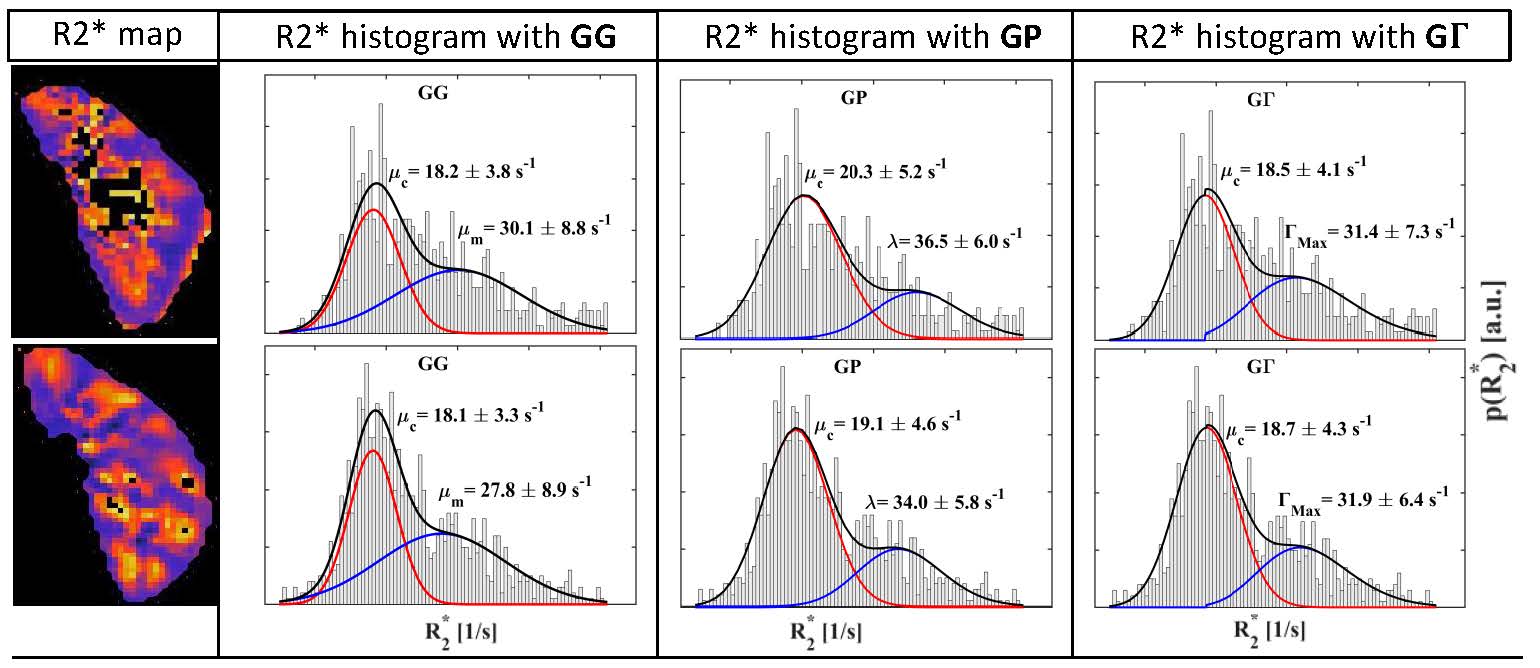
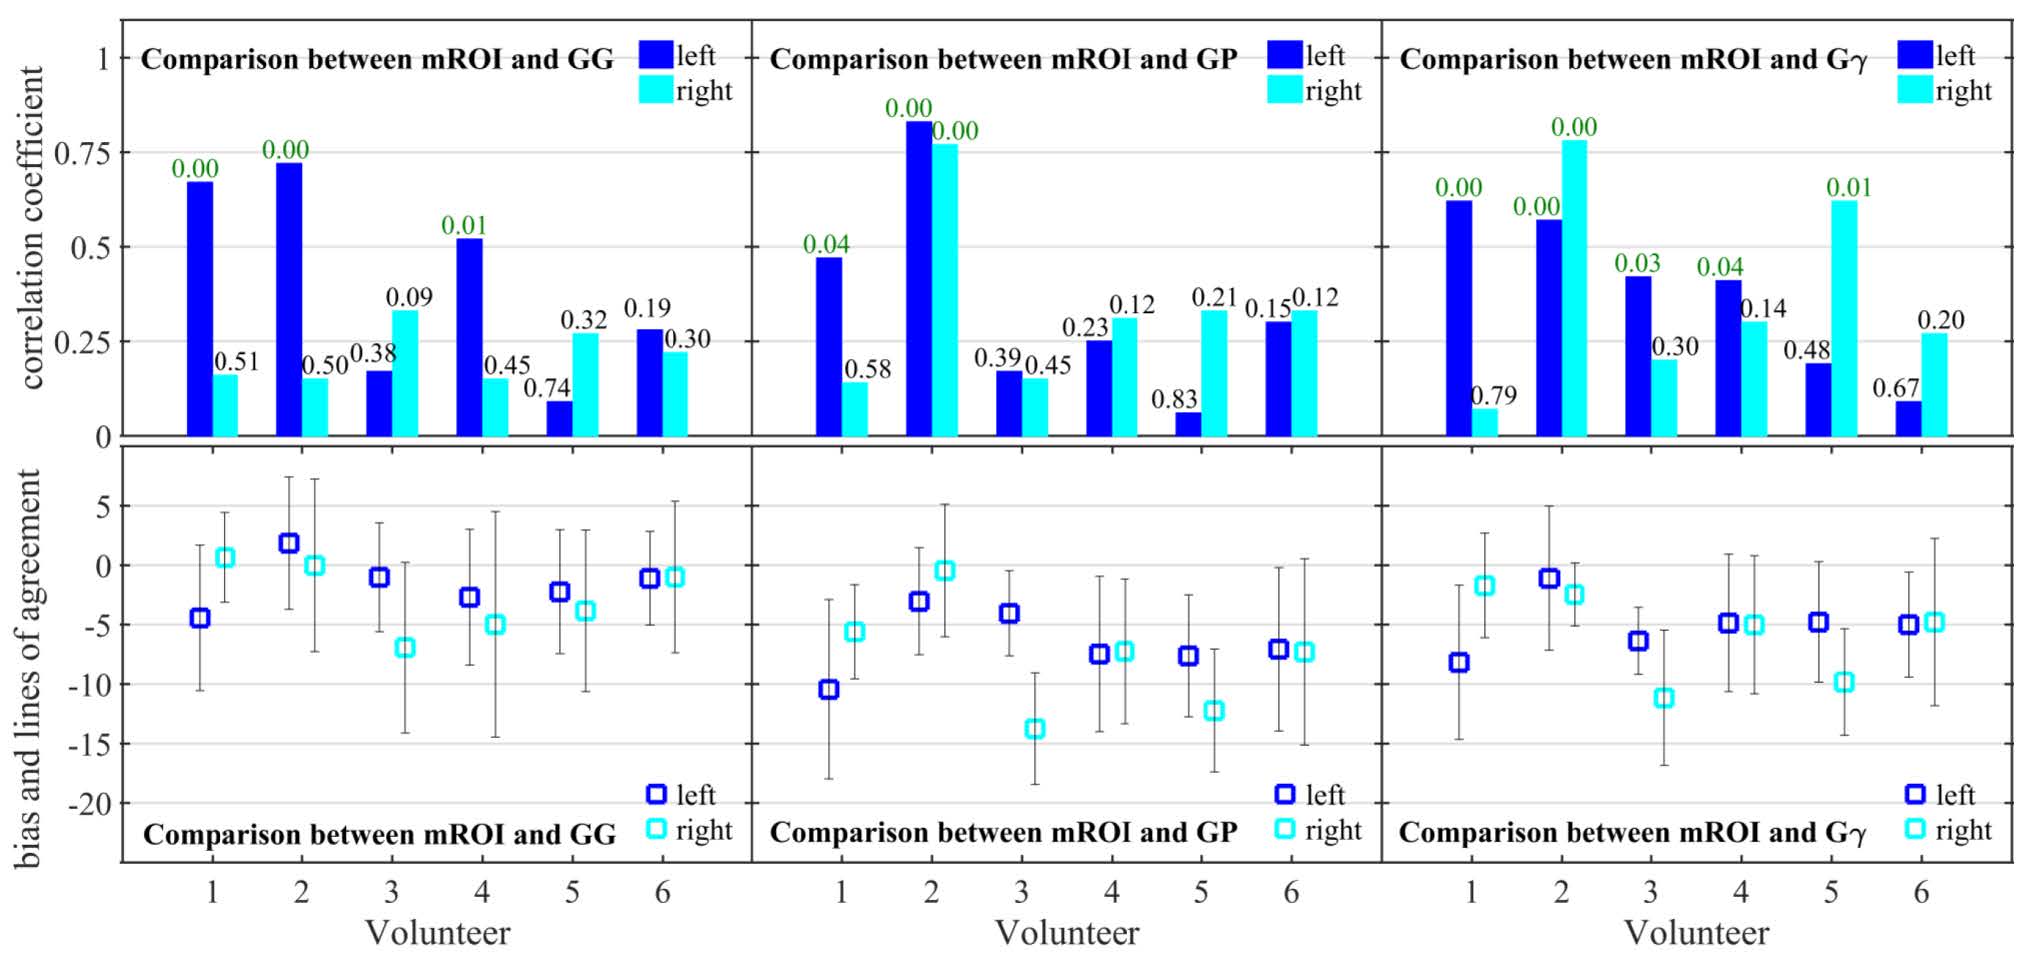
In the compartmental methods, it is assumed that the R2* distribution of the whole kidney shows a bimodal separation into medullar and cortical regions. The sum of 2 probability distribution functions is fitted into the histogram evaluating the mean R2* values of cortex and medulla: Ebrahimi et al.8 empirically assumed the sum of a Gaussian and a Gamma distribution for the cortical and medullary distribution, respectively. Here, the cortical part is also described by a Gaussian distribution, while the medullary part is either another Gaussian (GG), a Poisson (GP), or a Gamma distribution function (GΓ). The fitting procedure was repeated for each time point in the dynamic data set. High R2* values from the calyx system and from renal blood vessels were excluded by setting R2* thresholds. For method comparison Bland-Altman plots for bias and variation analysis were created and Pearson correlation coefficients were calculated.
Results and Discussion
The medullar and cortical R2* values of both kidneys, evaluated by the mROI and the compartmental methods, are presented in Fig. 1. All compartmental methods reduce the R2* fluctuations, but they clearly underestimate the medullar R2* change compared to the manual ROI method. There also differences between the results of the compartmental methods. The fits in the cortical R2* distributions were determined equally in the 3 methods, but there are variations for the medullar values (Fig. 2). The correlations between mROI and the compartmental methods are small (<0.8), where GG show the lowest correlation to mROI, but the lowest bias (Fig. 3). The methods GΓ and GP show no significant difference. Discrepancies between R2* results from mROI and compartmental methods can be caused by background gradients as macroscopic susceptibility11,12 or concomitant gradient fields12, and by the overlap of medullary and cortical distributions in the R2* histogram.Conclusion
Using a compartmental method, global information on R2* changes are provided as an average over the regions. Here, an asymmetric distribution function should be used for the medullar R2* distribution. The manual ROI method provides regional information about renal function, has high sensitivity to R2* changes and is less affected by macroscopic susceptibility effects.Acknowledgements
This work was funded (in part) by the Helmholtz-Alliance ICEMED – Imaging and Curing Environmental Metabolic Diseases, through the Initiative and Network Fund of the Helmholtz Association, and by the DFG projects HA 7006/1-1, and BO 3025/2-2.References
1. Prasad PV. Evaluation of Intra-Renal Oxygenation by BOLD MRI. Nephron Clinical Practice. 2006;103(2):c58–c65.
2. Hofmann L, Simon-Zoula S, Nowak A, Giger A, Vock P, Boesch C, Frey FJ, Vogt B. BOLD-MRI for the assessment of renal oxygenation in humans: Acute effect of nephrotoxic xenobiotics. Kidney International. 2006;70(1):144–150.
3. Li L-P, Halter S, Prasad PV. Blood Oxygen Level-Dependent MR Imaging of the Kidneys. Magnetic Resonance Imaging Clinics of North America. 2008;16(4):613–625. (Genitourinary MRI).
4. Liss P, Cox EF, Eckerbom P, Francis ST. Imaging of intrarenal haemodynamics and oxygen metabolism. Clinical and Experimental Pharmacology and Physiology. 2013;40(2):158–167.
5. Epstein FH, Veves A, Prasad PV. Effect of Diabetes on Renal Medullary Oxygenation During Water Diuresis. Diabetes Care. 2002;25(3):575–578.
6. Prasad PV, Edelman RR, Epstein FH. Noninvasive Evaluation of Intrarenal Oxygenation With BOLD MRI. Circulation. 1996;94(12):3271–3275.
7. Tumkur SM, Vu AT, Li LP, Pierchala L, Prasad PV. Evaluation of intra-renal oxygenation during water diuresis: A time-resolved study using BOLD MRI. Kidney International. 2006;70(1):139–143.
8. Ebrahimi B, Gloviczki M, Woollard JR, Crane JA, Textor SC, Lerman LO. Compartmental Analysis of Renal BOLD MRI Data: Introduction and Validation. Investigative Radiology. 2012;47(3):175–182.
9. Gloviczki ML, Saad A, Textor SC. Blood Oxygen Level Dependent Magnetic Resonance Imaging (BOLD MRI) analysis in Atherosclerotic Renal Artery Stenosis. Current opinion in nephrology and hypertension. 2013;22(5):519–524.
10. Kalis IM, Pilutti D, Krafft AJ, Hennig J, Bock M. Prospective MR image alignment between breath-holds: Application to renal BOLD MRI. Magnetic Resonance in Medicine. 2016 Apr 1 [accessed 2016 Jun 21]. http://onlinelibrary.wiley.com/doi/10.1002/mrm.26247/abstract
11. Reichenbach JR, Venkatesan R, Yablonskiy DA, Thompson MR, Lai S, Haacke EM. Theory and application of static field inhomogeneity effects in gradient-echo imaging. Journal of Magnetic Resonance Imaging. 1997;7(2):266–279.
12. Hofstetter LW, Morrell G, Kaggie J, Kim D, Carlston K, Lee VS. T2* Measurement bias due to concomitant gradient fields. Magnetic Resonance in Medicine. 2016 May 1 [accessed 2016 Aug 1]. http://onlinelibrary.wiley.com/doi/10.1002/mrm.26240/abstract
Figures