1354
Removing the estimation bias due to the noise floor in multi-parameter maps1WIAS, Berlin, Germany, 2Emory University, Atlanta, USA, 3Wellcome Trust Centre for Neuroimaging, UCL Institute of Neurology, University College London, London, United Kingdom, 4Department of Neurophysics, Max Planck Institute for Human Cognitive and Brain Sciences, Leipzig, Germany, Leipzig, Germany, 5Department of Systems Neuroscience, Medical Center Hamburg-Eppendorf, Hamburg, Germany
Synopsis
We demonstrate the bias effect due to the low signal-to-noise ratio of ultra-high resolution (0.5μm isotropic) Multi-Parameter Mapping acquisitions of quantitative R1, R2* and PD maps and develop a method for improved parameter estimation.
Purpose
In recent years Multi-Parameter Mapping (MPM; Weiskopf, 2013; Lutti, 2014) has attracted a lot of interest as a framework for quantitative magnetic resonance imaging of simultaneous estimating the proton density (PD), the longitudinal relaxation rate (R1), and the apparent transverse relaxation rate (R2*). The quantitative nature of these maps is in contrast to standard T1-, T2-, or PD-weighted imaging which acquires intensity values in arbitrary units. The image data obtained in the multi-echo FLASH sequences of MPM can inherently suffer from low signal-to-noise ratio (SNR) and enter the noise floor for longer echo times and very high spatial resolution. As already shown in the context of diffusion weighted MRI (Polzehl & Tabelow, 2016), standard estimation methods ignoring the proper statistical data distribution systematically bias the obtained parameter maps. The bias is more pronounced at lower SNR. Consequently, it becomes a significant problem at higher spatial resolutions (Edelstein, 1986) and hence needs proper handling. In this work, we develop a new method to correct for this bias and demonstrate its effect in MPM data with an isotropic spatial resolution of 500µm acquired on a 3Tesla MRI system.Methods
One healthy subject was scanned on a 3T Tim Trio (Siemens Healthcare, Erlangen Germany) using the radiofrequency (RF) body coil to transmit and a 32 channel RF coil to receive. Calibration data were acquired to correct for inhomogeneities in the RF transmit field followed by the acquisition of spoiled multi-echo 3D fast low angle shot (FLASH) acquisitions with predominantly proton density (PD, TR/flip angle = 32ms/6°) and T1 (32ms/30°) weighting. Data were acquired with occipital coverage at an isotropic resolution of 500µm. Eight equidistant gradient echoes were acquired with alternating readout polarity with echo times ranging from 4.5 to 21.86ms in steps of 2.48ms. The data has been described in detail in Tabelow et al. (2016b).
As in Tabelow et al. (2016a, 2016b) we first estimated the parameters of the ESTATICS model (Weiskopf, 2013) from a single run of the acquired multiple echoes of PD- and T1-weighted volumes. However, in contrast to standard least-squares estimation we applied a quasi-likelihood approach as used in Polzehl & Tabelow (2016) on diffusion data. This additionally required an estimate of the noise parameter of the signal distribution. Here, we applied the method from Tabelow (2015) to obtain (locally varying) noise maps. The ESTATICS parameter maps including R2* were determined using an asymptotically unbiased procedure based on quasi-likelihood estimation. From these, the R1 and PD maps were calculated analytically (Tabelow et al., 2016a, 2016b) using the signal model from Helms et al. (2008). We also applied B1+-field correction (Helms et al., 2008) to the maps. PD values were normalized such that the mean WM value corresponds to 69% as in (Weiskopf et al. 2013).
Results
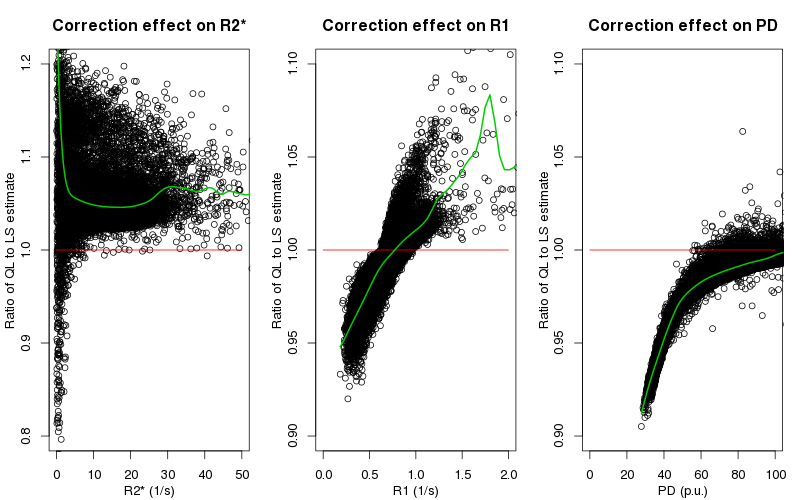
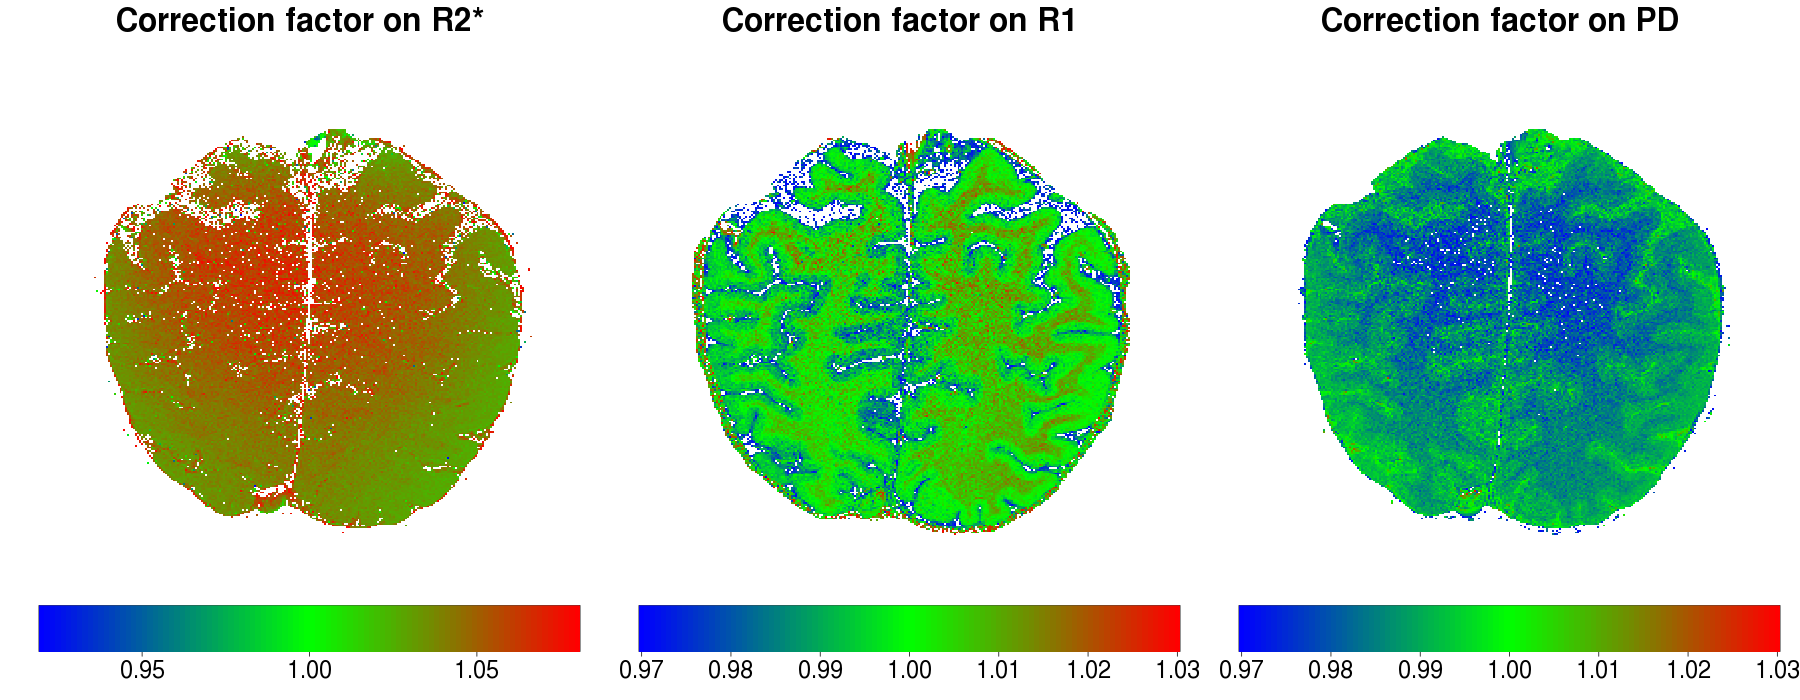
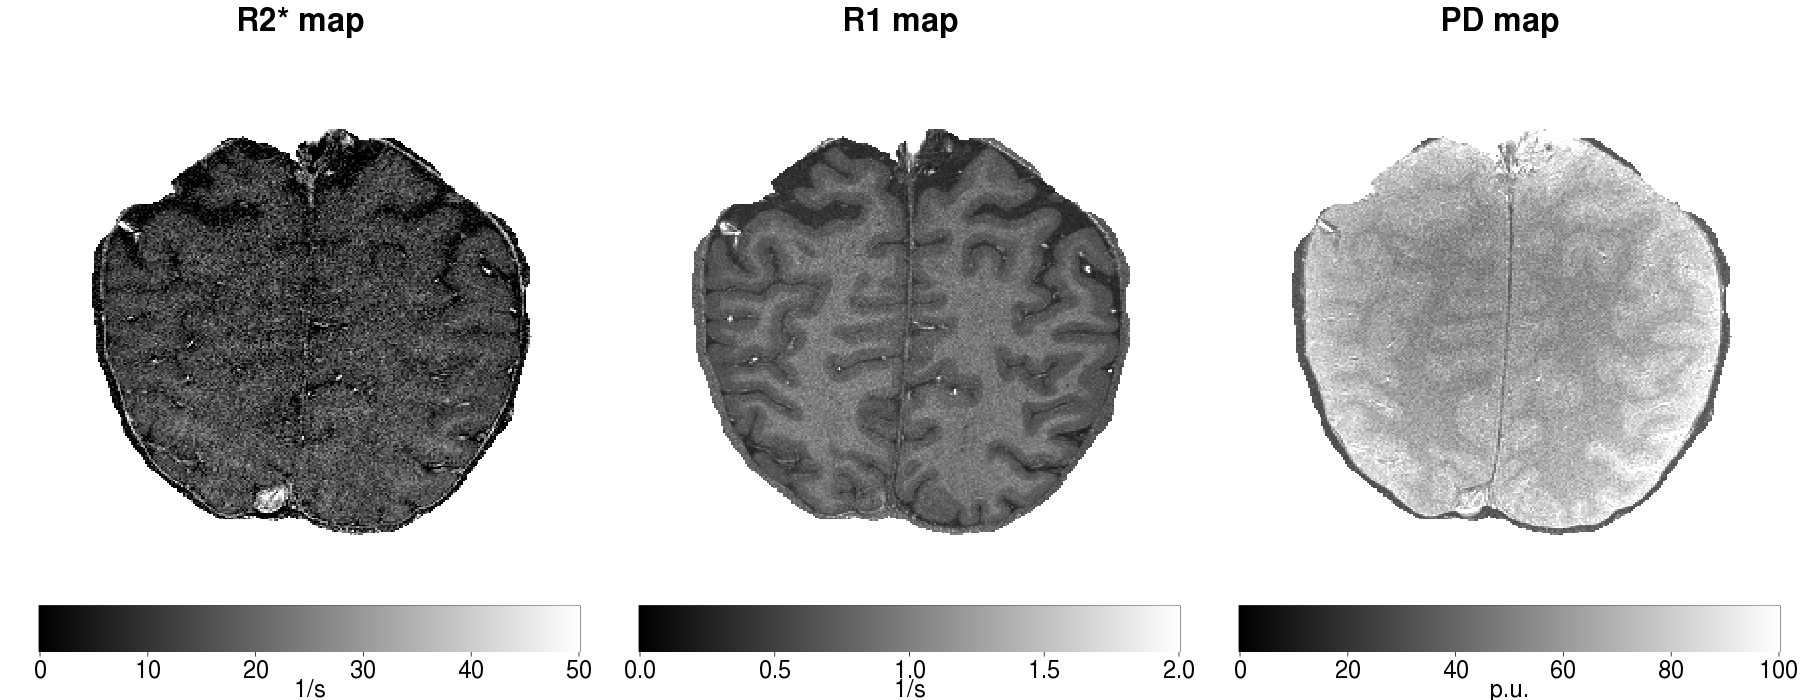
We compared the estimated maps for R1, R2* and PD (i.e., the intensity at echo time zero) using standard least squares estimation (OLS) and the proposed quasi-likelihood method (QL). The ratio of the estimates with and without the correction for one slice in all three maps is shown in Figure 1. There, it can be seen, that OLS systematically underestimates the values for R2* compared to QL. Furthermore, OLS underestimates R1 values especially in grey matter, while overestimating it in white matter areas. Finally, small values of PD are generally underestimated: Such values obviously lead to low SNR, where the estimation bias is expected to be larger. In Figure 2 we show spatial distribution of the ratio of the estimates for all three maps (Figure 3) in this slice.Conclusion
In this work we have shown, that the low SNR in very high resolution MPM acquisitions leads to a significant bias in the estimation of R1, R2*, and PD. This potentially hinders comparison of these quantitative maps across time in longitudinal studies or across sites, especially when the SNR of the acquisitions differs. We also present a method based on quasi-likelihood estimation to correct for this bias that is a result of the difference between the expectation value of the data distribution and the true noise-free value near the noise floor, an effect that is often subsumed under the name Rician bias. The effect might be even more important for ex-vivo imaging, where higher resolutions come with a further deterioration of SNR in each acquisition only compensated by extensive averaging. Even the average of these repeated measurements is affected by this bias as it is related to the mean of the signal distribution rather than the true noise value.Acknowledgements
The research leading to these results has received funding from the European Research Council under the European Union's Seventh Framework Programme (FP7/2007-2013) / ERC grant agreement n 616905. The Wellcome Trust Centre for Neuroimaging is supported by core funding from the Wellcome Trust 0915/Z/10/Z. SM received funding from the EU's Horizon 2020 / MSC grant agreement no. 658589. LR’s work was supported by an Emory University Research Committee grant.References
Edelstein, W., 'The Intrinsic Signal-To-Noise Ratio in NMR Imaging', Magn. Res. Med. 3, 604 (1986).
Helms, G., 'Quantitative FLASH MRI at 3T Using a Rational Approximation of the Ernst Equation', Magn. Res. Med. 59, 667 (2008).
Lutti, A. et al., 'Using high-resolution quantitative mapping of R1 as an index of cortical myelination', NeuroImage 93, Part 2, 176 (2014).
Polzehl, J. & Tabelow, K., 'Low SNR in diffusion MRI models', JASA, published online, (2016) DOI:10.1080/01621459.2016.1222284.
Tabelow, K. et al., 'Local estimation of the noise level in MRI using structural adaptation', Med. Image Anal. 20, 76 (2015).
Tabelow, K. et al., 'Enabling very high resolution quantitative MRI at 3T', ISMRM (2016a).
Tabelow, K. et al., 'How to achieve very high resolution quantitative MRI at 3T?', HBM (2016b).
Weiskopf, N. et al., 'Quantitative multi-parameter mapping of R1, PD*, MT, and R2* at 3T: a multi-center validation', Front Neurosc. 7, 95 (2013).
Weiskopf, N. et al., 'Estimating the apparent transverse relaxation time (R2*) from images with different contrasts (ESTATICS) reduces motion artifacts', Front. Neurosc. 8, 278 (2014).
Figures