1352
Contrast matching of ultra-high resolution minimum deformation averaged MRI models to facilitate computation of a multi-modal model of the human brain1Centre for Advanced Imaging, University of Queensland, Brisbane, Australia, 2Department of Health Science and Technology, Aalborg University, Aalborg, Denmark
Synopsis
A contrast matching algorithm was developed to enable non-linear coregistration of multi-modal minimum deformation averaged MRI models using cross correlation. The registration results show that the contrast conversion enables non-linear multi-modal coregistration.
Purpose
7T minimum deformation averaging (MDA) MRI models of the human brain allow the delineation of small structures present in the population with very high resolution. These models therefore enable the detection of small brain structures not visible in individual datasets [1]. A 7T MDA multi-modal model of the human brain could for example be used to segment individual hippocampal subfields and yield a neuroimaging marker for the early detection of Alzheimer’s disease (AD) [2,3,4]. Multi-modal registration methods utilizing intensity space mapping have successfully been developed in previous studies [5,6]. However, to date no non-linear multi-modal registration method has been developed with the aim to generate a 7T MDA multi-modal model.In this work, a method that aligns two 7T MDA human brain models with different contrasts is presented.
Method
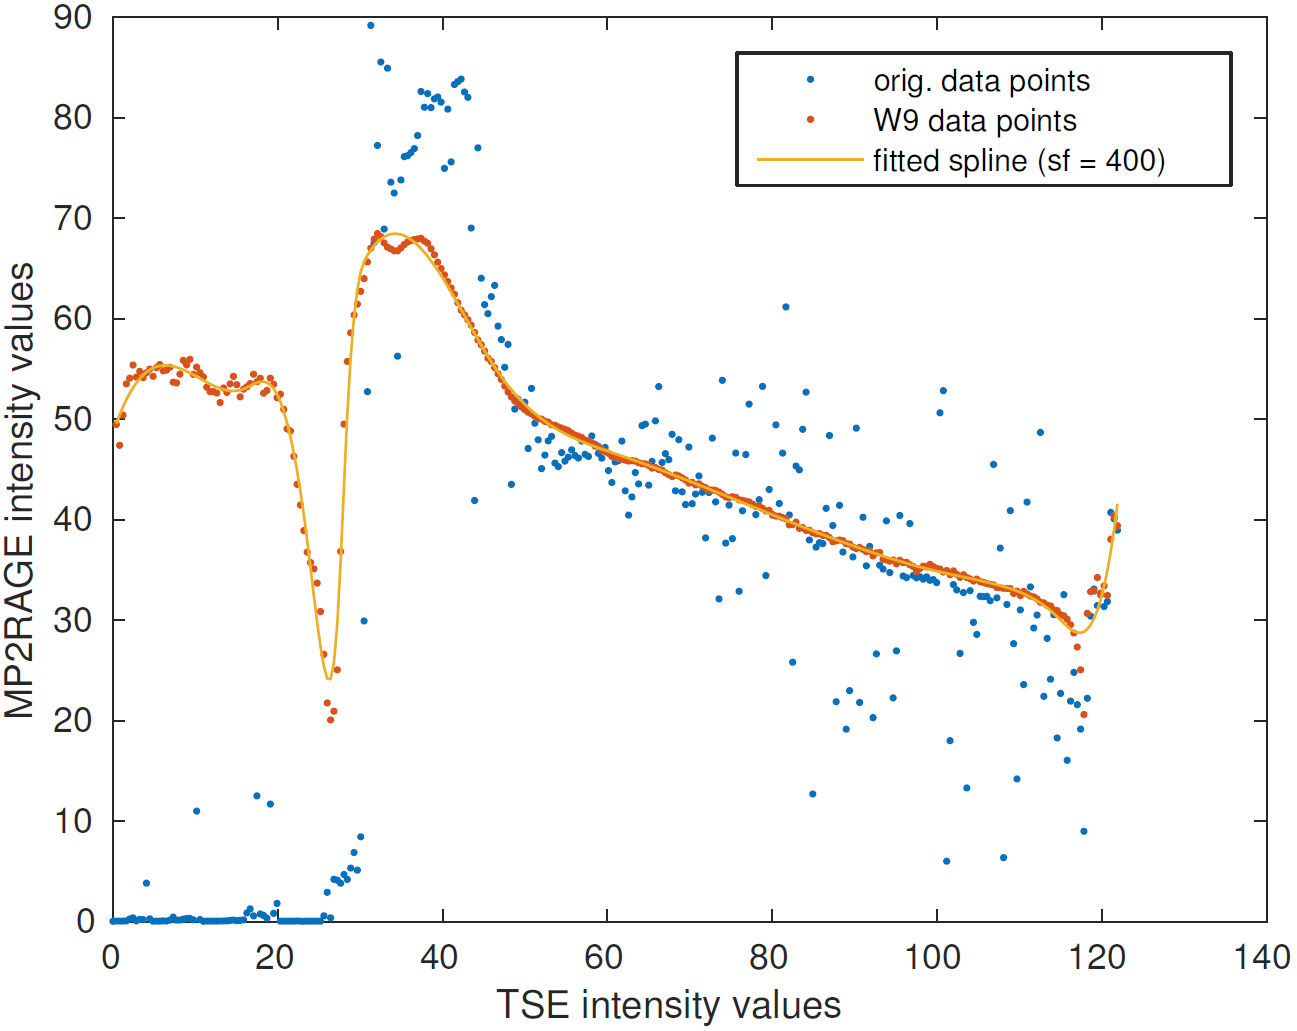
The two contrasts used in this study are Turbo Spin Echo (TSE) and Magnetization-Prepared 2 Rapid Acquisition Gradient Echo (MP2RAGE). The 7T MDA TSE model and the 7T MDA MP2RAGE model have a resolution of 0.3mm isotropic and 0.2mm isotropic, respectively. A more detailed description of the models can be found in [1]. The TSE model and the MP2RAGE model were initially aligned through manual rotation and rigid registration with mutual information as similarity measure using minctracc [7]. Hereafter, a SyN registration with cross correlation using antsRegistration [8] was performed to align finer brain structures. To enable utilization of cross correlation, a contrast-matching algorithm was developed and applied to the TSE model prior to registration.The contrast-matching algorithm (CMA) is based on voxel intensity location, and the voxel intensity relation between the different contrasts is determined by looking up the most frequent corresponding voxel intensity value in the MP2RAGE model for every unique voxel intensity value in the TSE model. In case of two or more most frequent corresponding voxel intensity values, an average of these is computed as the corresponding value. To achieve a function for contrast conversion, a spline with a smoothing factor of 400 was fitted to the data points, describing the voxel intensity relation (see Figure 1).
To increase the robustness of the algorithm to initial misalignment between the two models and sources of noise, the target contrast (here, the MP2RAGE model) was initially blurred with a 9x9x9 voxels smoothing kernel. Furthermore, the brain extraction tool (BET) [9] was used to extract the brain and thereby remove influence from the background.
The algorithm is available on GitHub: https://github.com/NIF-au/cma
Results
Representative results are shown in Figure 1, 2, 3 and 4.
Figure 1 shows the voxel intensity relation between the TSE and the MP2RAGE contrast.
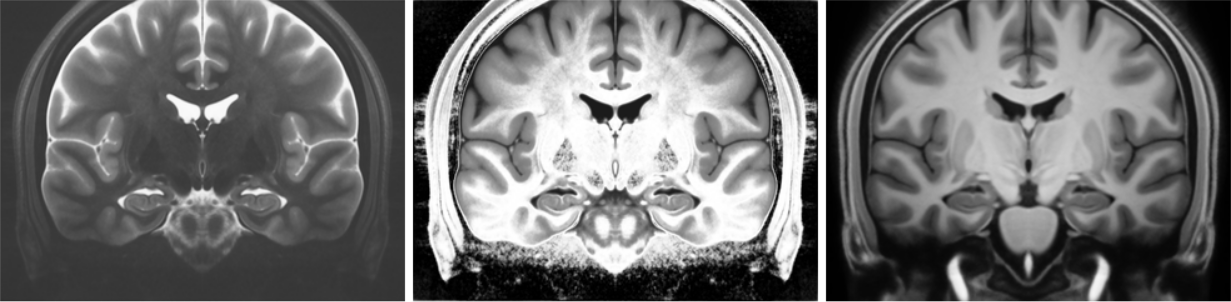
Figure 2 shows coronal views of the two MRI models (left and right, respectively) and the contrast matched TSE model (middle).
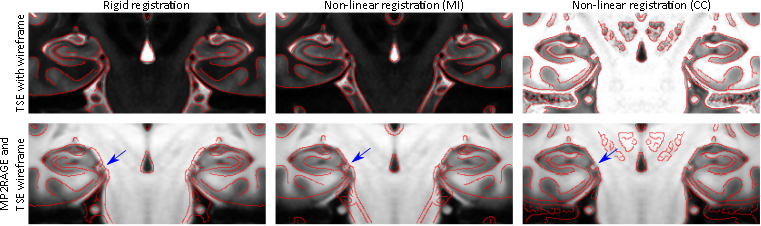
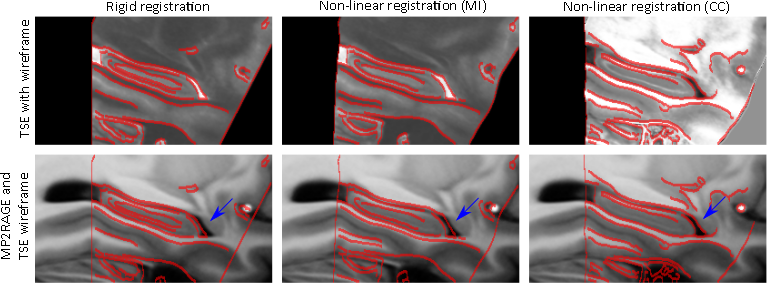
Figure 3 and Figure 4 show coronal and sagittal views of the initial alignment, the alignment after performing a non-linear (SyN) multi-modal registration using mutual information, and the alignment after applying the proposed CMA and performing a non-linear (SyN) registration using cross correlation, respectively.
All views are sections of the models capturing the hippocampus.
Discussion
The results show that the proposed CMA can be used for contrast matching as the contrast matched TSE model resembles the MP2RAGE contrast, only with slightly brighter intensities in the white matter region. Furthermore, the results demonstrate, that using CMA and cross correlation in a non-linear multi-modal registration results in an improved alignment of the two models compared to the initial alignment and compared to the result from a non-linear multi-modal registration using mutual information (see Figure 3 and 4). However, the registration is not perfect in regions with low contrast in one of the modalities, like the midbrain.Conclusion
By means of the developed CMA, non-linear registration using cross correlation of two 7T MDA models of different contrast was enabled. Results showed, that this approach improved the alignment of the models compared to an initial alignment obtained by means of manual rotation and rigid registration using mutual information, and compared to an alignment obtained by means of a non-linear multi-modal registration using mutual information. However, future work is needed to achieve an even better alignment of the models to create a versatile brain model for research and clinical applications.Acknowledgements
MB acknowledges funding from Australian Research Council Future Fellowship grant FT140100865.SB acknowledges funding from UQ Postdoctoral Research Fellowship grant and an NVIDIA Hardware Seed Grant.
JBM and NJ acknowledges funding from the following Danish private foundations: Otto Mønsteds Foundation, Knud Højgaards Foundation, Augustinus Foundation, Oticon Foundation, Nordea Foundation, Marie and M.R Richters Foundation, Viggo and Pedersens Foundation, and Danish Tennis Foundation.
The authors acknowledge the facilities of the National Imaging Facility (NIF) at the Centre for Advanced Imaging, University of Queensland.
References
[1] Janke A. L., O'Brian K., Bollmann S., Kober T., and Barth M., A 7T Human Brain Microstructure Atlas by Minimum Deformation Averaging at 300 μm. ISMRM 2016, Singapore
[2] Wisse L.E.M., Gerritsen L., Zwanenburg J.J.M., Kuijf H.J., Luijten P.R., Biessels G.J., and Geerlings M.I., Subfields of the hippocampal formation at 7 T MRI: In vivo volumetric assessment, NeuroImage, 61(4):1043-1049, jul 2012.
[3] Boutet C., Chupin M., Lehéricy S., Marrakchi-Kacem L., Epelbaum S., Poupon C., Wiggins C., Vignaud A., Hasboun D., Defontaines B., Hanon O., Dubois B., Sarazin M., Hertz-Pannier L., and Colliot O., Detection of volume loss in hippocampal layers in alzheimer's disease using 7 t MRI: A feasibility study. NeuroImage: Clinical, 5:341-348, 2014.
[4] Winterburn J.L., Pruessner J.C., Chavez S., Schira M.M., Lobaugh N.J., Voineskos A.N., and Chakravarty M.M,. A novel in vivo atlas of human hippocampal subfields using high-resolution 3T magnetic resonance imaging. NeuroImage, 74:254-265, jul 2013.
[5] Andronache A., von Siebenthal M., Székely G., and Cattin Ph., Non-rigid registration of multi-modal images using both mutual information and cross-correlation, Medical image analysis, 12(1):3-15, 2008
[6] Jager F. and Hornegger J, Nonrigid registration of joint histograms for intensity standardization in magnetic resonance imaging, IEEE transactions on medical imaging, 28(1):137-150, 2009
[7] Collins L., minctracc, 1995. URL http://bic-mni.github.io/man-pages/man/minctracc
[8] Brian B. Avants B.B., Tustison N., and Johnson H., Advanced Normalization Tools (ANTS), 2014
[9] Jenkinson M., Pechaud M., and Smith S., BET2: MR-based estimation of brain, skull and scalp surfaces. In Eleventh Annual Meeting of the Organization for Human Brain Mapping, 2005
Figures