1351
Cross-Modality MR Image Reconstruction: CT-Constrained Anisotropic Diffusion to Preserve Edge Information in MRI of an Ancient Mummified Hand1Dept. of Radiology, Medical Physics, Medical Center – University of Freiburg, Freiburg, Germany, 2Institute of Evolutionary Medicine, Medical Faculty, University of Zürich, Zürich, Switzerland
Synopsis
Constrained reconstruction is making use of additional image information to improve the precision in the reconstruction of undersampled MR data. Here we use co-registered CT-data as an anisotropic diffusion constraint to improve sharpness in short T2* images reconstructed from undersampled 3D UTE data of a mummified human hand. The results are compared to other established reconstruction methods.
Introduction
Sequences with ultrashort echo times (UTE) can be used to acquire MR images from tissues with sub-millisecond T2* such as bones1. This information can be important in positron emission tomography (PET) to estimate absorption coefficients in bone, or it can be used to image ancient remains (e.g., Egyptian mummies) which inherently have very short T2*s. Edges in UTE images suffer from blurring due to T2* relaxation during acquisition, and reduction of readout lines results in further loss of details. In order to reduce the blurring artifacts, we propose an anisotropic diffusion reconstruction method with a CT-based constraint. The algorithm preserves the edge information via non-homogeneous MR data filtering using information from co-registered CT data of higher spatial resolution of the same specimen.Materials and Methods
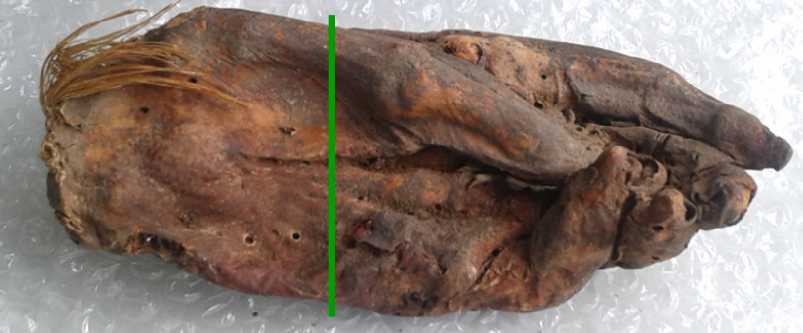
To show that the proposed reconstruction method improves image quality of undersampled data from a 3D UTE sequence, MR data of an ancient mummified human hand (ca. 1500-1100 BC, Fig. 1) with T2* relaxation times of 200-550 µs 2 was acquired. MR data were measured with a 3D UTE sequence on a 3T clinical scanner (Prisma Fit; SIEMENS Healthcare, Erlangen, Germany) with a custom build Rx/Tx solenoid coil using the following acquisition-parameters: FoV = 190 mm, Bandwidth = 2520 Hz/Pixel, TE = 70 µs, TR = 5 ms, α = 21 °, 4 averages, 12500 Spokes with 128 points per spoke. Additionally, high resolution (0.32x0.32x1 mm/Pixel) Dual Energy CT images (80 kV, 140 kV) of the specimen were acquired (SOMATOM; SIEMENS Healthcare, Erlangen, Germany). First, MR images were reconstructed with Kaiser-Bessel (KB) gridding and Hanning filtering onto a 192×192×192 matrix (undersampling factor 9.2). Subsequently, the CT images were aligned to the MR coordinate system using open source software (3D Slicer, version 4.5). Then, an iterative reconstruction using an anisotropic diffusion (AD) constraint3 based on co-registered CT data was used:
$$J(\boldsymbol\rho)=||\boldsymbol A\cdot\boldsymbol\rho - \boldsymbol y||^2 - \lambda_D\int\boldsymbol\rho\nabla(\boldsymbol D\nabla\boldsymbol\rho)\quad\text{with}\quad\boldsymbol D=\left(\boldsymbol 1-\frac{\boldsymbol g\cdot\boldsymbol g^T}{|\boldsymbol g|^2}/\sqrt{1+\boldsymbol g^2/a^2}\right)$$
where $$$\boldsymbol A$$$ denotes the system matrix that maps the image $$$\boldsymbol\rho$$$ to the raw data $$$\boldsymbol y$$$. In the regularization term the gradient operator $$$\boldsymbol g$$$ is applied to the CT image $$$(\boldsymbol g=\nabla Im_\mathrm{CT})$$$. The parameters $$$\lambda_D$$$ and $$$a$$$ were chosen to yield the best edge preservation in the image. The performance of the proposed AD reconstruction is compared to KB reconstruction and another iterative reconstruction, where $$$\boldsymbol D$$$ was set to the identity matrix, resulting in an unconstrained L2-based isotropic filter (L2).
Results and Discussion
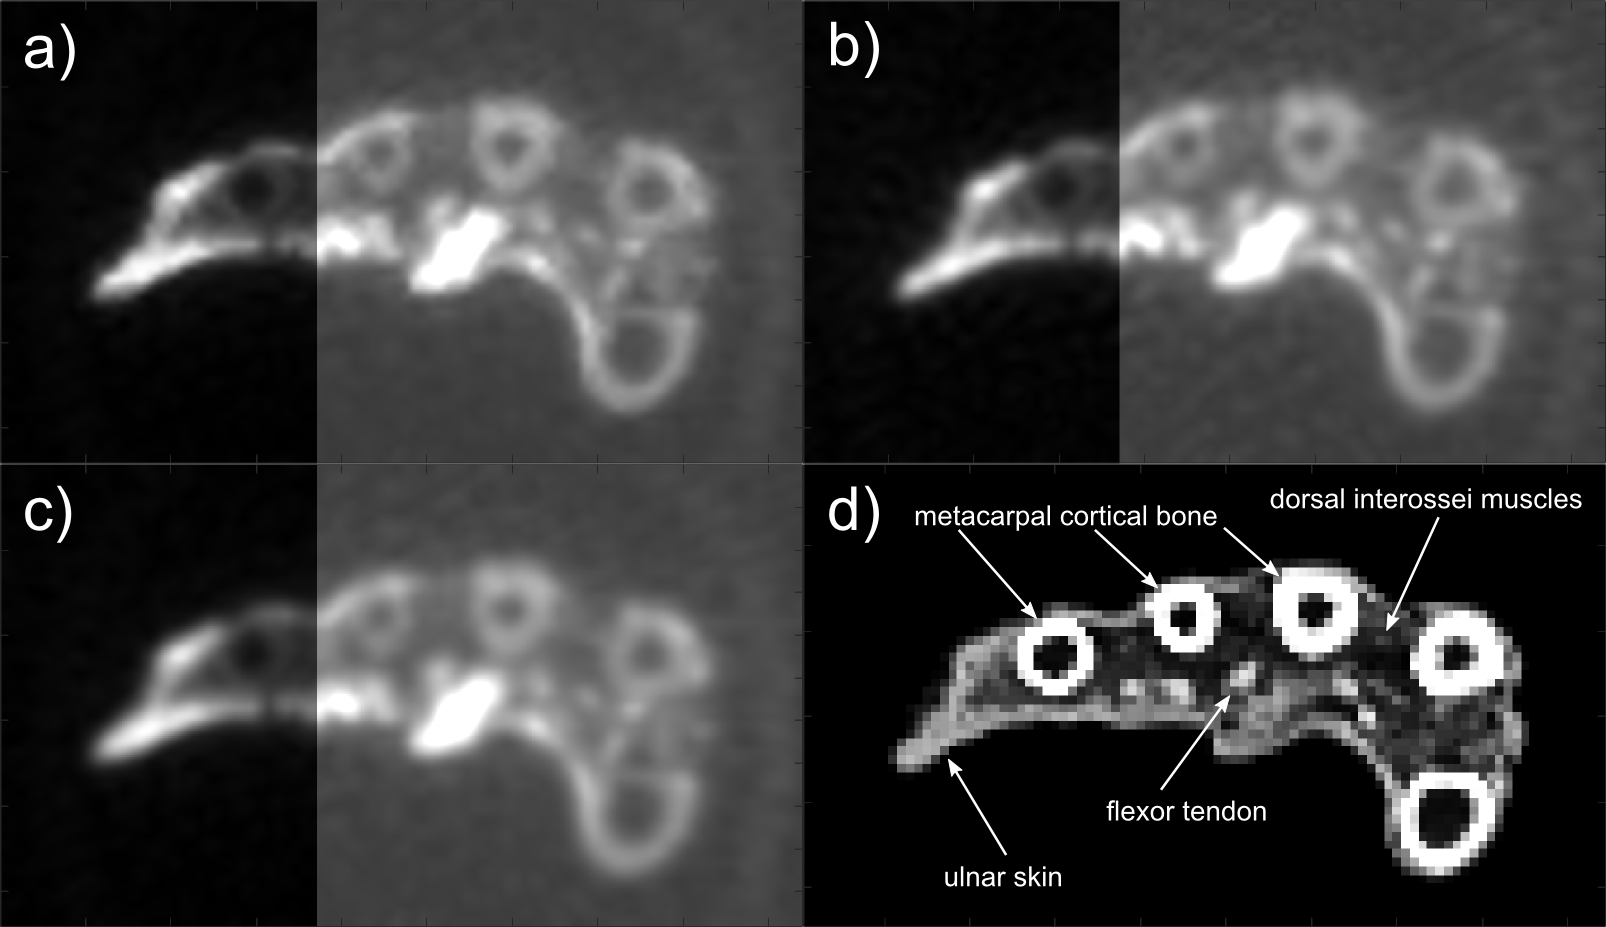
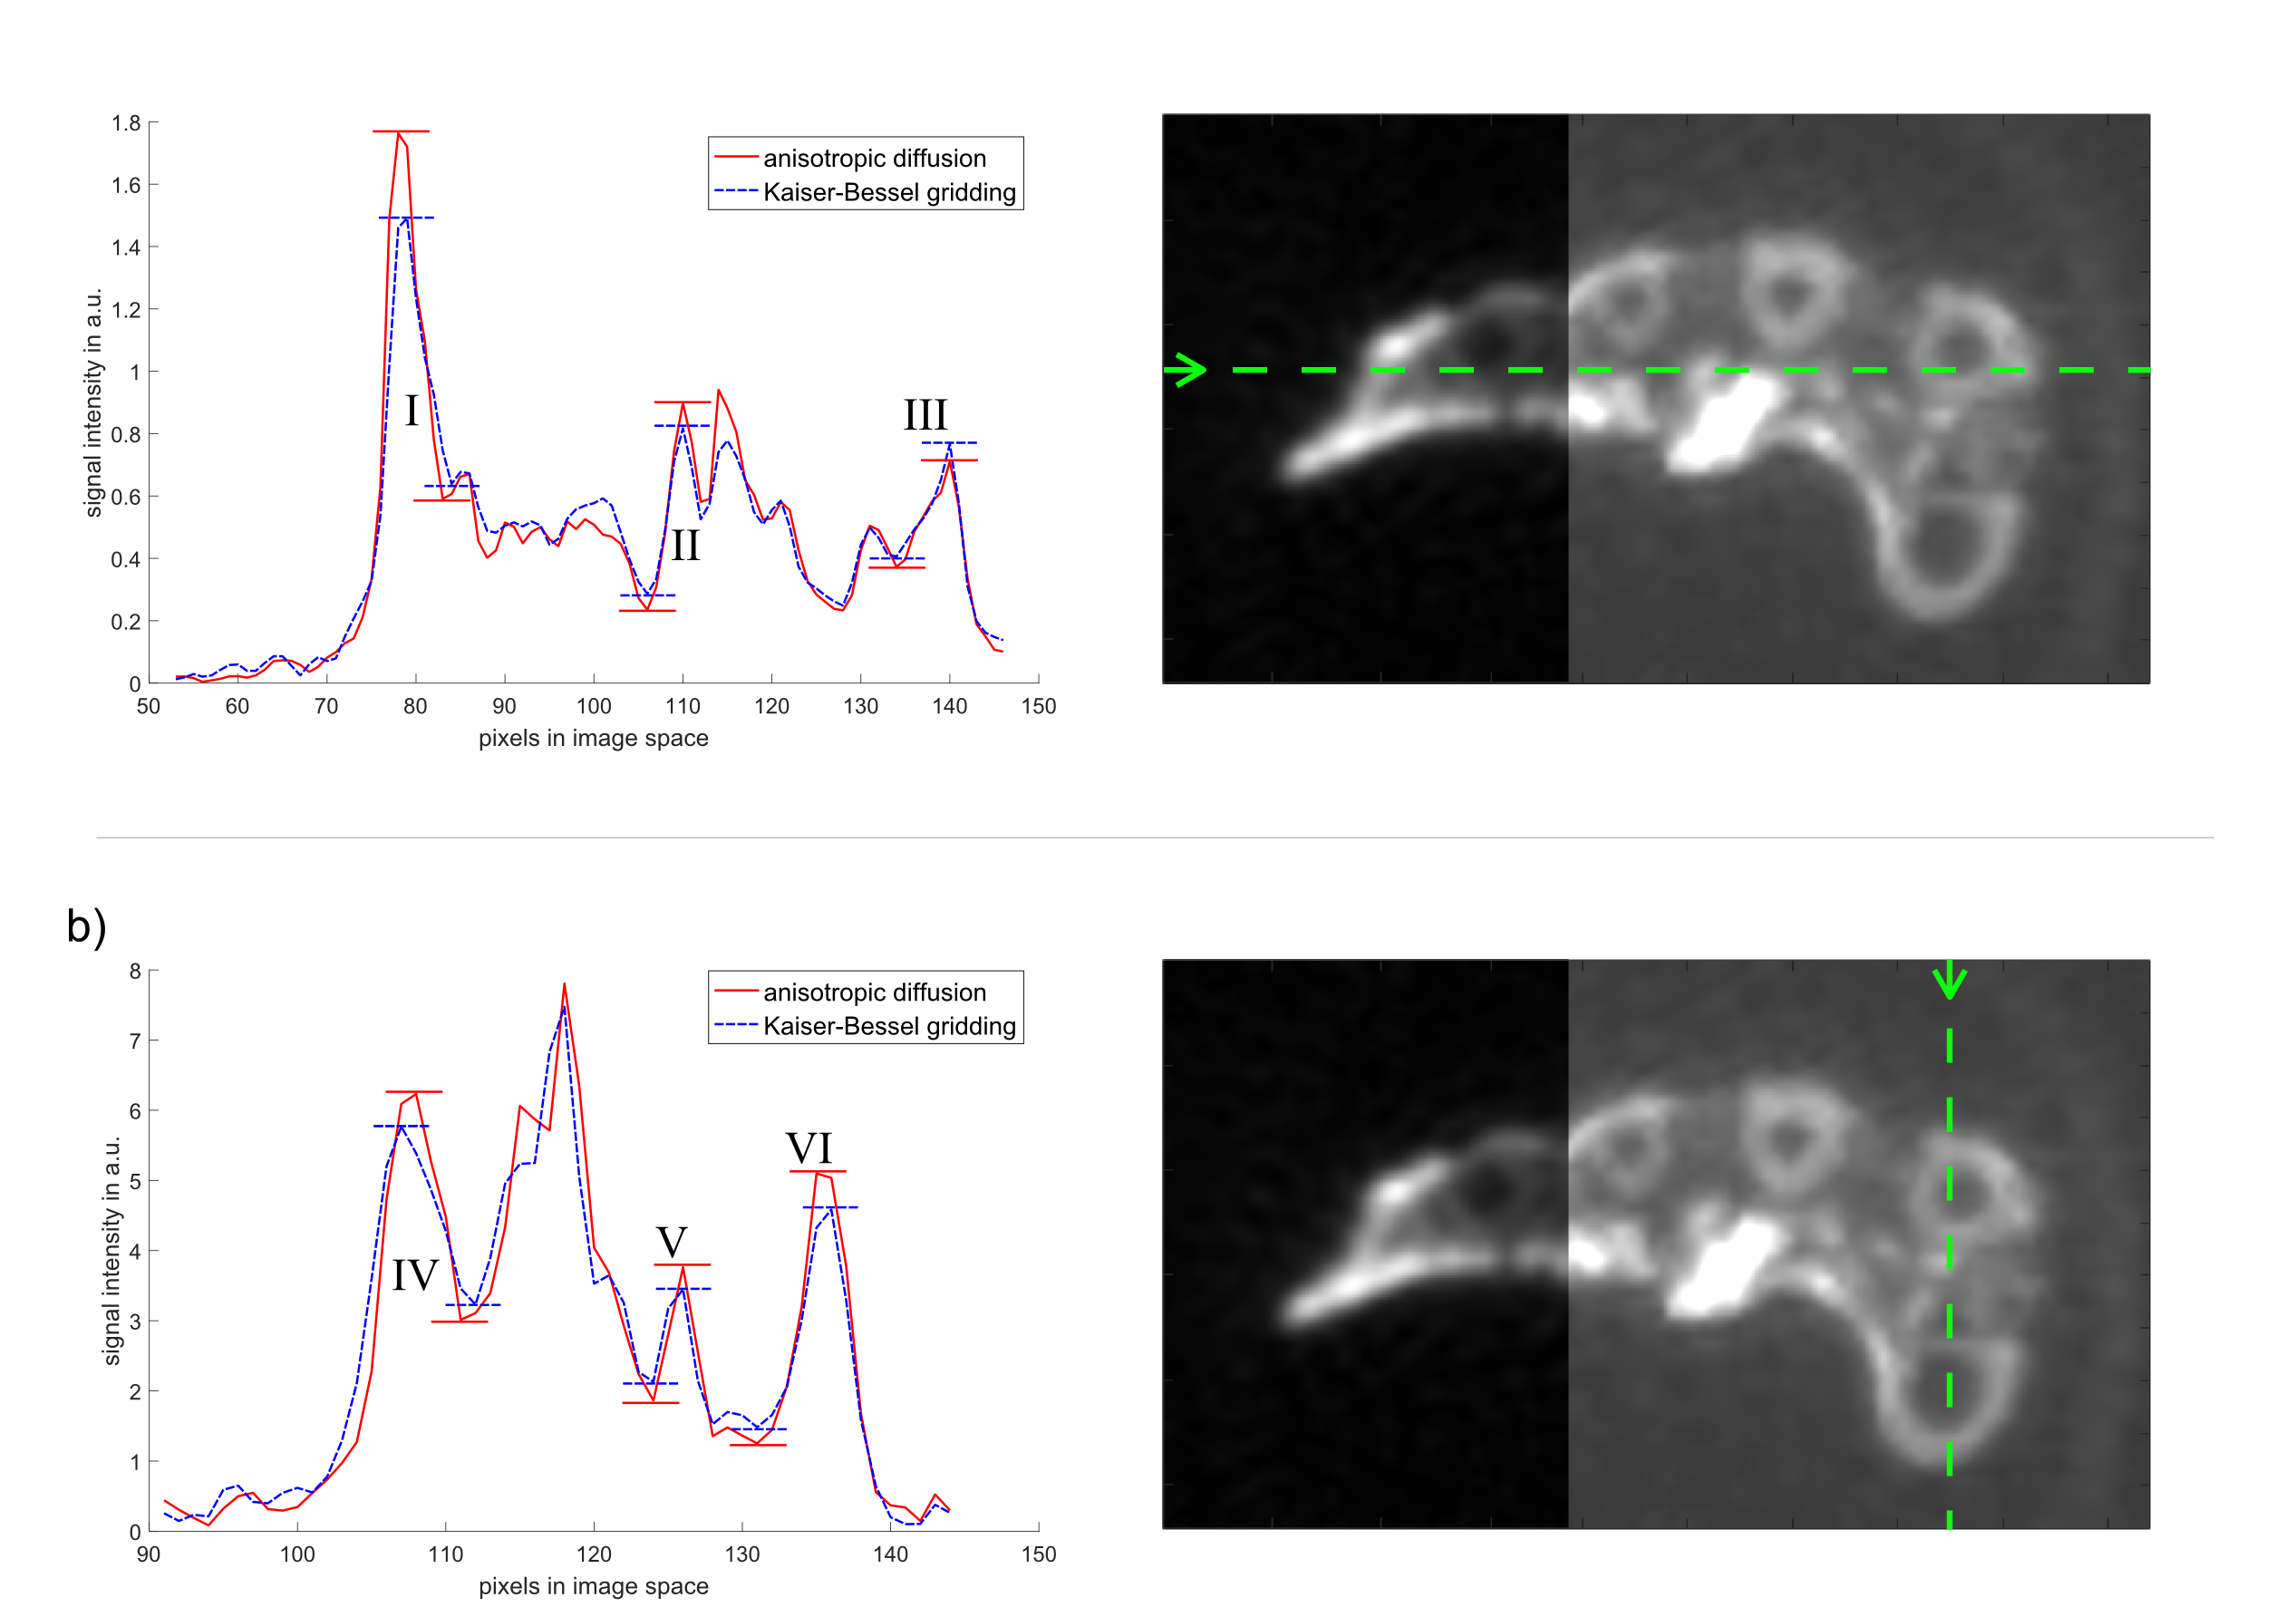
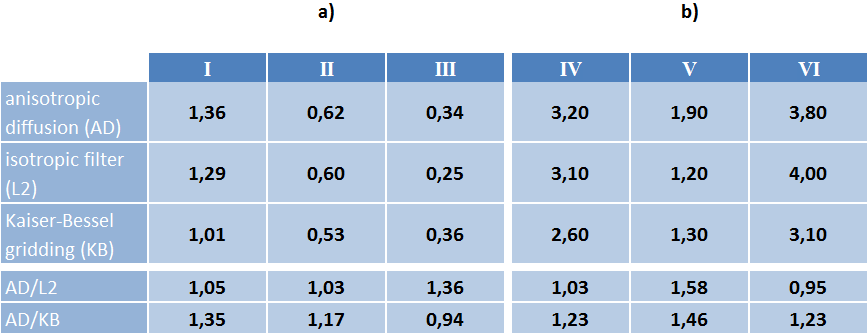
Figure 2 shows an identical axial view across the middle of the metacarpal bones from the mummified hand for AD $$$(\lambda_D=0.1, a=10)$$$, L2 $$$(\lambda_D=0.1)$$$ and KB reconstructions. The CT data used for the AD constraint is also shown. The image reconstructed with anisotropic diffusion using a CT constraint retains sharper interfaces between tissues than conventional KB gridding or L2 reconstruction. Peak-to-peak values in the profile plots (Fig. 3) taken from the data along the indicated lines are used to quantify the improved sharpness of the image (Tab. 1). The profile plots for AD and KB reconstruction show the improvement of image sharpness for different structures in the specimen, where an increase in peak-to-peak values is associated with increased sharpness of the image (Fig. 3). In most of the analyzed structures AD reconstruction yields increased sharpness of up to 45% compared to KB reconstruction (Tab. 1). Except for the transition cortical bone – skin – air (III) where low contrast of the skin in CT images may be responsible for less selective edge preservation. In comparison with L2 reconstruction, AD reconstruction also shows an increase in sharpness, in one region of more than 50%. The AD reconstructed image yields reduced background noise in the area outside the object compared to the KB reconstructed image. However, no significant improvement of background noise can be seen when comparing AD to L2, since AD reconstruction behaves like L2 in areas of constant image values, which is the case for CT data outside of the hand.
Conclusion
The proposed iterative reconstruction algorithm with CT-based constraint was shown to retain edge information in images from tissues with very short T2* values and low abundance of water, that were reconstructed from highly undersampled 3D UTE data. The image shows less blurring than images that were reconstructed with Kaiser-Bessel gridding or using an iterative reconstruction with an isotropic L2-based filter. The proposed reconstruction is suitable for applications where high resolution CT data is available and strong undersampling is imposed by other factors, such as limited acquisition time.Acknowledgements
Grant support from the Deutsche Forschungsgemeinschaft (DFG) under grant numbers BO 3025/8-1 and UL 1187/6-1 is gratefully acknowledged.References
1. Berker Y, Franke J, Salomon A, Palmowski M, Donker HC, Temur Y, Mottaghy FM, Kuhl C, Izquierdo-Garcia D, Fayad ZA, Kiessling F, Schulz V. (2012), MRI-based attenuation correction for hybrid PET/MRI systems: a 4-class tissue segmentation technique using a combined ultrashort-echo-time/Dixon MRI sequence. J. Nucl. Med. May 1, 2012 vol. 53 no. 5 796-804
2. Özen, A. C., Ludwig, U., Öhrström, L. M., Rühli, F. J. and Bock, M. (2016), Comparison of ultrashort echo time sequences for MRI of an ancient mummified human hand. Magn. Reson. Med., 75: 701–708.
3. Kurzhunov D, Borowiak R, Wagner P, Reisert M, Bock M. Proton-Constrained CMRO2 Quantification with Direct 17O-MRI at 3 Tesla. In: In proceedings of 23rd annual meeting of ISMRM; Toronto, Ontario, Canada. ; 2015. p. 2450.
Figures