1348
A Comparison of Optimised Single-Shot MR Fingerprinting Pulse Sequence Designs.1FMRIB, Nuffield Department of Clinical Neuroscience, University of Oxford, Oxford, United Kingdom, 2Radcliffe Department of Medicine, University of Oxford, Oxford, United Kingdom
Synopsis
The parameter mapping accuracy of MR Fingerprinting (MRF) relies on specific signal patterns for each set of parameters. Choice of sequence design and acquisition parameters are two aspects that affect this. We optimised the TR and Flip Angle (FA) of a selection of simulated single-shot MRF designs, based on Inversion-Recovery Gradient Echo (IR-GRE), GRE, Spin Echo (SE) and IR-SE sequences. We compared the parameter assignment accuracy of each optimised design. Our results suggest that GRE-based sequences should be used for single-shot MRF.
Purpose
To compare the parameter mapping accuracy of optimised single-shot MR fingerprinting (MRF) pulse sequence designs via simulations.
Introduction
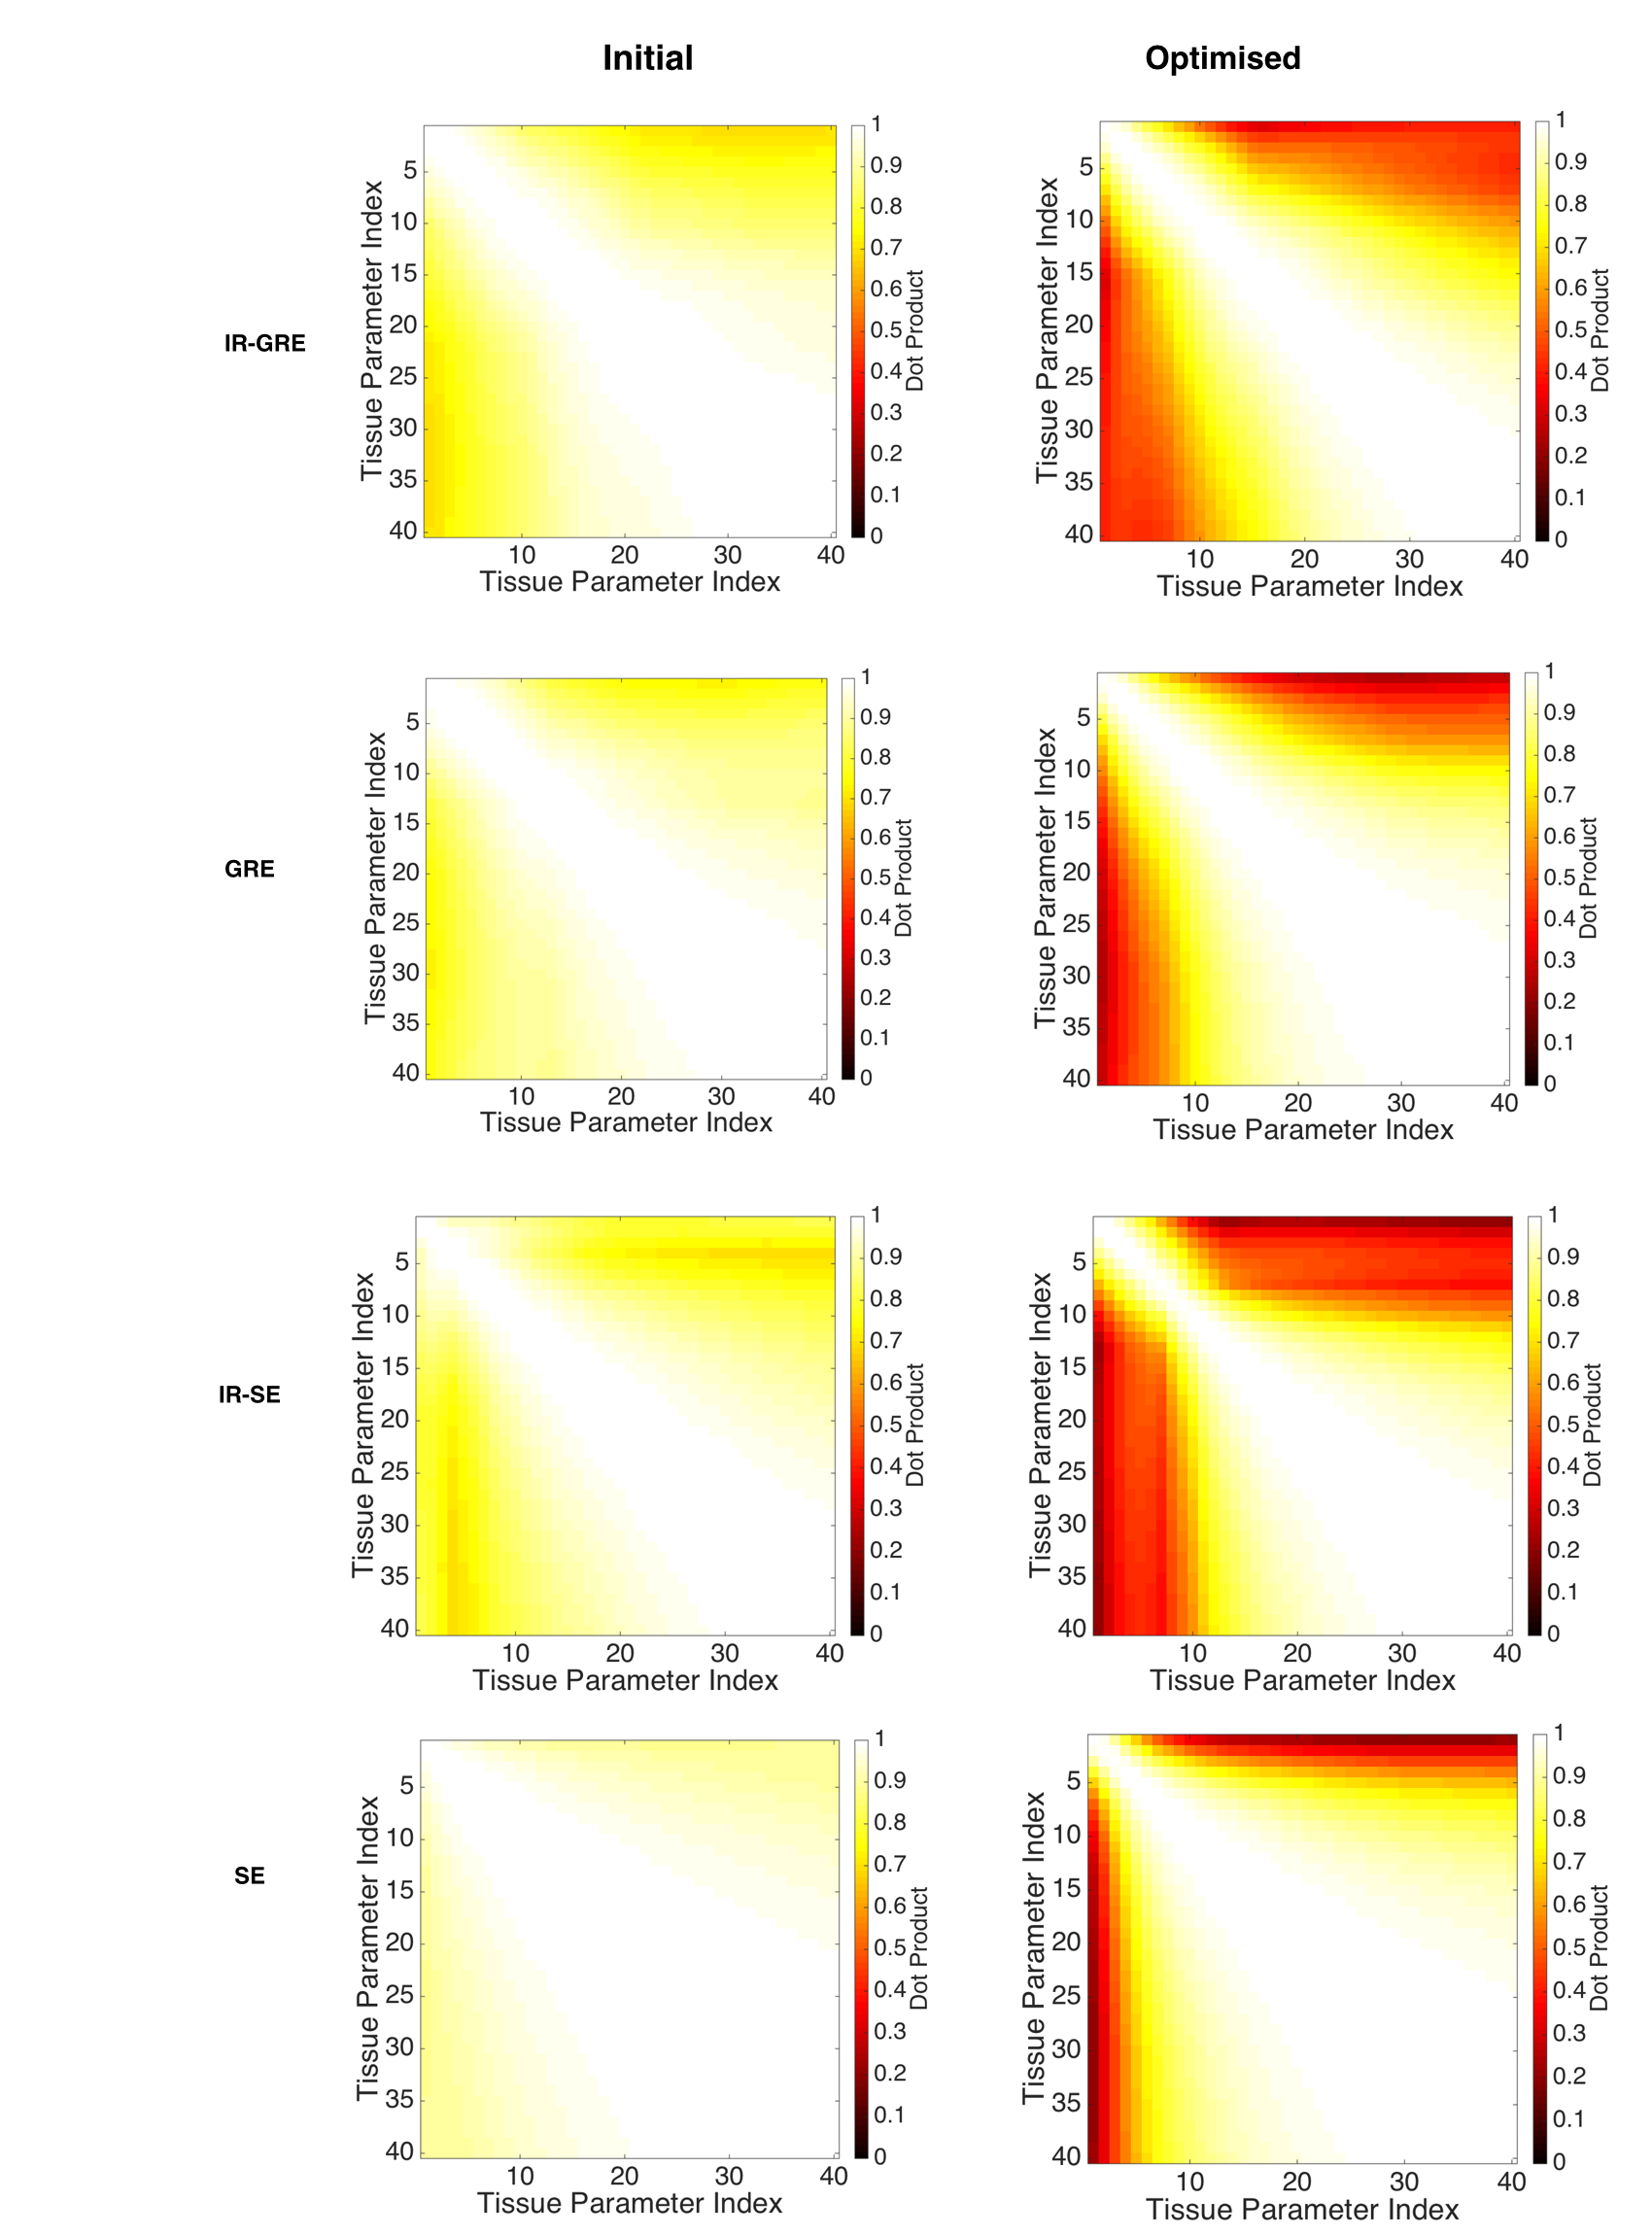
Magnetic Resonance Fingerprinting (MRF) enables multiple tissue parameter maps to be obtained using one scan1. The accuracy of MRF relies on each set of parameters producing a specific pattern of signal evolution over the sequence. Therefore it is important to optimise an MRF acquisition scheme to minimise the similarity of signal time courses from tissues with different parameters2,3. For a given acquisition schedule MRF takes the dot product of the acquired data and a dictionary of signal patterns (simulated from different combinations of T1 and T2). Ideal optimisation would provide a purely diagonal matrix of dot products (i.e. all generated time courses orthogonal to each other). Sequence type (e.g. Gradient Echo (GRE), Spin-Echo (SE) etc.) is another aspect to be considered in optimisation. A performance comparison of optimised MRF sequence designs would provide a rationale for sequence choice and insight into the effects of different sequence components on parameter assignment accuracy. MRF is commonly implemented using interleaved spiral sampling of k-space to achieve fast data acquisition. However, single-shot GRE and SE sequences have also been used2,3, with benefits such as providing no under-sampling artefacts and requiring simple image reconstruction. Here we optimised the TR and excitation Flip Angle (FA) values of a selection of MRF pulse sequence designs, within single-shot regimes. We compared the resulting dot product matrices, as well as the tissue parameter assignment accuracy for a range of T1 and T2 values.Methods
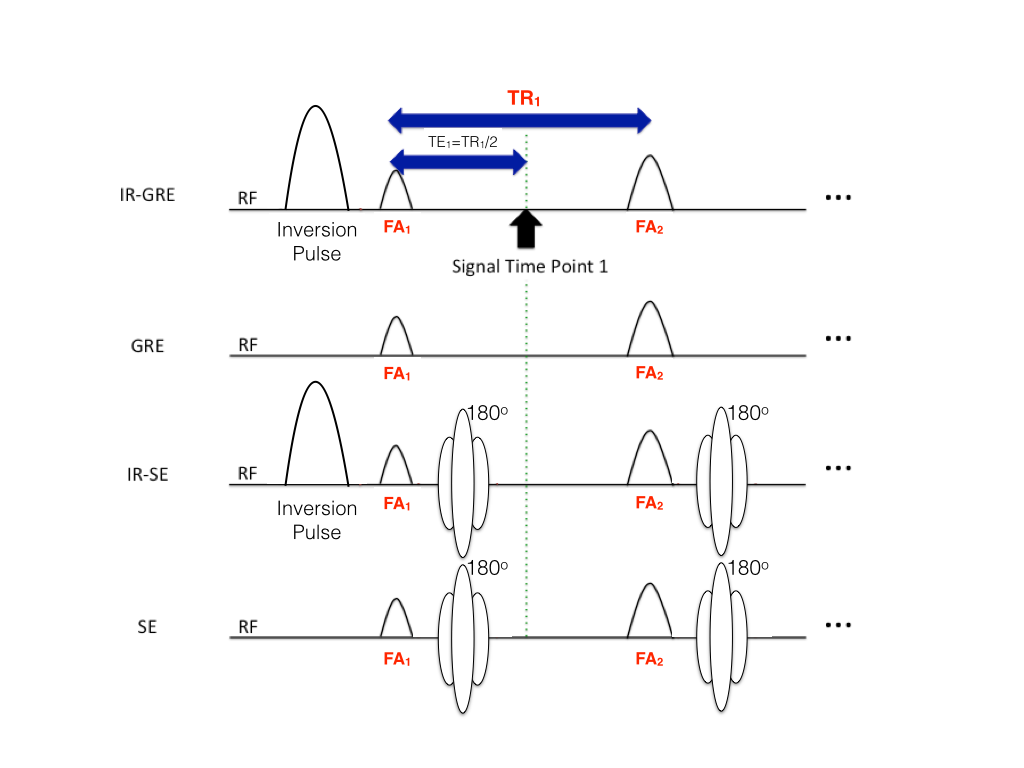
We optimised four single-shot sequence types (Fig. 1) from identical initial acquisition schedules: 1) Inversion-Recovery Gradient-Echo (IR-GRE), 2) GRE, 3) IR Spin-Echo (IR-SE) and 4) SE. As in a previous demonstration of single-shot GRE MRF3 each sequence length was set at 16 time points. The initial acquisition schedule was randomly sampled from a normal distribution: TR mean/variance = 300ms/100ms, FA mean/variance = 50 degrees/10 degrees. Extended Phase Graph (EPG) implementations4 were used for all simulations, with absolute signal values recorded. At each optimisation step 40 signal time courses were generated from pairs of 40 values of arrayed (min:increment:max) T1 (300:100:4200ms) and T2 (100:40:1660ms). These values were chosen to approximately cover the typical range of T1 and T2 in the human brain. A vector x of TR and FA was then altered to minimise the following cost function:
$$ \sum_{i < j} = \textbf{D(x)}_{ij}^2$$
where D is a matrix of 40x40 dot products with column and row indices i and j, respectively. A non-linear constrained solver3 was used for optimisation, more specifically: the MATLAB (The Mathworks, Inc.) fmincon function with no equality constraints and a 1000 iteration limit. The square term in the cost function was chosen to further penalise large dot products. Parameter upper/lower bounds were TR = 500ms/130ms and FA = 90degrees/10degrees, which are achievable ranges for real single-shot experiments. Dictionaries were built for each schedule using the T1 and T2 values from the optimisation. Synthetic data were generated by adding Gaussian noise to each dictionary entry (SNR = 30) before assigning tissue parameters via dictionary lookup. Noise was added using 100 different random seeds, resulting in 100 assignments of each pair of T1 and T2.
Results & Discussion
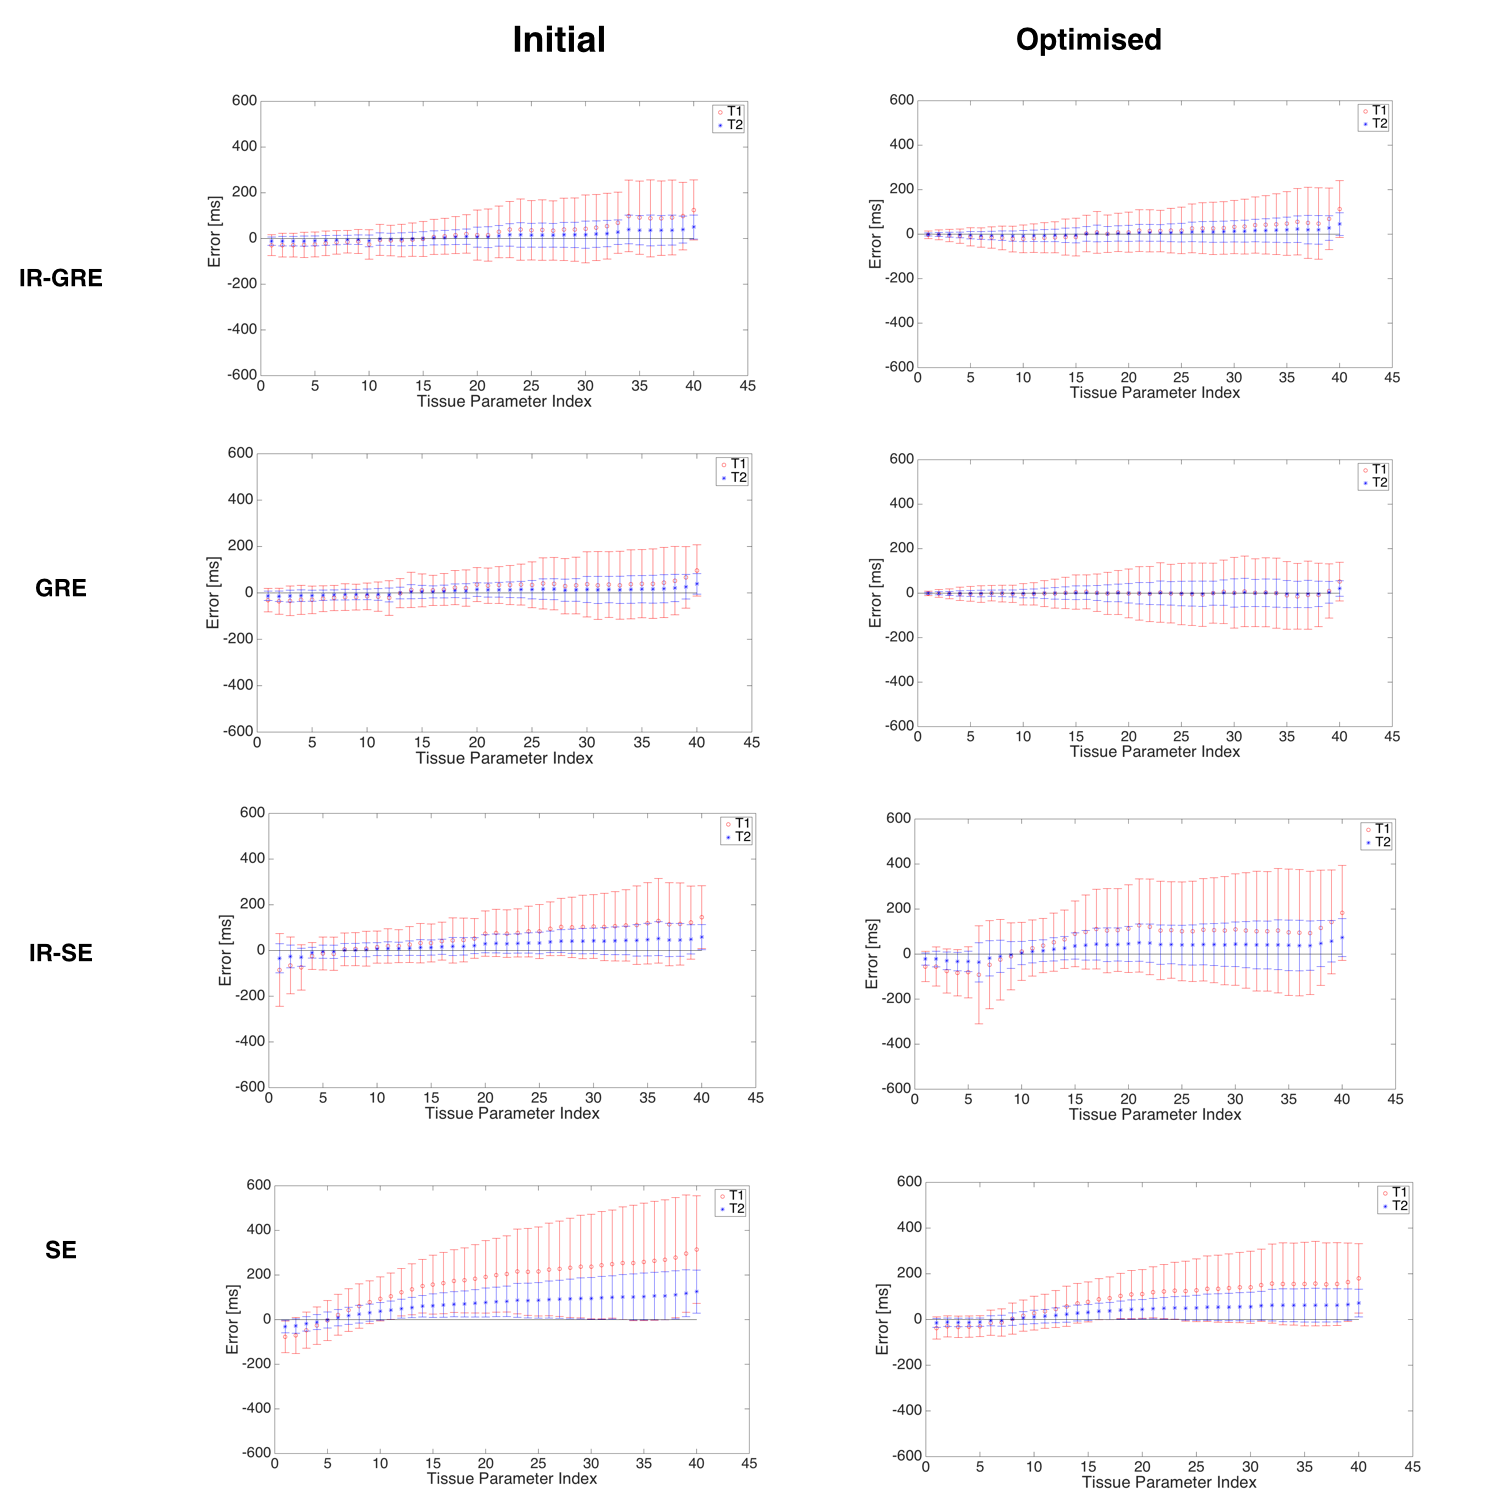
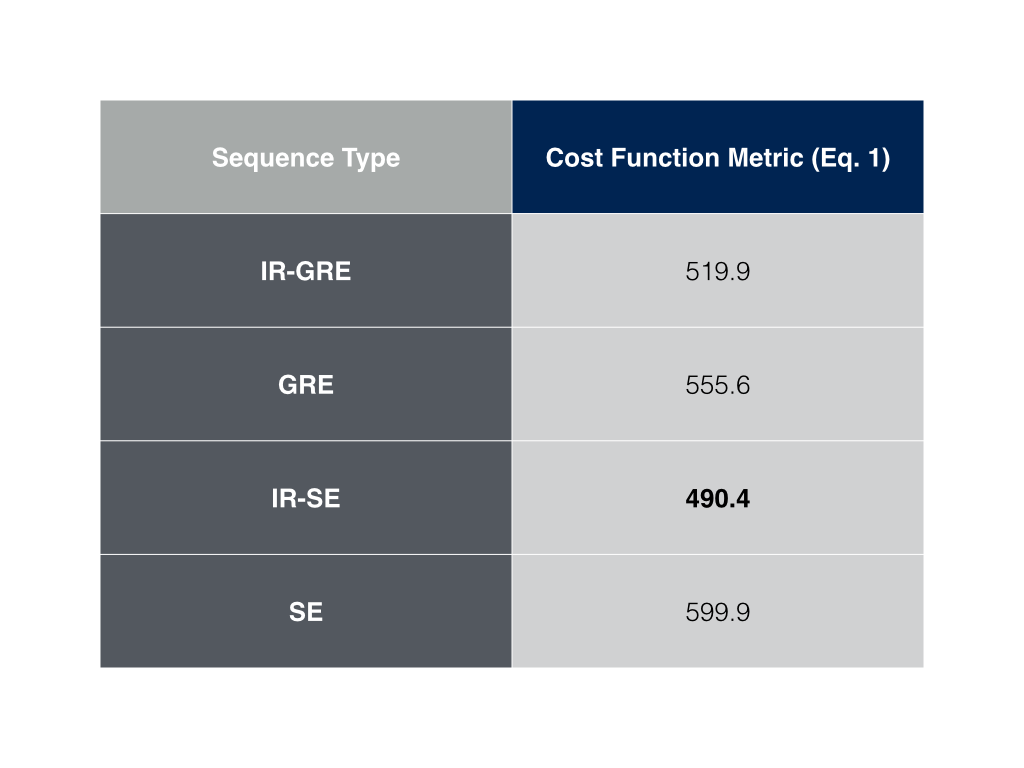
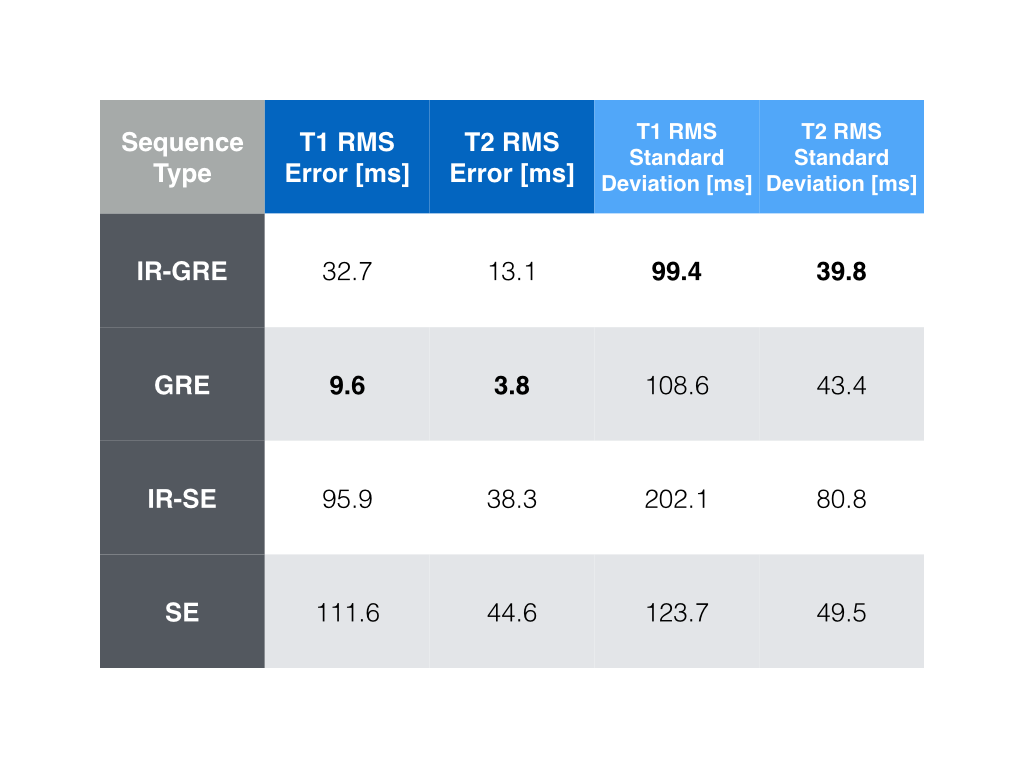
Figure 1 shows pulse sequence diagrams for the pulse sequences used in this study. Figure 2 shows the dot product matrices for each acquisition schedule. Figure 3 shows the simulated tissue parameter matching errors for each initial and optimised scheme. The optimised IR-SE dot product matrix had the lowest cost function value of all the sequences, as shown in Fig. 4. However, the parameter assignment Root-Mean-Square (RMS) errors and RMS standard deviations (Fig. 5) show that the GRE sequence provided the greatest accuracy (T1 and T2 RMS error = 9.6ms and 3.8ms, respectively) and the IR-GRE sequence achieved the greatest precision (T1 and T2 RMS standard deviation = 99.4ms and 39.8ms, respectively). The effective scan times of each optimised schedule were approximately 5.9s (IR-GRE), 5.3s (GRE), 5.2s (IR-SE) and 4.7s (SE). It is worth noting that any GRE-based scheme also has the advantage of shorter minimum TRs than SE sequences, so shorter total scan times are possible. We plan to extend this study to larger numbers of time points. We also aim to validate our simulated results by obtaining phantom and in vivo parameter maps with random and optimised acquisition schemes.
Conclusion
We compared the optimisation of single-shot MRF sequence designs and the MRF parameter matching performance of each. Our results suggest that GRE-based sequences should be used for single-shot MRF.
Acknowledgements
This work was supported by funding from the Engineering and Physical Sciences Research Council (EPSRC) and Medical Research Council (MRC) [grant number EP/L016052/1].References
1. Ma et al, Nature, 2013; 495:187-192
2. Cohen et al. ISMRM 2015: #0430
3. Cohen et al. ISMRM 2014: #0027
4. Hargreaves, B. (2016). http://web.stanford.edu/class/rad229/Matlab.html.
Figures