1343
3D Printed Phantom for PETMR Attenuation Correction1Radiology and Biomedical Imaging, UCSF Medical Center, San Francisco, CA, United States
Synopsis
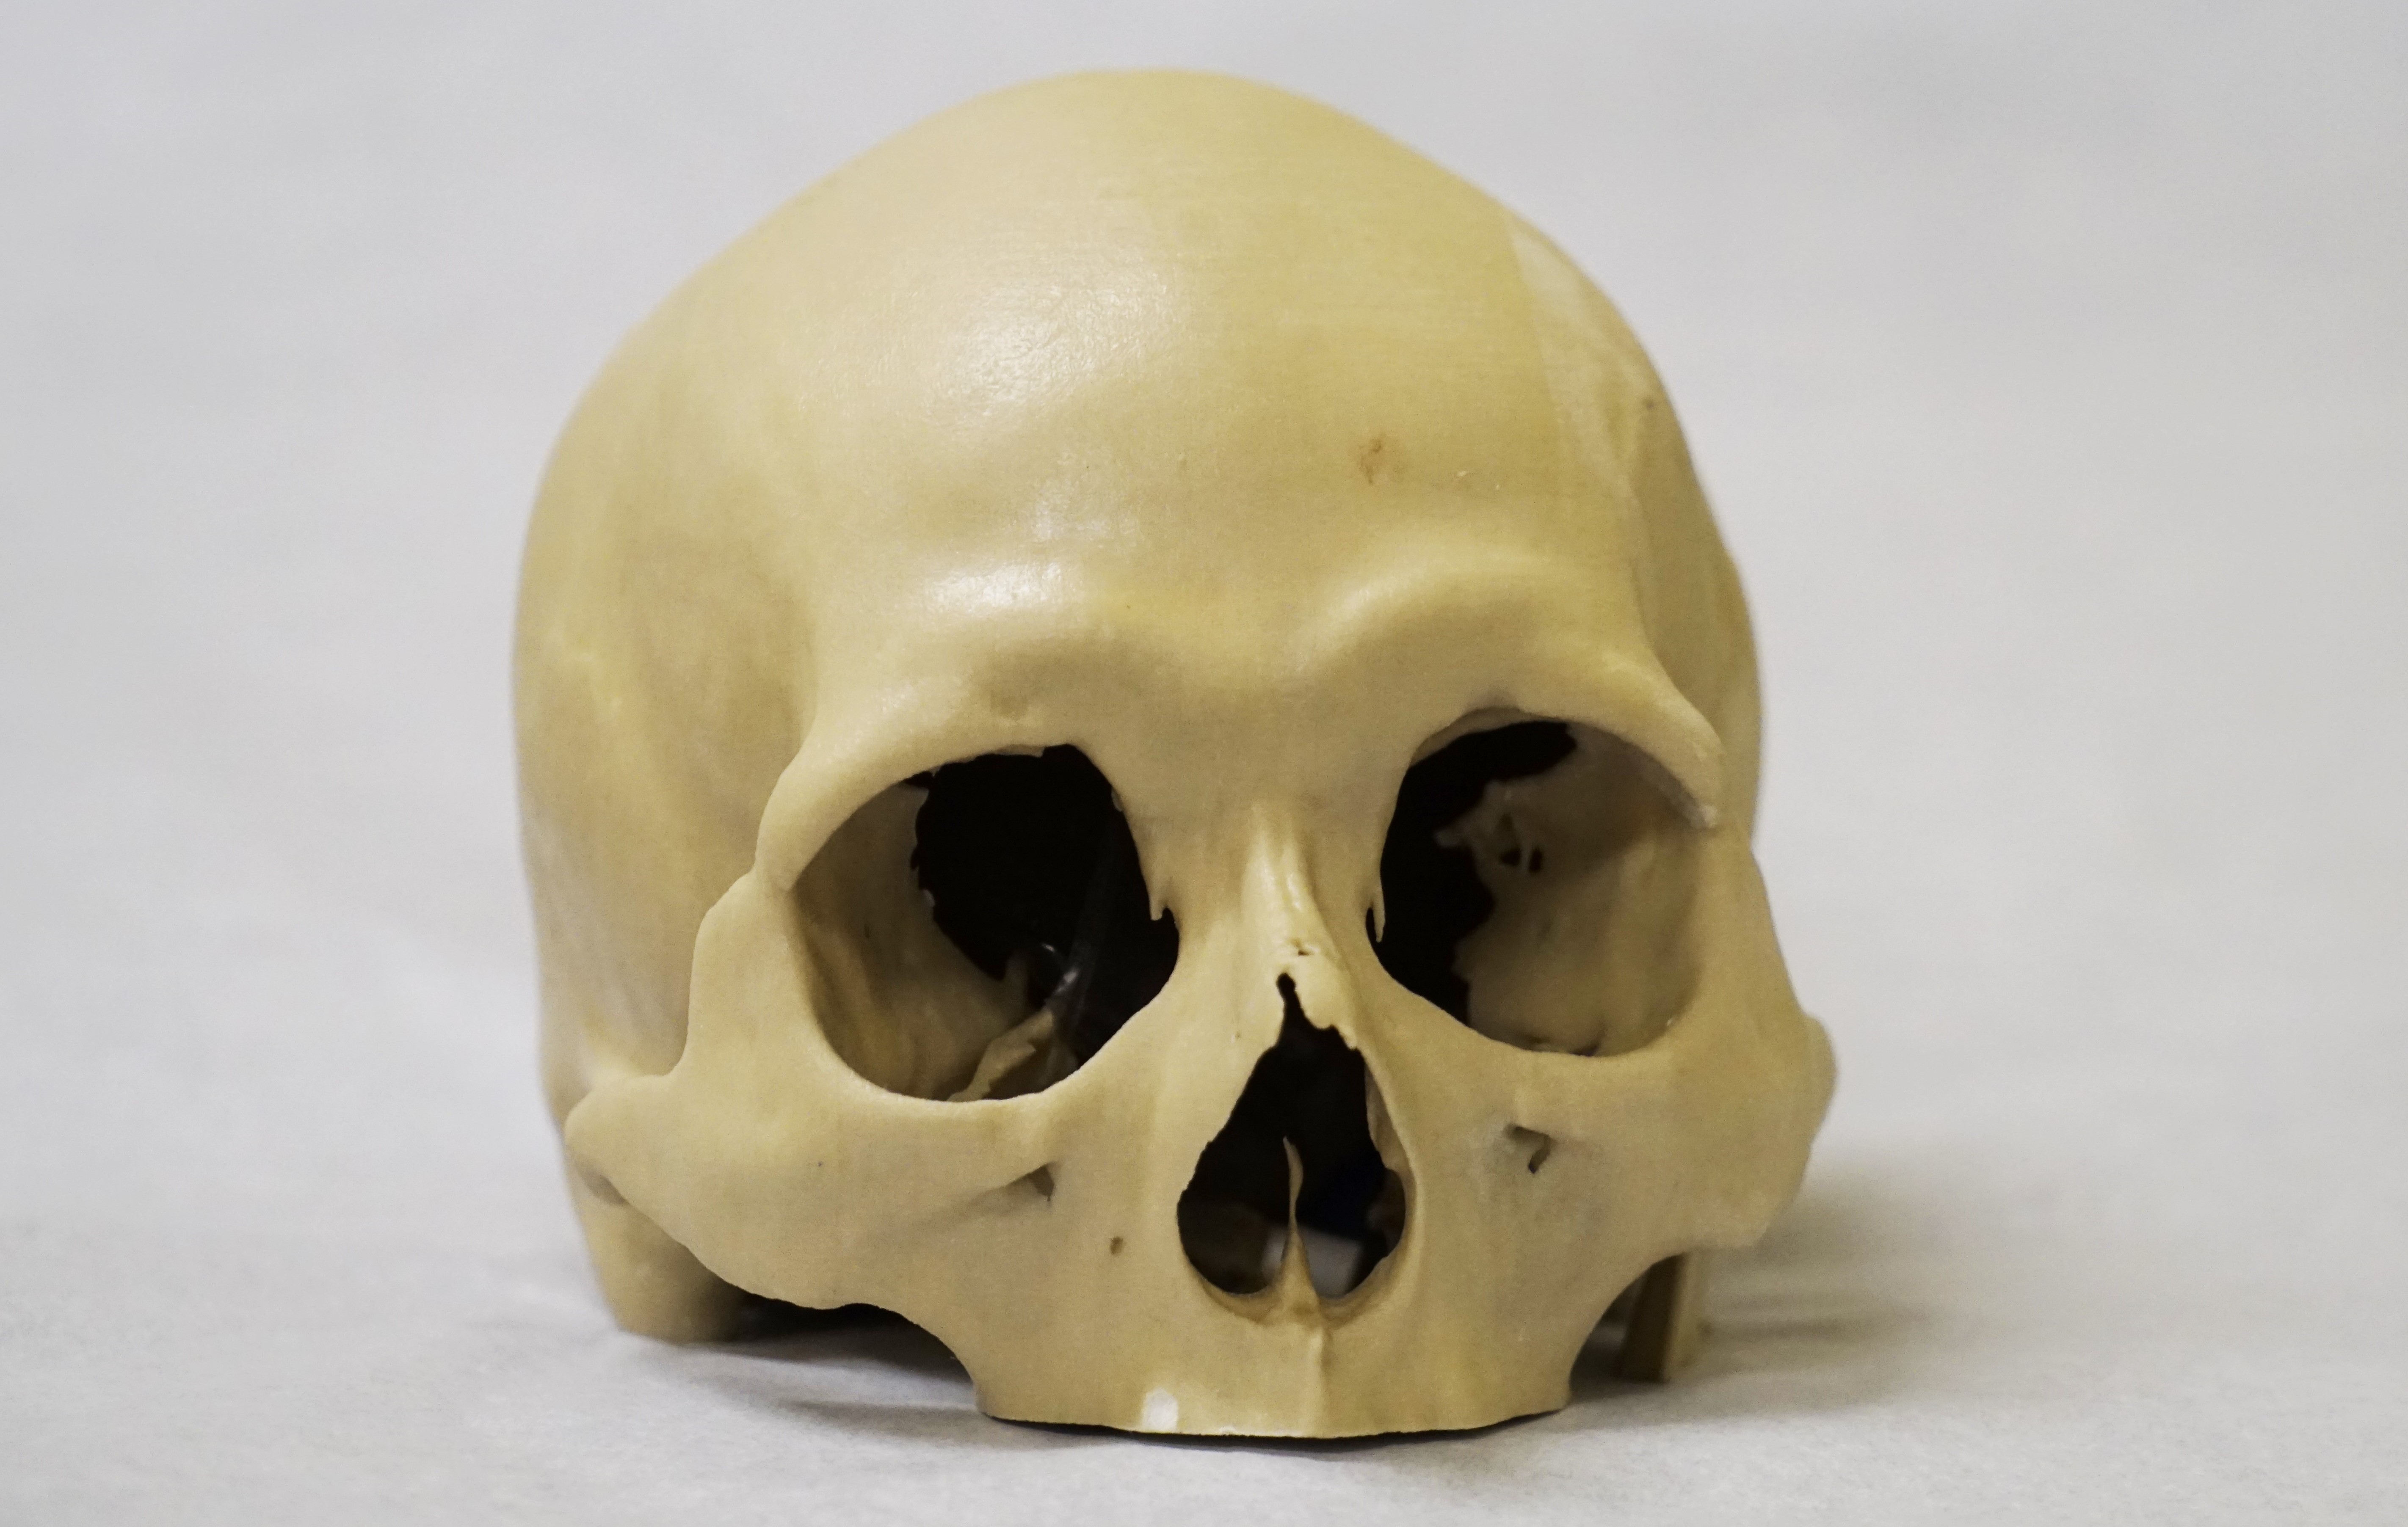
This experiment sought to explore PET/MRI attenuation correction with a 3D printed skull phantom used to mimic bone attenuation and MR characteristics.
Introduction
Many MR attenuation correction (MRAC) approaches use the human anatomy to generate attenuation maps. MRAC is a major challenge because the characteristic that correlates most directly with attenuation is density, which MRI cannot measure directly. Existing phantoms designed for PET/CT disregard tissue density as an important property as attenuation correction is not an issue in the setting of PET/MRI. Phantoms with bone simulation are highly desirable as bone has the largest attenuation coefficient of all tissues but is poorly detected by most MRI approaches. Therefore, we explored a 3D printed phantom designed to mimic bone properties both for density and proton characteristics imaged on MRI.Materials and Methods
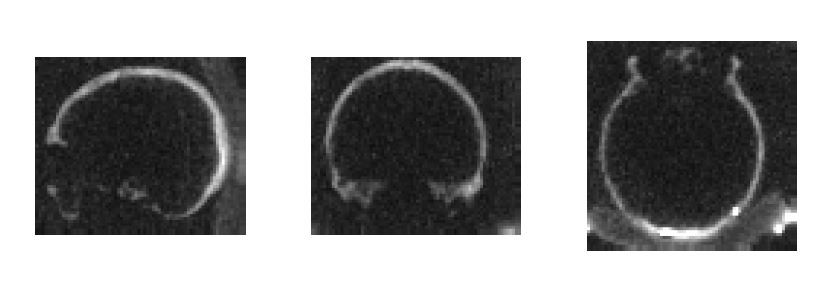
The phantom was based on a subject in which CT DICOM data was acquired previously and bone segmentation was applied. A 3D model of the skull was rendered from the data, which was then exported to a Stereolithographic(.STL) format. The phantom was 3D printed with a material similar to gypsum called calcium sulfate hemihydrate1 using a ProJet 660pro printer2. The phantom was then infiltrated with 100 mL of cyanoacrylate and allowed to cure for twenty-four hours3. A 500-ml saline reservoir was installed into the phantom and 3700 kBq of F-18 isotope was injected into the reservoir. The phantom was scanned using a simultaneous PET/MRI (Signa, GE Healthcare), and a PET/CT (Discovery VCT, GE Healthcare). The MRAC sequence used for the PET/MRI was a LAVA-FLEX 2-point Dixon sequence (TR/TE1/TE2 = 4.0/1.3/2.6 ms, FA= 5°, acquisition time of 18 sec, FOV=50cm, matrix size: 256×256×120, and voxel size=1.95×1.95×5.2 mm3). This was combined with a brain atlas and the measured attenuation of the head coil to create a MRAC map4. A 3D UTE sequence with 2.5 mm isotropic resolution was used for T1 and T2* mapping using a variable flip angle approach for T1 mapping5 with flips of 7° and 20°, and 8 TEs between 20 µs and 5 ms for T2* mapping (Fig. 2).
Results
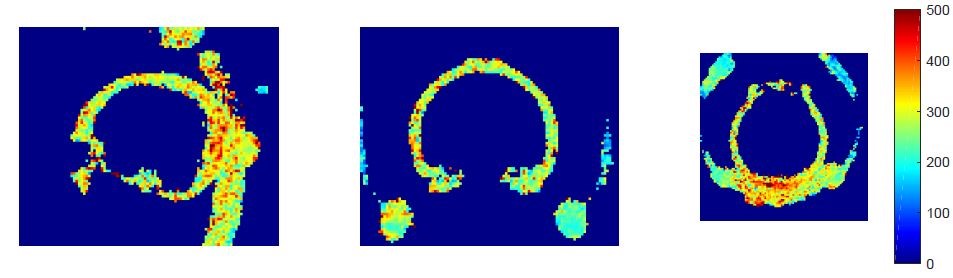
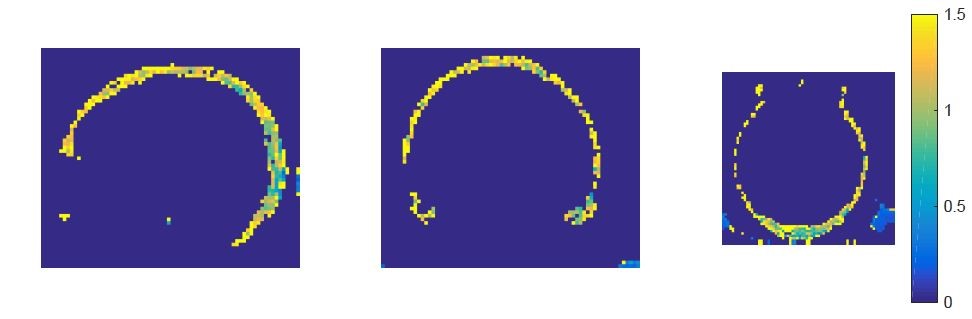
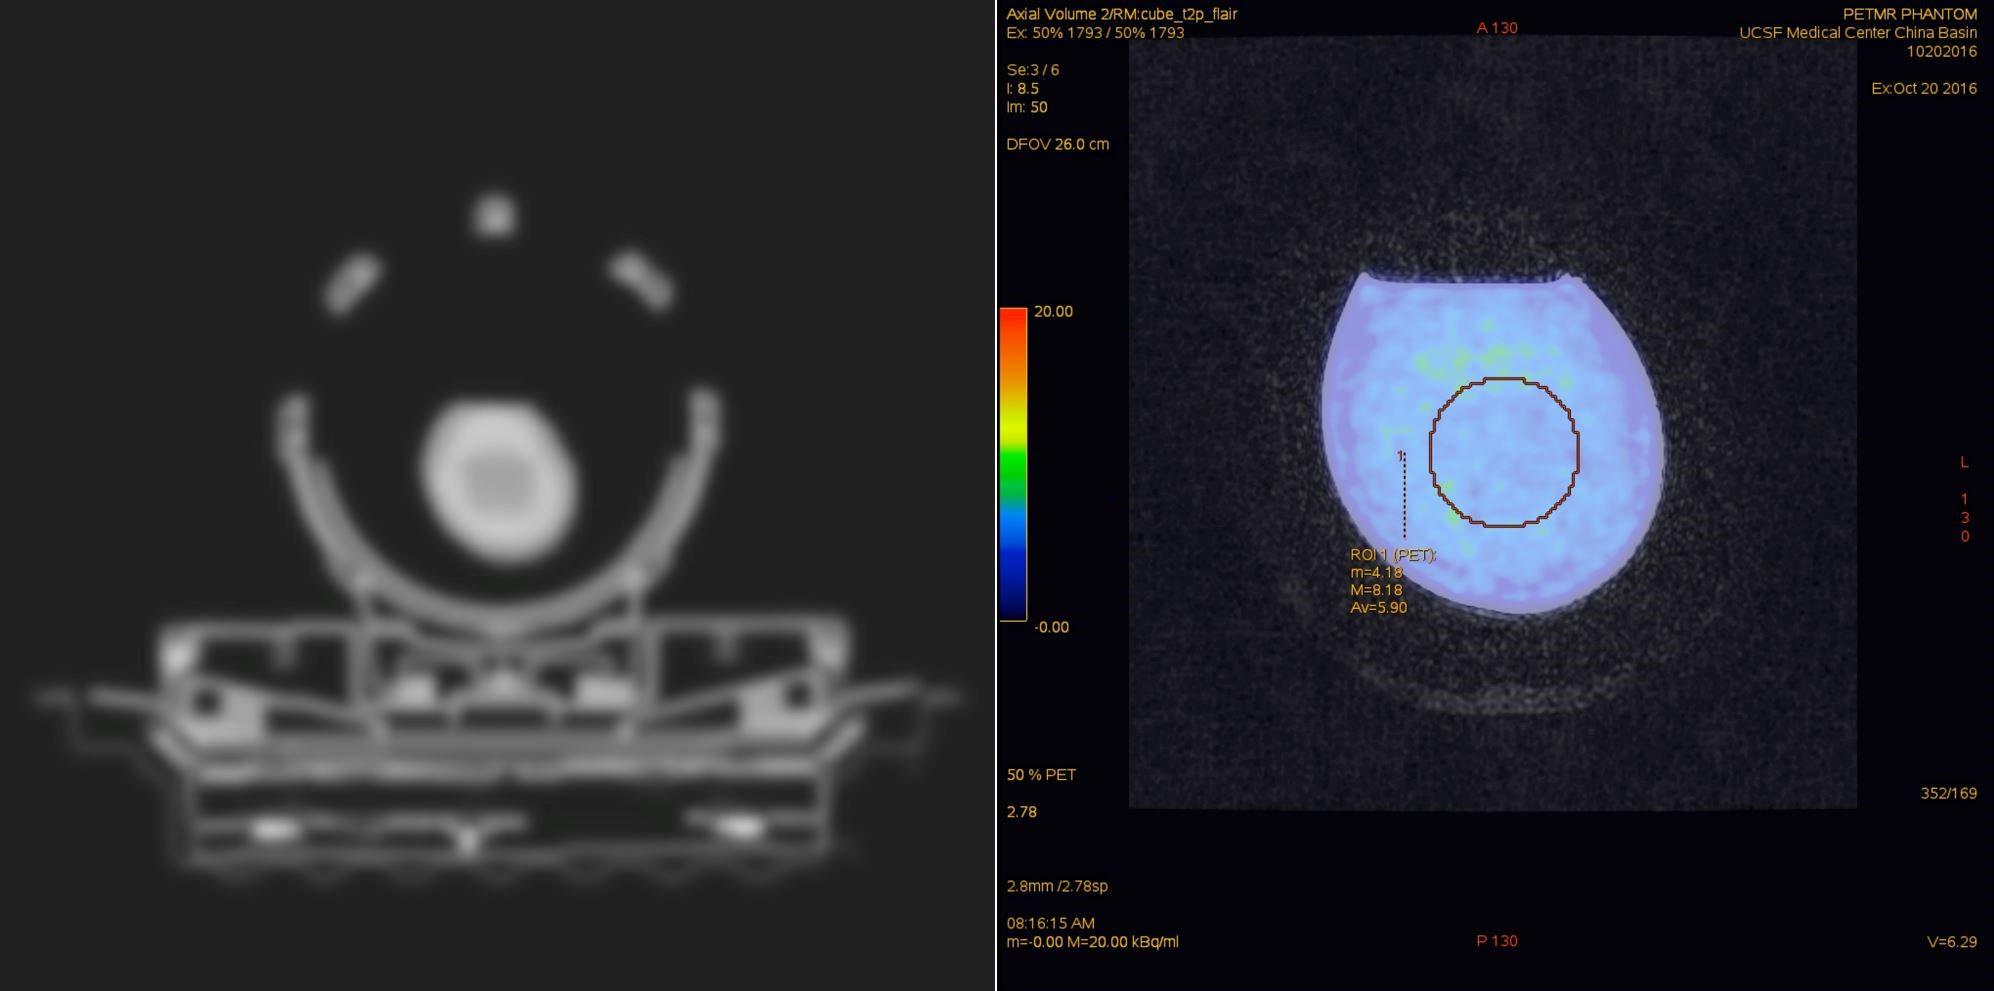
Initial analysis between the PET/MRI and PET/CT data sets resulted in disparate SUV measurements. Using a 50mm sphere volume ROI, the measured SUVbw was 5.90 kBq/ml for the PET/MRI (Fig. 5) and 7.19 kBq/ml for the PET/CT. The measured T1 and T2* values of the skull phantom were 330 ms (SD= ±194ms) (Fig. 3) and 1.27 ms (SD= ±0.33ms), respectively (Fig. 4).Discussion
T1 and T2* mapping of this phantom from the UTE sequence demonstrated values similar to in vivo cortical bone measured relaxation times of 300ms and 0.3-0.5ms, respectively6,7,8. This makes this phantom construction and materials used extremely promising as a bone mimic to test MRAC strategies for PET/MRI. The PET data sets showed a moderate agreement with some mismatch that could be due to the differences in the AC maps that were applied. These 3D printed anthropomorphic models are needed for PET/MRI scanner validation, and current PET/CT phantoms are not applicable for PET/MRI. The steps in the process of 3D printing lends itself to greater flexibility in controlling the properties of the eventual model. For instance, a model can be impregnated with gadolinium as well as the cyanoacrylate to alter the relaxivity properties or another metric that is to be studied. Further research to refine which printing methods can improve the correspondence with in-vivo relaxation rates, tissue densities, and integration with soft tissue mimics is needed.Conclusion
Our initial 3D printed skull phantom shows potential as a bone mimic for MRAC evaluation, with similar T1 and T2* relaxation rates to cortical bone in-vivo.Acknowledgements
No acknowledgement found.References
2.) Mitsouras, D., Liacouras, P., Imanzadeh, A., & Giannopoulo, A. (2015). Medical 3D Printing for the Radiologist. Radiographics, 1965-1988.
3.) 3D Sytems. (n.d.). 3D Sytems. Retrieved from http://www.3dsystems.com/sites/www.3dsystems.com/files/22-83104-s12-02-a-sds-ghs-english-colorbond-and-zbond-90.pdf
4.) Wollenweber, S. D., et al. "Evaluation of an atlas-based PET head attenuation correction using PET/CT & MR patient data." IEEE Transactions on Nuclear Science 60.5 (2013): 3383-3390. Christenson KA, et al. J Phys Chem 1974;78(19):1971-1977.
5.)Christensen, Kenner A., et al. "Optimal determination of relaxation times of Fourier transform nuclear magnetic resonance. Determination of spin-lattice relaxation times in chemically polarized species." The Journal of Physical Chemistry 78.19 (1974): 1971-1977.
6.)Du J, Carl M, Bydder M, Takahashi A, Chung CB, Bydder GM. Qualitative and quantitative ultra short echo time (UTE) imaging of cortical bone. J Magn Reson. 2010;207:304–311.
7.)Horch, R. Adam, et al. "Non-invasive predictors of human cortical bone mechanical properties: T 2-discriminated 1 H NMR compared with high resolution X-ray." PloS one 6.1 (2011): e16359.
8.)Horch, R. Adam, et al. "Characterization of 1H NMR signal in human cortical bone for magnetic resonance imaging." Magnetic resonance in medicine 64.3 (2010): 680-687.
Figures