1339
Effects of B1 Correction on the Accuracy of T1, T2 and ADC Values Measured with a Diffusion-Weighted Dual-Echo Steady-State (DW-DESS) Sequence1Medical Imaging, Sunnybrook Health Sciences Centre, Toronto, ON, Canada, 2Medical Imaging, University of Toronto, Toronto, ON, Canada
Synopsis
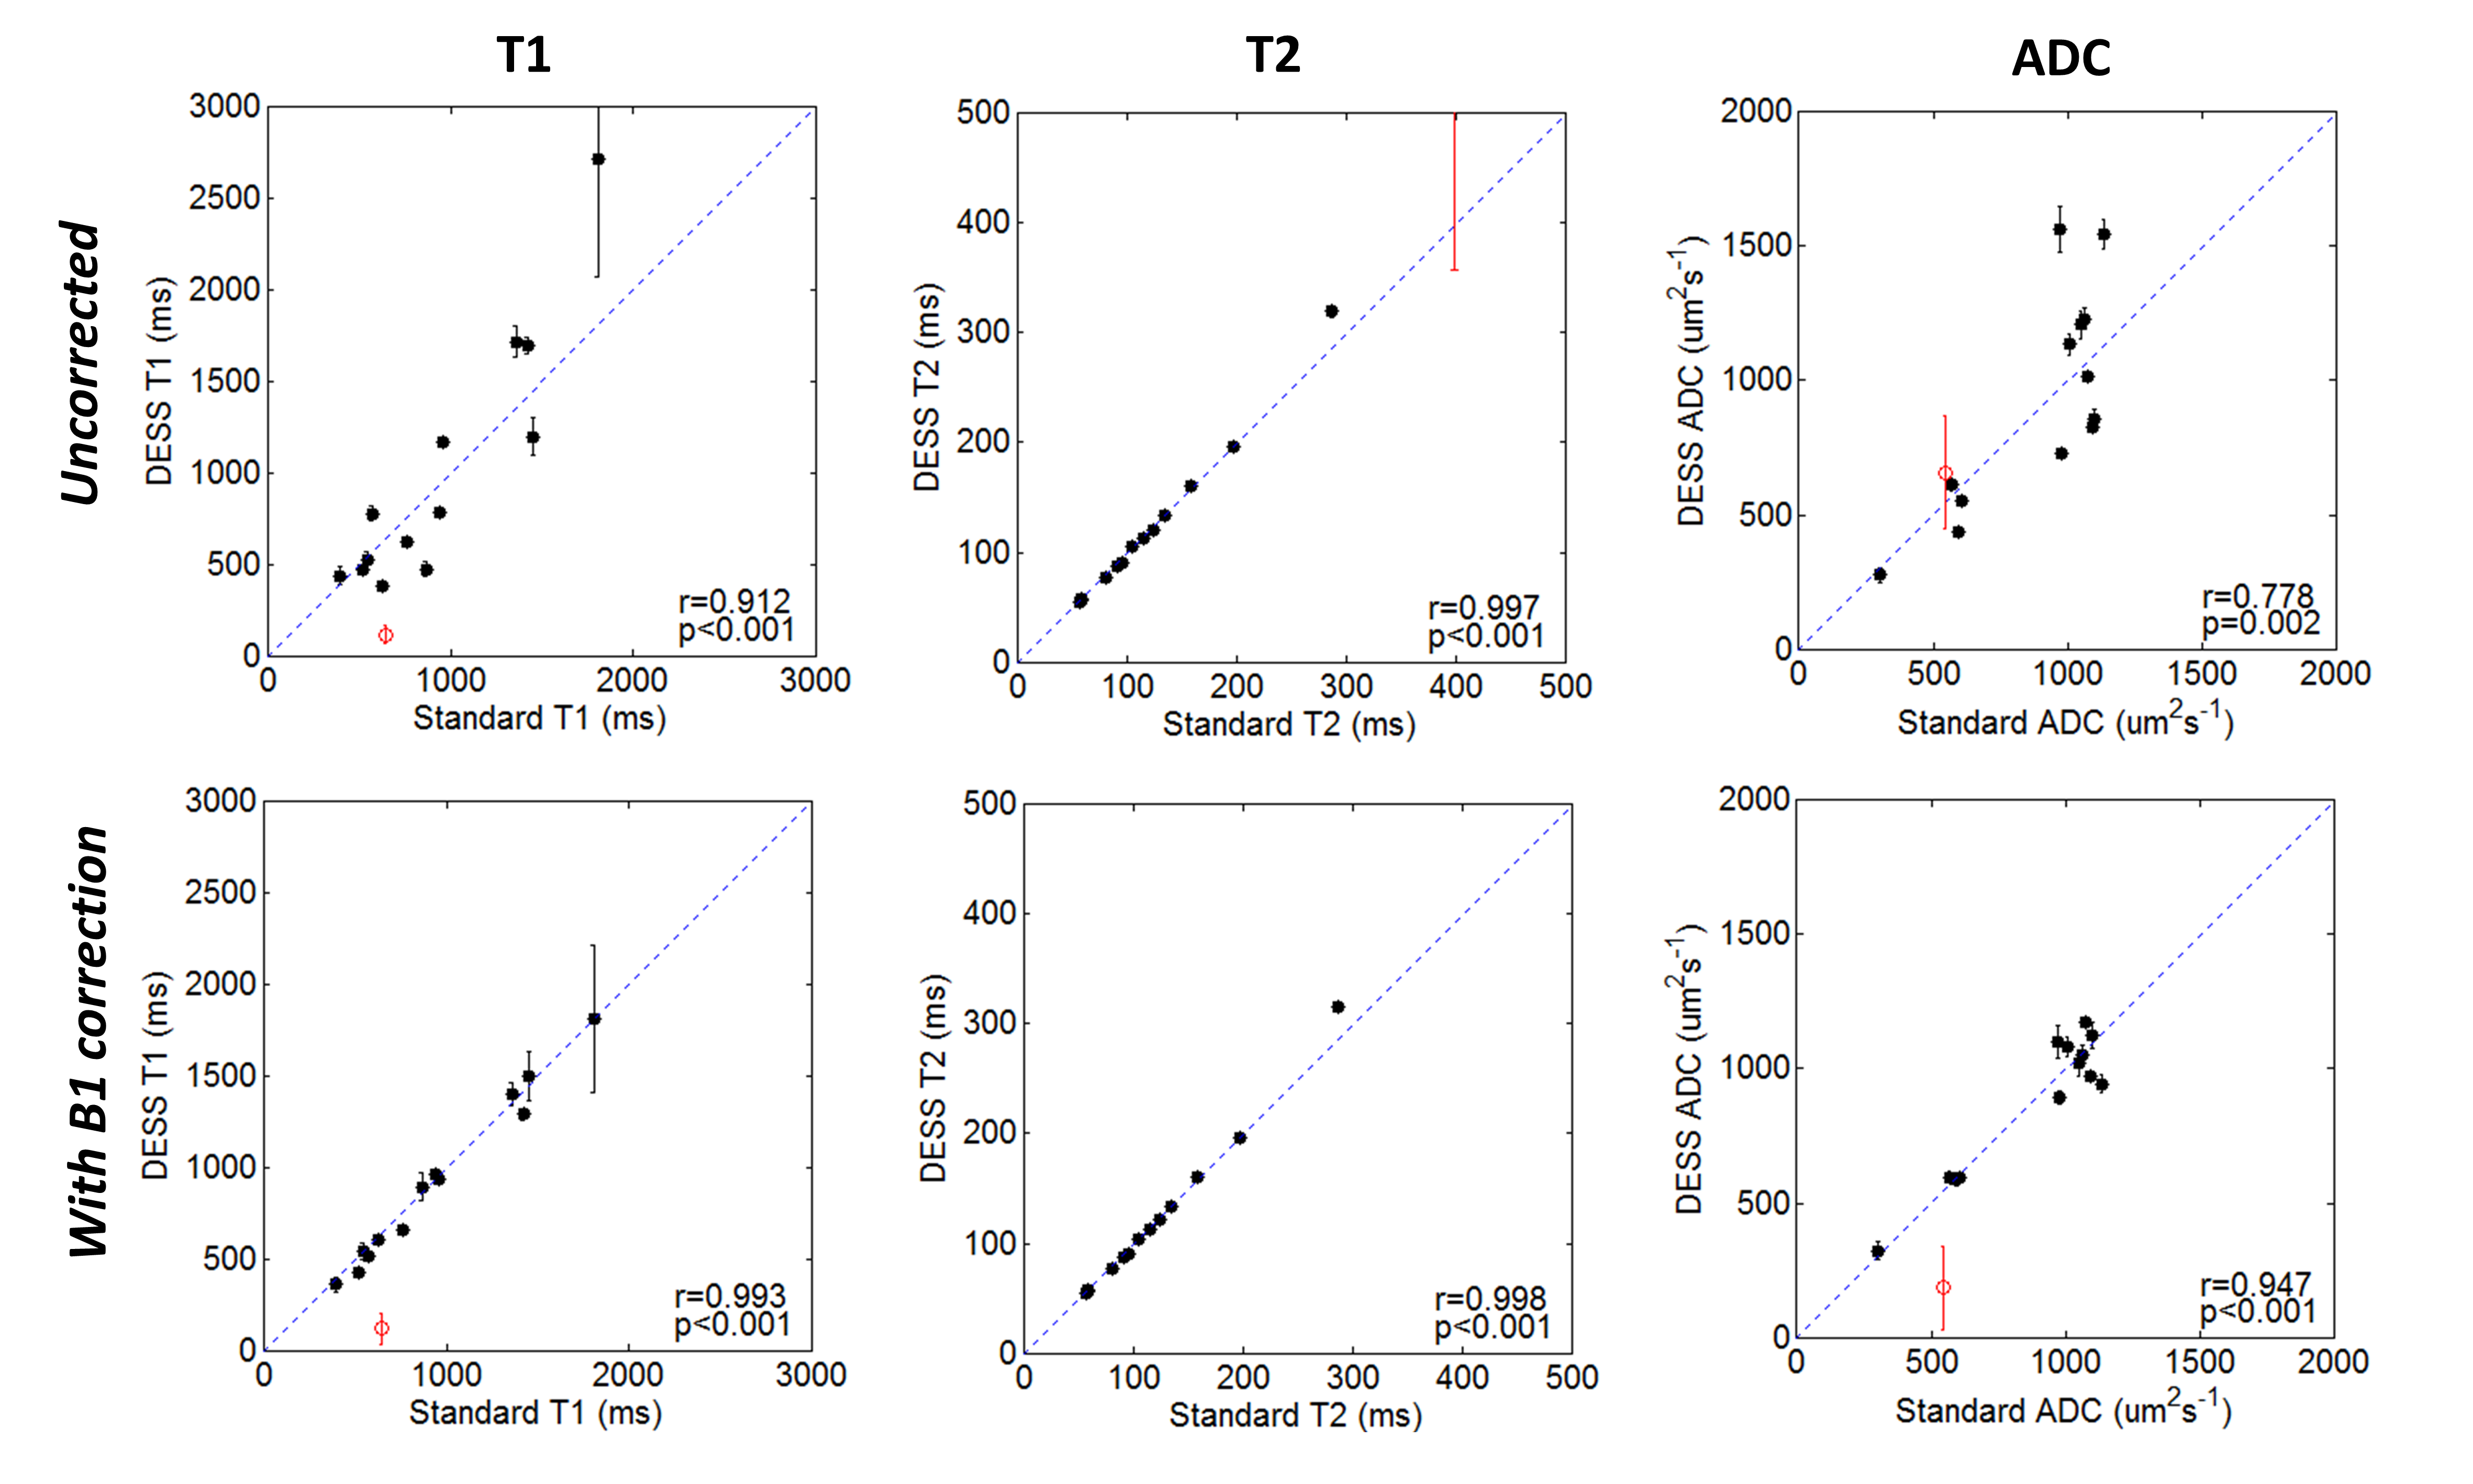
Diffusion-weighted dual-echo steady-state (DW-DESS) imaging allows multiple MR parameters to be quantified without image distortion. In this work, we investigate the effects of B1 correction on the accuracy of T1, T2 and ADC parameters estimated from DW-DESS. We extend the quantification to species with ADC and T2 values that are similar human cancers by using a novel phantom mixture. The accuracy of parameter estimates measured with DW-DESS is improved after B1 correction, with correlation coefficients of 0.912, 0.997 and 0.778 without B1 correction to 0.993, 0.998 and 0.947 after B1 correction (for T1, T2 and ADC, respectively).
INTRODUCTION
Diffusion-weighted echo-planar imaging (DW-EPI) is prone to image distortion caused by field inhomogeneity and local susceptibility variations. An alternative approach is to use diffusion-weighted steady-state free precession (DW-SSFP) sequences to obtain high-resolution, distortion-free DW images1-3. With an additional echo, the dual-echo steady state (DW-DESS)4-7 sequence can allow T1, T2 and ADC maps to be obtained without distortion.
Variation in the transmitted radiofrequency field, B1, was noted in previous studies as a possible source of error in the quantification of parameters in DW-DESS. In recently published work by Gras et al.7, DW-DESS parameter estimates included B1 correction with an actual flip-angle imaging (AFI) sequence8.
Purpose: We further quantify the incremental effects of B1 correction on the accuracy of T1, T2 and ADC values estimated with DW-DESS. In the study by Gras et al, relatively high ADC values (>2000 um2/s) were investigated. In this work, we extend the quantification to lower ADC ranges that are better matched to those measured in human cancers (≈500 to 1200 um2/s) using a novel phantom mixture that allows both the ADC and T2 to be within the range of human lesions.
METHODS
Phantom mixtures:
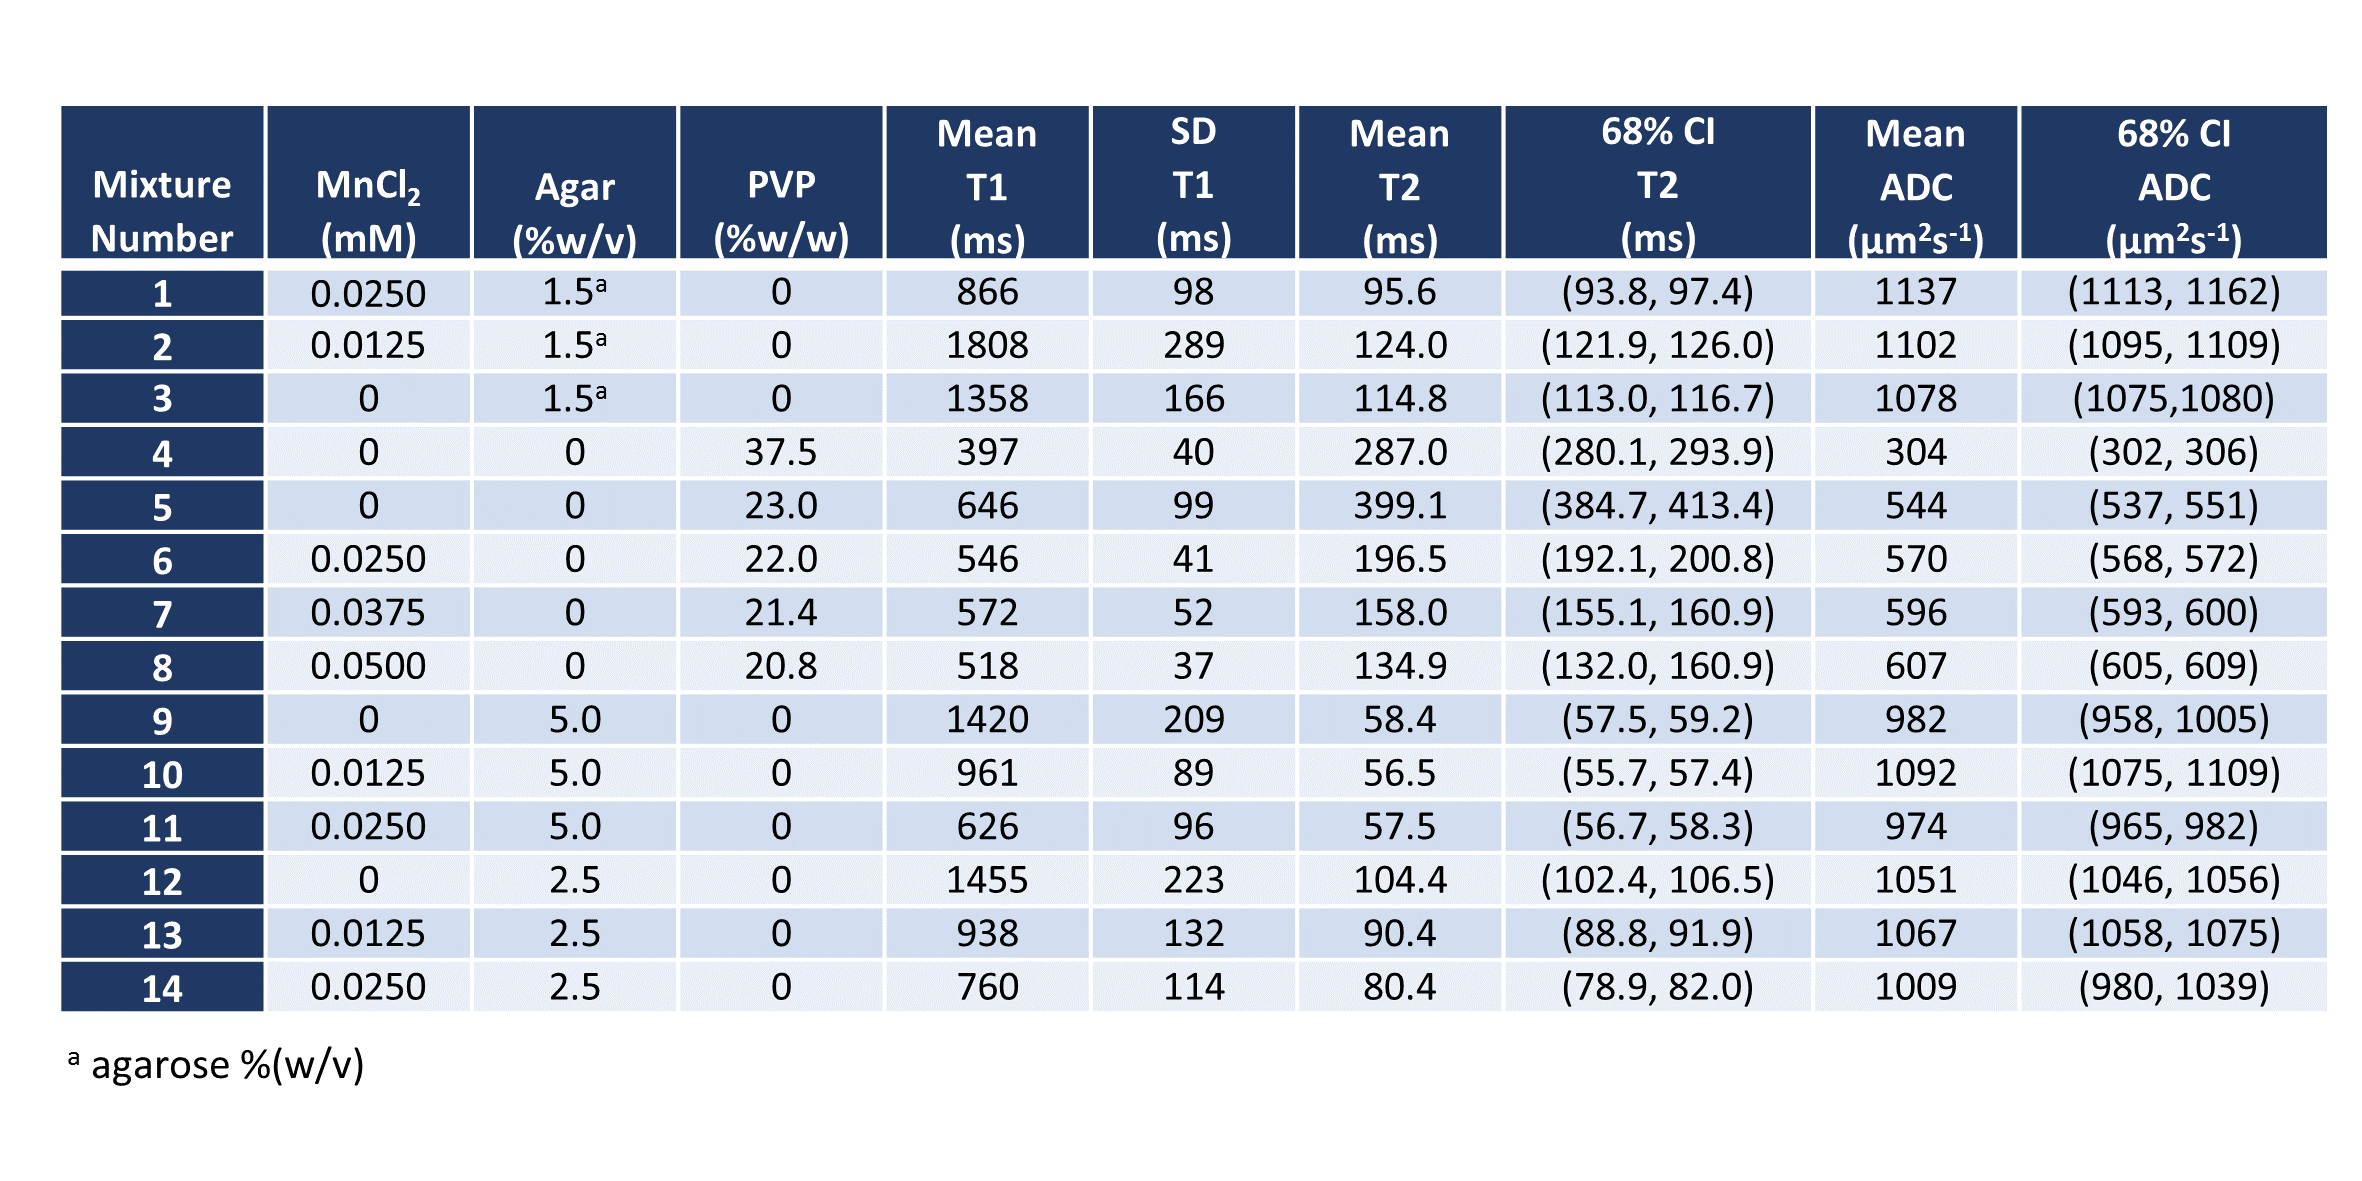
Mixtures of manganese chloride (MnCl2), agar and polyvinylpyrrolidone (PVP, Sigma-Aldrich) were used. PVP alone9,10 leads to ADC values in the range of human lesions but with T2 values that are too high. Here, MnCl2 was added to PVP to reduce the T2 relaxation times.
MR Imaging:
Experiments were performed on a 3T scanner (MAGNETOM Prisma, Siemens Healthcare, Erlangen, Germany) at 0°C using an ice-water phantom bath.
DW-DESS: A 3D sequence was implemented and acquired with TR=23.5ms, TE1,2=5,16.3ms, FOV=294×294mm2, matrix=256×256, 16 slices, 3mm thickness, diffusion duration=5ms. Two sets of data were acquired: a) flip angle=15° with Gdiffusion=30mT/m, and b) flip angle=35° with Gdiffusion=5mT/m. The scan duration was 3min for both sets.
B1 map: A 3D AFI sequence was implemented and scanned with nominal flip=60°, TR1,2=30,150ms, spoiling areas A1,2 = 450,2250 mT∙ms/m, phase increment=34°, scan duration 12min.
Comparison scans:
DWI: ADC measurements were performed with a readout-segmented EPI (Siemens, RESOLVE) sequence with parameters: TR/TE = 3930/52ms, FOV=225×225mm2, 110x110 matrix, 3mm thickness, 16 slices, 3 diffusion directions, b-values= {0,100,300,600,1000}, scan duration 4min.
T2 mapping: T2 relaxation times were estimated with the Siemens T2 MapIt turbo spin-echo sequence with TR=3000ms and TE={11, 23, 34, 45, 57, 68, 79, 90, 102, 113, 124, 136} ms.
T1 mapping: T1 relaxation times were measured using the Siemens T1 MapIt sequence with parameters TR/TE=5.4/2.5 ms, flip angle=3° and 15°.
Image Analysis:
T1, T2 and ADC values were simultaneously estimated by fitting the DW-DESS echoes to a signal model based on extended phase graph (EPG) modelling11,12. All simulations and analysis were performed in MATLAB. DW-DESS-parameter estimates for each ROI were estimated with and without B1 correction. For B1 correction, the measured flip angles from the AFI scan was incorporated into the signal model for fitting.
RESULTS
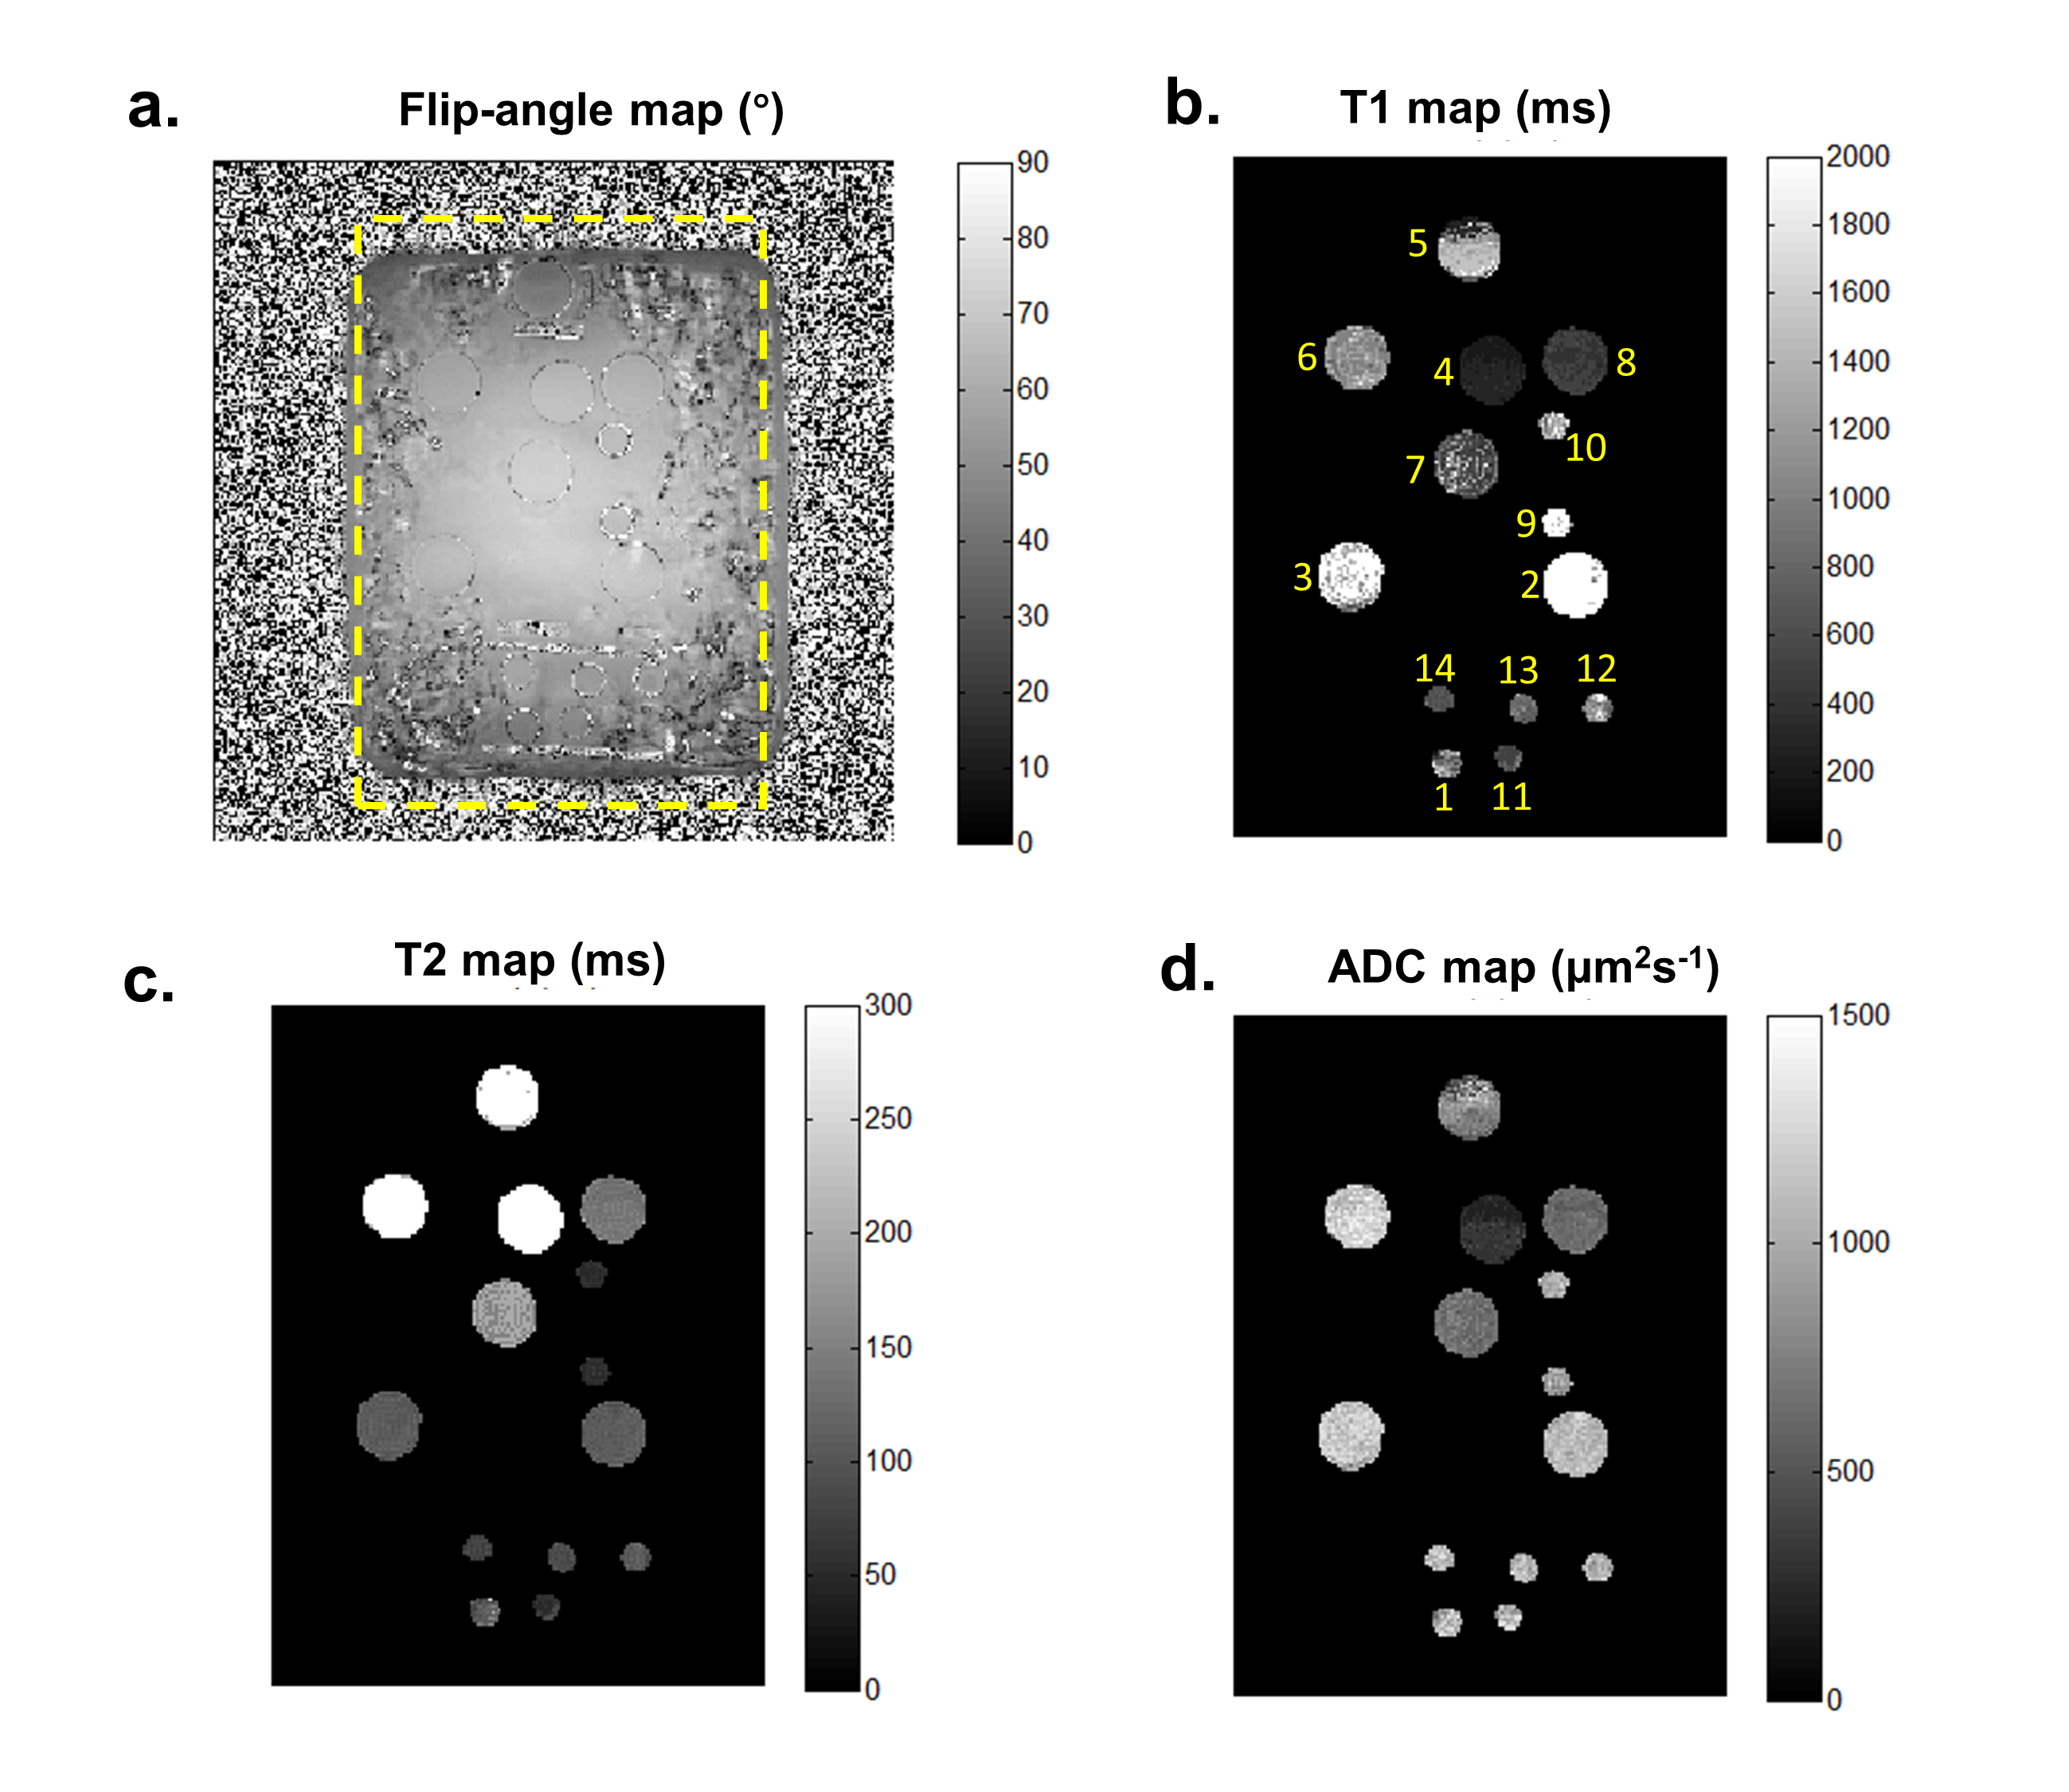
Fourteen mixtures with standard T1, T2 and ADC values are listed in Figure 1. Mixture #8 has both ADC and T2 values in the approximate range of human lesions. The accuracy of DW-DESS estimates is improved after B1 correction, especially for T1 and ADC. Correlation coefficients are 0.912, 0.997 and 0.778 without correction and 0.993, 0.998 and 0.947 with B1 correction for T1, T2 and ADC, respectively. Mixture #5 with the longest T2 (=399ms, as measured by the comparison scan) could not be estimated accurately with DW-DESS likely due to its high T2 value. As such, mixture #5 was excluded from the correlation-coefficient calculation but are included as red circles in Figure 2. The flip-angle and parameter maps are displayed in Figure 3.DISCUSSION
Improvements in accuracy are demonstrated in DW-DESS estimates after B1 correction. A limitation here is that the phantom set up may not reflect the level of B1 variation in in vivo scans, which can also vary between subjects. However, this work allows the incremental value of B1 correction to be quantified in a controlled setting where the effects are not confounded by motion.CONCLUSION
B1 correction improves the accuracy of T1, T2 and ADC estimates in DW-DESS when the actual flip angles deviate from the nominal ones. DW-DESS is a promising technique for simultaneously estimating multiple tissue properties.Acknowledgements
The authors would like to thank Bart Schraa and Mark Brown for helpful pointers related to the pulse sequences.References
1. Wu EX, Buxton RB. Effect of diffusion on the steady-state magnetisation with pulsed field gradient. J Magn Reson 1990;90:243–253.
2. Miller KL, Hargreaves BA, Gold GE, Pauly JM. Steady-state diffusion weighted imaging of in vivo knee cartilage. Magn Reson Med 2004;51:394–398.
3. McNab JA, Jbabdi S, Deoni SC, Douaud G, Behrens TE, Miller KL. High resolution diffusion-weighted imaging in fixed human brain using diffusion-weighted steady state free precession. Neuroimage. 2009 Jul 1;46(3):775-85.
4. Bieri O, Ganter C, Scheffler K. Quantitative in vivo diffusion imaging of cartilage using double echo steady-state free precession. Magn Reson Med 2012;68:720–9.
5. Staroswiecki E, Granlund KL, Alley MT, Gold GE, Hargreaves BA. Simultaneous estimation of T2 and apparent diffusion coefficient in human articular cartilage in vivo with a modified three-dimensional double echo steady state (DESS) sequence at 3 T. Magn Reson Med 2012;67:1086–1096.
6. Granlund KL, Staroswiecki E, Alley MT, Daniel BL, Hargreaves BA. High-resolution, three-dimensional diffusion-weighted breast imaging using DESS. Magnetic resonance imaging. 2014 May 31;32(4):330-41.
7. Gras V, Farrher E, Grinberg F, Shah NJ. Diffusion-weighted DESS protocol optimization for simultaneous mapping of the mean diffusivity, proton density and relaxation times at 3 Tesla. Magnetic Resonance in Medicine. 2016 Jul 1.
8. Yarnykh VL. Actual flip-angle imaging in the pulsed steady state: a method for rapid three-dimensional mapping of the transmitted radiofrequency field. Magnetic resonance in Medicine. 2007 Jan 1;57(1):192-200.
9. Horkay F, Pierpaoli C, Basser PJ. Phantom for diffusion MRI imaging. USA2012. US 20120068699 A1.
10. Pierpaoli C, Sarlls J, Nevo U, Basser PJ, Horkay F. Polyvinylpyrrolidone (PVP) water solutions as isotropic phantoms for diffusion MRI studies. In: Proceedings of the 17th Annual Meeting of the ISMRM, Honolulu, 2009.
11. Weigel M. Extended phase graphs: Dephasing, RF pulses, and echoes-pure and simple. Journal of Magnetic Resonance Imaging. 2015 Feb 1;41(2):266-95.
12. Hargreaves BA and Miller KL. Using Extended Phase Graphs: Review and Examples. In: Proceedings of the 21st Annual Meeting of the ISMRM, Salt Lake City, 2013. #3718.
Figures