1337
Comparison of UTE-based Attenuation Correction Methods for Simultaneous PET/MR Imaging of the Children's Brain1Department of Engineering Physics, Tsinghua University, Beijing, People's Republic of China, 2Department of Nuclear Medicine, Chinese PLA General Hospital, People's Republic of China, 3Key Laboratory of Particle and Radiation Imaging, Ministry of Education, Medical Physics and Engineering Institute, Tsinghua University, Beijing, People's Republic of China
Synopsis
In simultaneous PET/MR imaging, PET attenuation correction is based on MRI, unlike PET/CT systems, which directly use CT measurements. Various approaches have been developed based on templates, atlas information, direct segmentation of T1-weighted MR images. In the present study, we introduced two approaches of UTE-based attenuation correction for simultaneous PET/MR imaging focusing on children’s brain, including segmentation-based method and Support Vector Machine (SVM) regression method. The results have been compared with Gaussian Mixture Regression (GMR) model method.
Purpose
The derivation of attenuation map as required for quantitative PET is one of the most challenging problems in PET/MRI since there is no direct source of attenuation information available from MR image intensities, while compared to PET/CT, attenuation information can be directly acquired by CT images. A particular challenge for brain attenuation correction is the correct characterization of bone due to its low water density and fast signal decay. UTE sequences are specifically designed for reliable MR bone depiction1. However, bone of children has an even shorter relaxation time than that of adults. Therefore, it is of great significance to investigate the feasibility of visualizing bone of children with these sequences. In this study, we present two attenuation correction methods in children's brain and compare them with Gaussian Mixture Regression (GMR) model method2.Methods
Image acquisition: Data of three children patients and six adult patients were acquired on a 3T whole-body simultaneous PET/MR scanner (Biograph mMR, Siemens Medical Systems, Erlangen, Germany). Each data set includes 1 T2-TSE MR (TE: 87 ms, TR: 4540 ms, FA: 10°, matrix size: 640×616×23), 2 UTE MR (TE1/TE2: 0.07/2.46 ms, TR:11.94 ms, matrix size: 192×192×192), and 1 corresponding PET raw data. Besides, each adult data set includes 1 CT volumes (120kVp, 100mAs, matrix size: 512×512×45) to be compared with generated pseudo-CT. UTE1with very short echo time contains all information including bones, while UTE2, the longer echo, has no bone information. Hence bone information can be acquired by combining 2 UTE images.
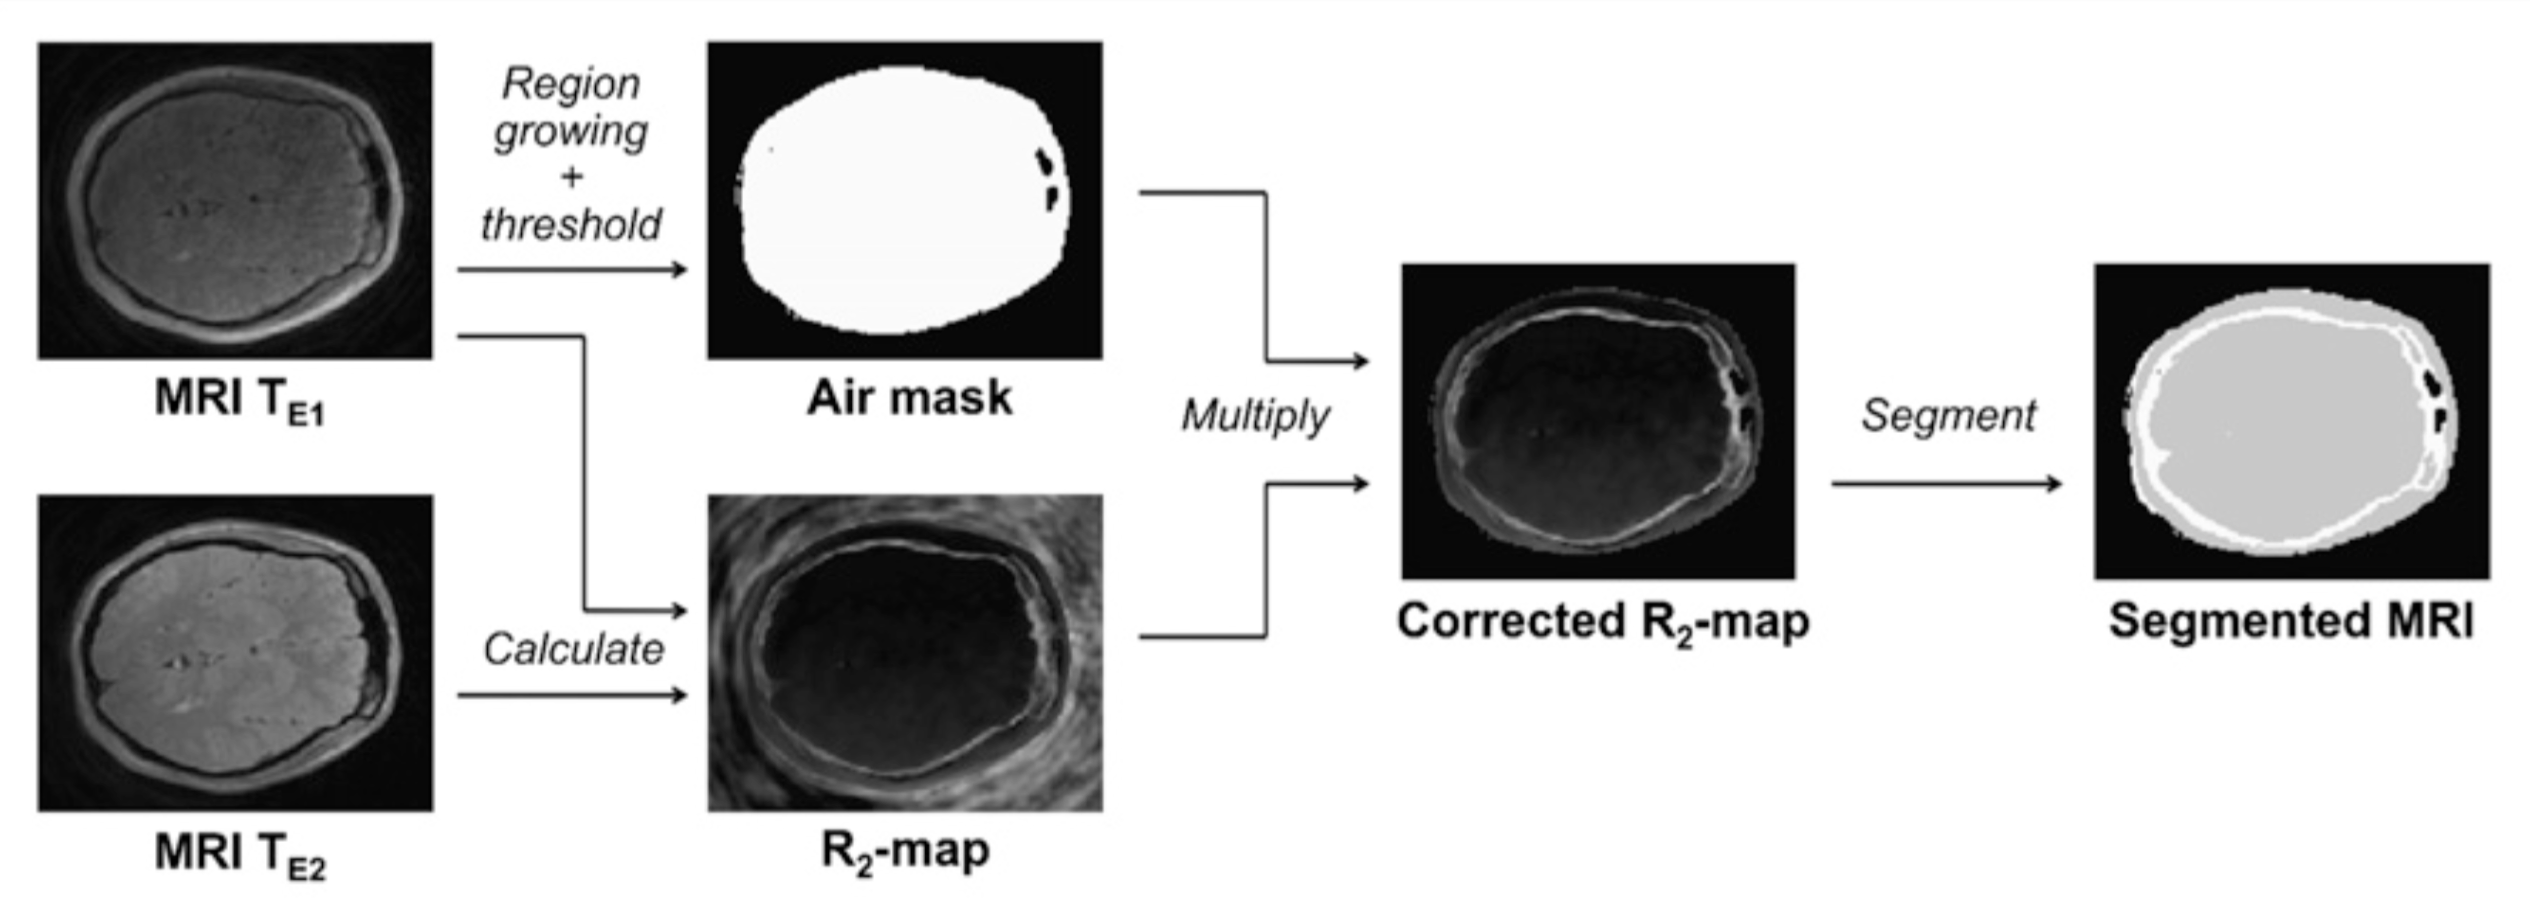
Segmentation method: The segmentation-based method by Keereman3 used UTE images to differentiate air and bone. After MR and PET images are registered, an R2 map is calculated from two UTE images and a mask is calculated to correct voxels containing air. Then, the MR images are segmented with an optimal threshold value 0.3 rather than 0.5 in the paper. The imaging processing procedure is summarized in Fig. 1.
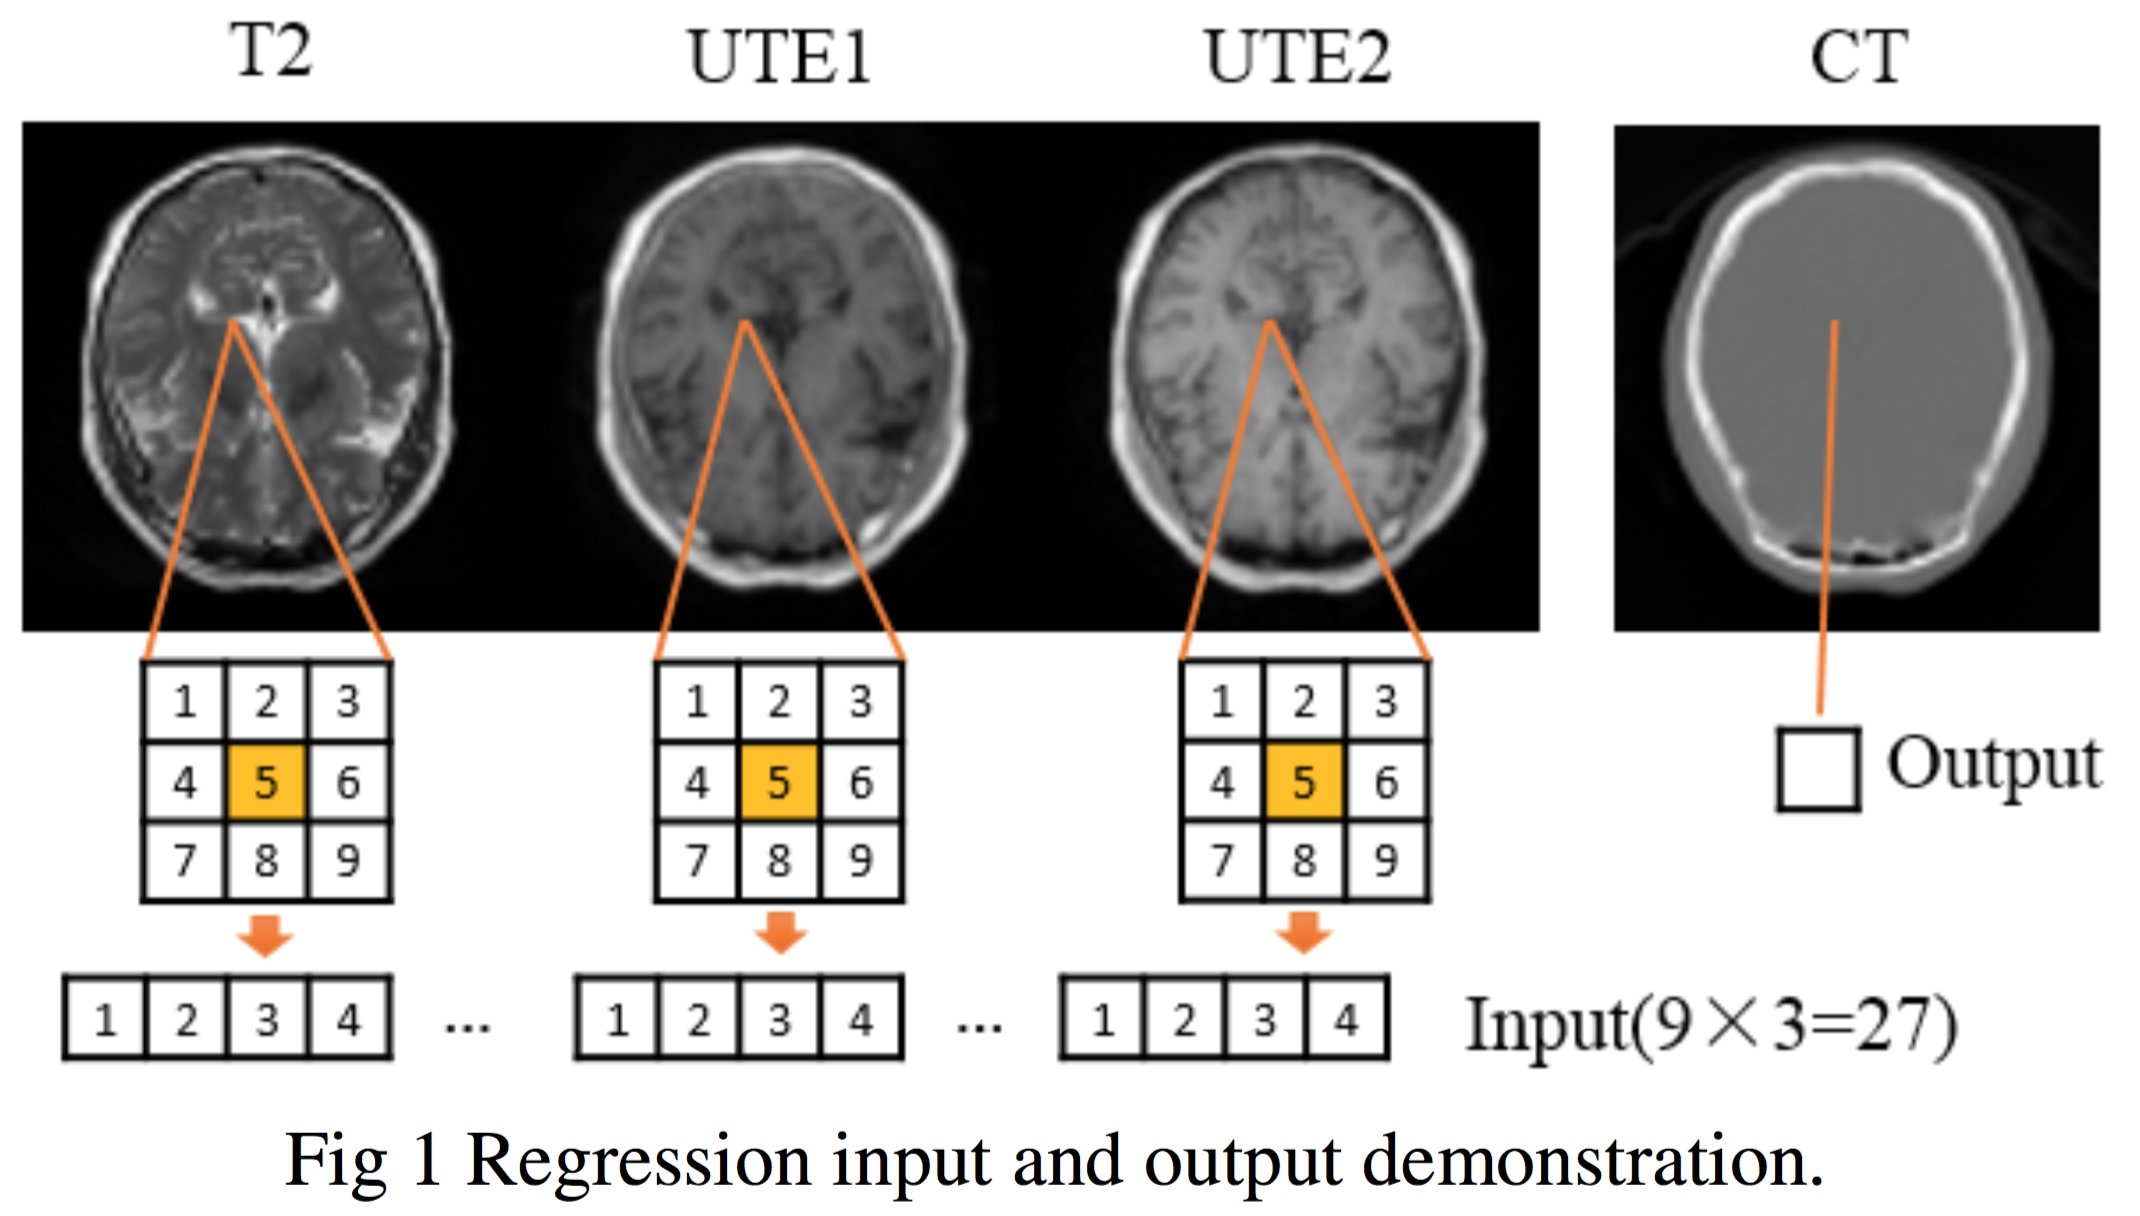
SVM method: An atlas-based method combined with machine learning, namely Support Vector Machine (SVM) regression method, is developed to generate pseudo-CT from MR information. First, the preprocessing process including registration, masking, and normalization is conducted. Then, the SVM method is used to find the weights that can transform MRI to pseudo-CT. LIBSVM4 software in Matlab is used for SVM regression. ε-SVR (epsilon support vector regression) is selected as the SVM formulation. The regression input and output demonstration is shown in Fig. 2.
GMR method: GMR method is performed by aligning the voxel intensity, mean value, and standard deviation of each neighborhood as input and training the model of 20 multivariate Gaussians.
PET reconstruction: To compare the results of above methods on the PET images, we reconstruct the PET images using Ordered Subset-expectation Maximization (OSEM) with 9 subsets and 16 iterations, with attenuation maps derived from the three methods discussed above.
Results
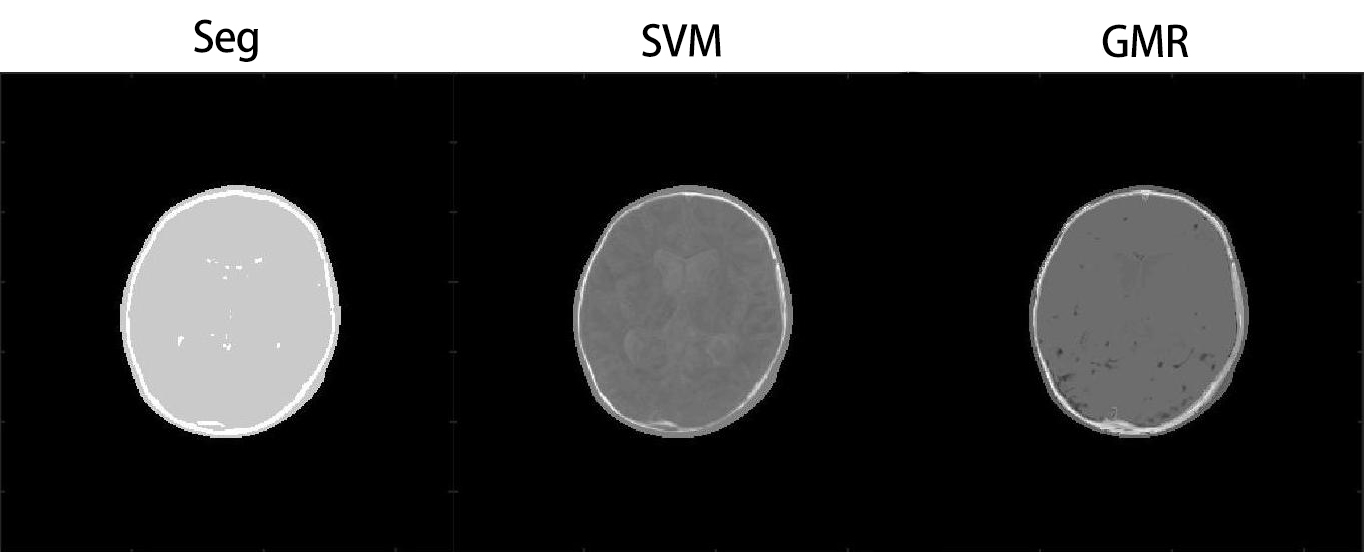
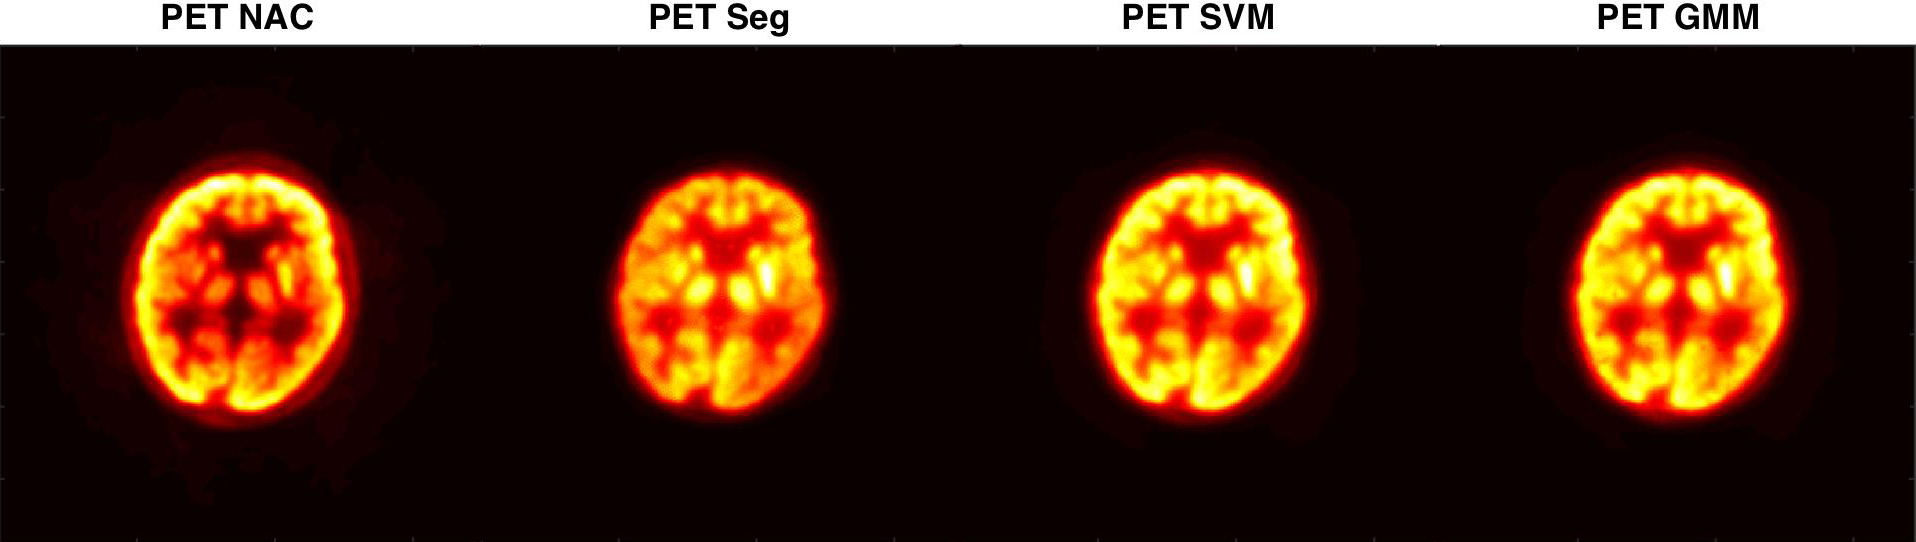
Fig. 3 shows the attenuation maps of the segmentation-based, SVM, and GMR methods respectively. The segmentation-based method only classifies the voxels into 1 of 3 tissue classes (bone, soft tissue or air), while SVM method has more classifications. Fig. 4 shows the PET reconstruction results with the segmentation-based, SVM, and GMR methods respectively. All three methods have improvement in the attenuation correction of PET image, but SVM method appears to have the best result.Discussion and Conclusions
This work presents three PET/MRI attenuation correction methods and compares the feasibility of these methods for children's brain imaging. Although true CT images have not been acquired due to potential radiation to children, and SVM and GMR method were accomplished based on data of adults' brain, the SVM method appears to produce better attenuation map and improve PET image accuracy.Acknowledgements
This work was supported by Tsinghua University Initiative Scientific Research Program.References
[1] Yang Y, Cao M, Kaprealian T, et al. Accuracy of UTE-MRI-based patient setup for brain cancer radiation therapy[J]. Medical physics, 2016, 43(1): 262-267.
[2] Johansson A, Karlsson M, Nyholm T. CT substitute derived from MRI sequences with ultrashort echo time[J]. Medical physics, 2011, 38(5): 2708-2714.
[3] Keereman V, Fierens Y, Broux T, et al. MRI-based attenuation correction for PET/MRI using ultrashort echo time sequences[J]. Journal of nuclear medicine, 2010, 51(5): 812-818.
[4] Chang CC et al. LIBSVM software. http://www.csie.ntu.edu.tw/~cjlin/libsvm
Figures