1336
Impact of new attenuation correction methods on whole-body PET/MR1High Field and Hybrid MR Imaging, University Hospital Essen, Essen, Germany, 2Erwin L. Hahn Institute for MR Imaging, University Duisburg-Essen, 3Department of Nuclear Medicine, University Hospital Essen, 4Department of Diagnostic and Interventional Radiology and Neuroradiology, University Hospital Essen, 5Siemens Heathineers, Siemens AG, Erlangen, Germany
Synopsis
Recent developments in MR-based whole-body PET/MR attenuation correction allow for adding bone information and for eliminating truncation artefacts along the patients’ arms using the HUGE technique. 43 patients underwent a PET/MR whole-body examination. The PET SUVmax of 57 active lesions were measured for PET data reconstructed with four different µmaps: standard, standard+bone, standard+HUGE, and standard+bone+HUGE. Compared to the standard-µmap, the mean SUVmax of all 57 lesions increases by 14%±12% when adding bone, by 17%±12% when adding HUGE, and by 24%±19% when adding bone+HUGE. These results are an important step towards improved MR-based attenuation correction in whole-body PET/MR hybrid imaging.
Introduction
In clinical PET/MR patient examinations, the attenuation and scatter of photons caused by the patient tissue is corrected by using an MR-based µmap. This Dixon-VIBE sequence-based µmap segments several tissue classes and allocates specific linear attenuation coefficient (LAC) to the tissue classes. This is established standard in current PET/MR systems [1]. The 4 tissue classes (background air, fat, lung, and soft tissue) provide an approximation of the patient attenuation, although the high attenuating bone parts are not considered. Additionally, the limited diameter of the MR Field-of-View (FoV) compared to the PET-FoV may lead to truncation artifacts along the patient arms. Recent developments in MR-based attenuation correction (AC) now allow the addition of complementary information to the human µmap. In this context, the HUGE technique allows for extension of the MR-based FoV to eliminate truncation artifacts [2]. Further, a model-based atlas allows for addition of bone attenuation coefficients to the MR-based µmaps [3].Material and Methods
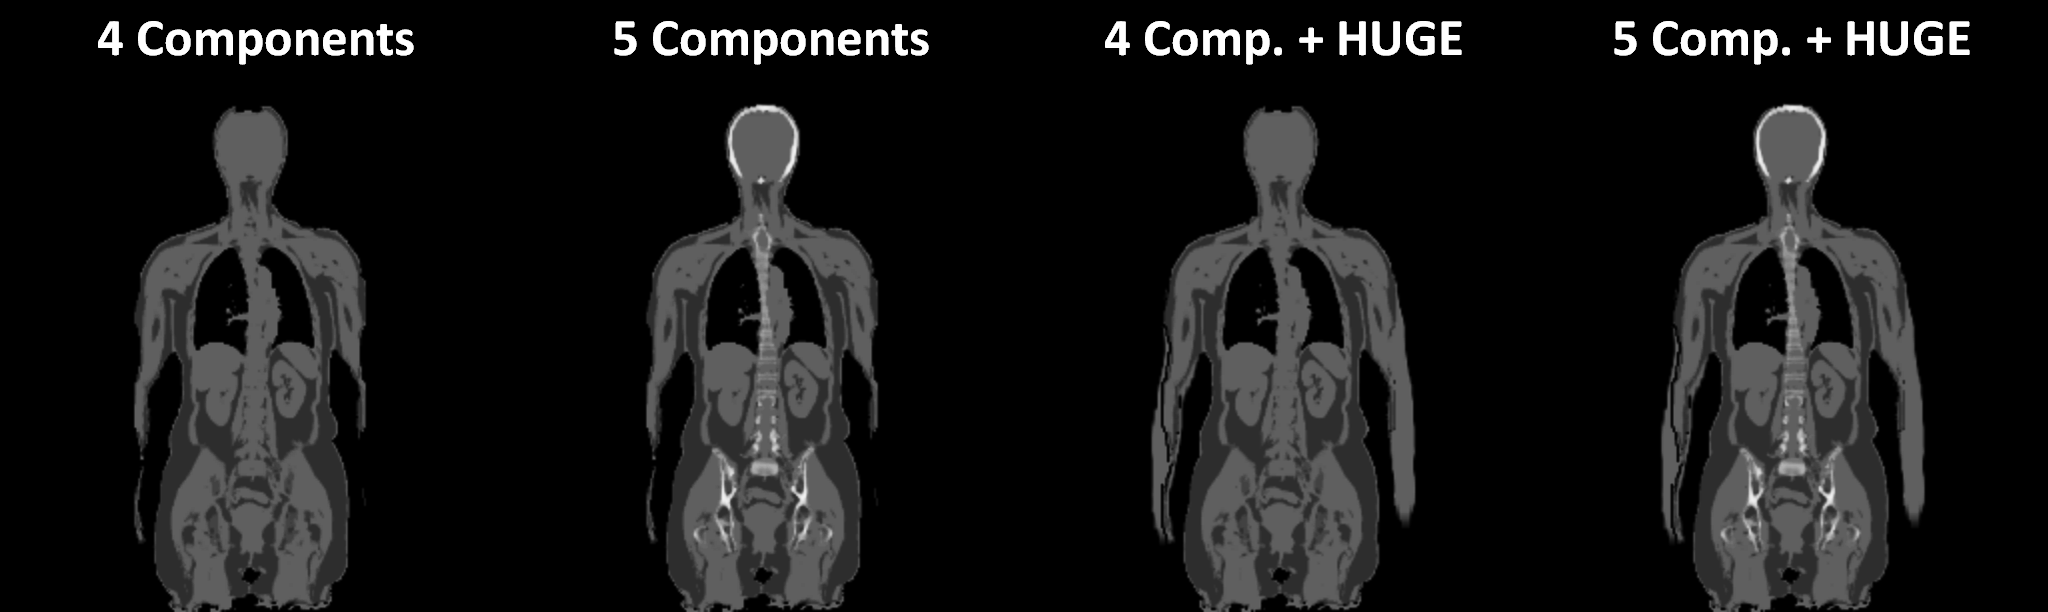
All measurements were performed on an integrated whole-body PET/MR hybrid system (Biograph mMR, Siemens Healthcare, Erlangen, Germany). 43 patients (22 female and 21 male, mean age 52±15 years) with a wide range of indications were injected with radiotracer 18F-FDG and underwent a whole-body PET/MR examination. For attenuation correction (AC), four different µmaps were generated offline for each patient to evaluate the influence of the additional information on the SUVmax value in PET active lesions. 1. The 4-component-µmap serves as reference standard (Fig. 1A) and was compared individually to 2. the 5-component-µmap including bone (Fig. 1B), 3. the 4-component-µmap+HUGE (Fig. 1C), and 4. the 5-component-µmap+HUGE (Fig. 1D). The four offline-generated patient µmaps are based on a coronal Dixon-VIBE (volumetric interpolated breath-hold examination) sequence with the following scan parameters: parallel imaging factor, 5; matrix 406x450 with 2.3×2.3 mm2 pixel size, 128 slices a 3.2 mm, TR 4.0 ms, TE 1.2 ms, TA = 13 s per bed position. PET data of the patients were reconstructed iteratively using 3D OP-OSEM (3 subsets, 21 iterations) using the standard reconstruction parameters used for PET/MR imaging: 344×344 with (2.09×2.09) mm2 pixel spacing and 127 slices with 2.03 mm slice thickness. To create four comparable AC image datasets, the PET rawdata and the µmaps were retrospectively reconstructed using the system provided tool ‘RetroRecon’ by Siemens. For each patient, the non-AC PET data was reconstructed four times using each of the 4 different µmaps. To visualize activity differences between the four reconstructed AC PET datasets, the AC PET data using new features (HUGE and bone) was divided by the reference standard 4-component µmap. The four AC-PET image datasets were evaluated and read out by an experienced radiologist and nuclear medicine specialist in consensus. Image reading consisted of identifying the lesions, depicting volume-of-interest and computing the SUVmax four times for each lesion, this was done with the help of syngo.via workstation (Siemens Healthcare, Erlangen, Germany).Results
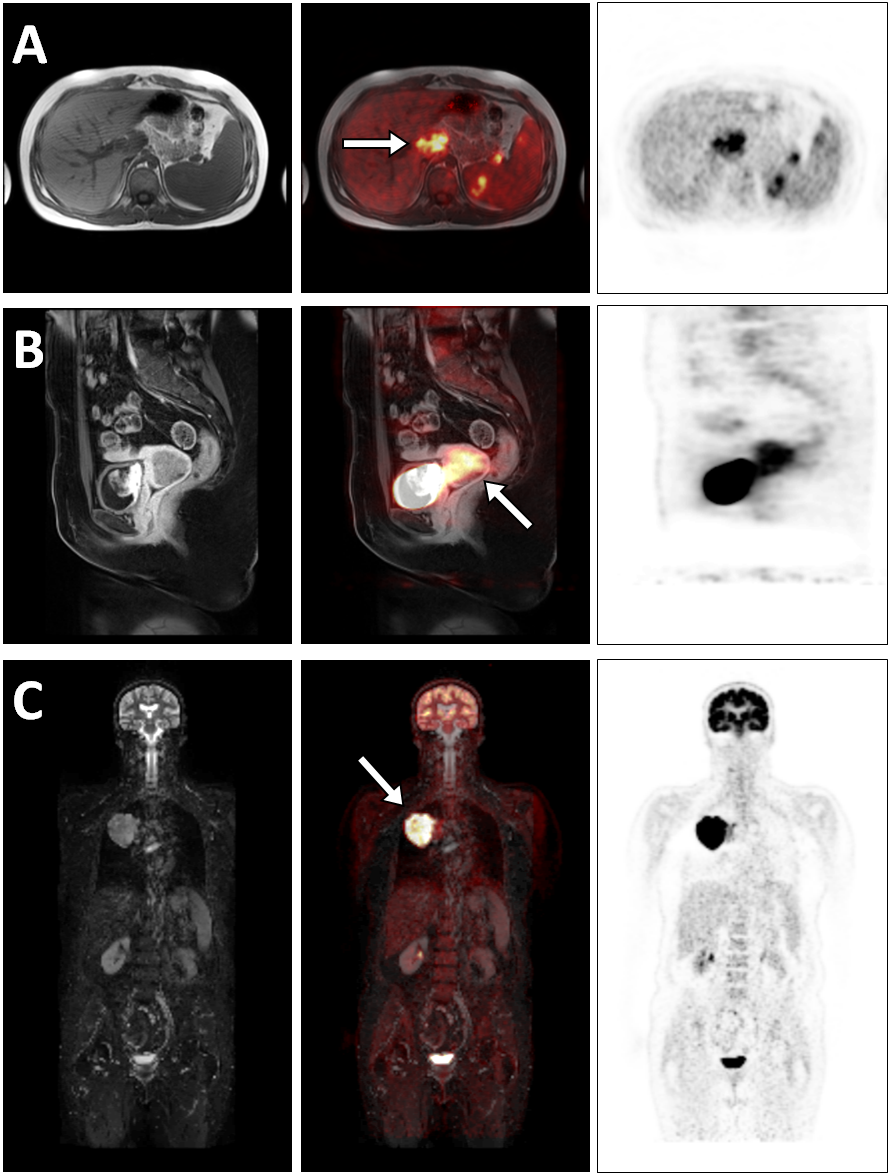
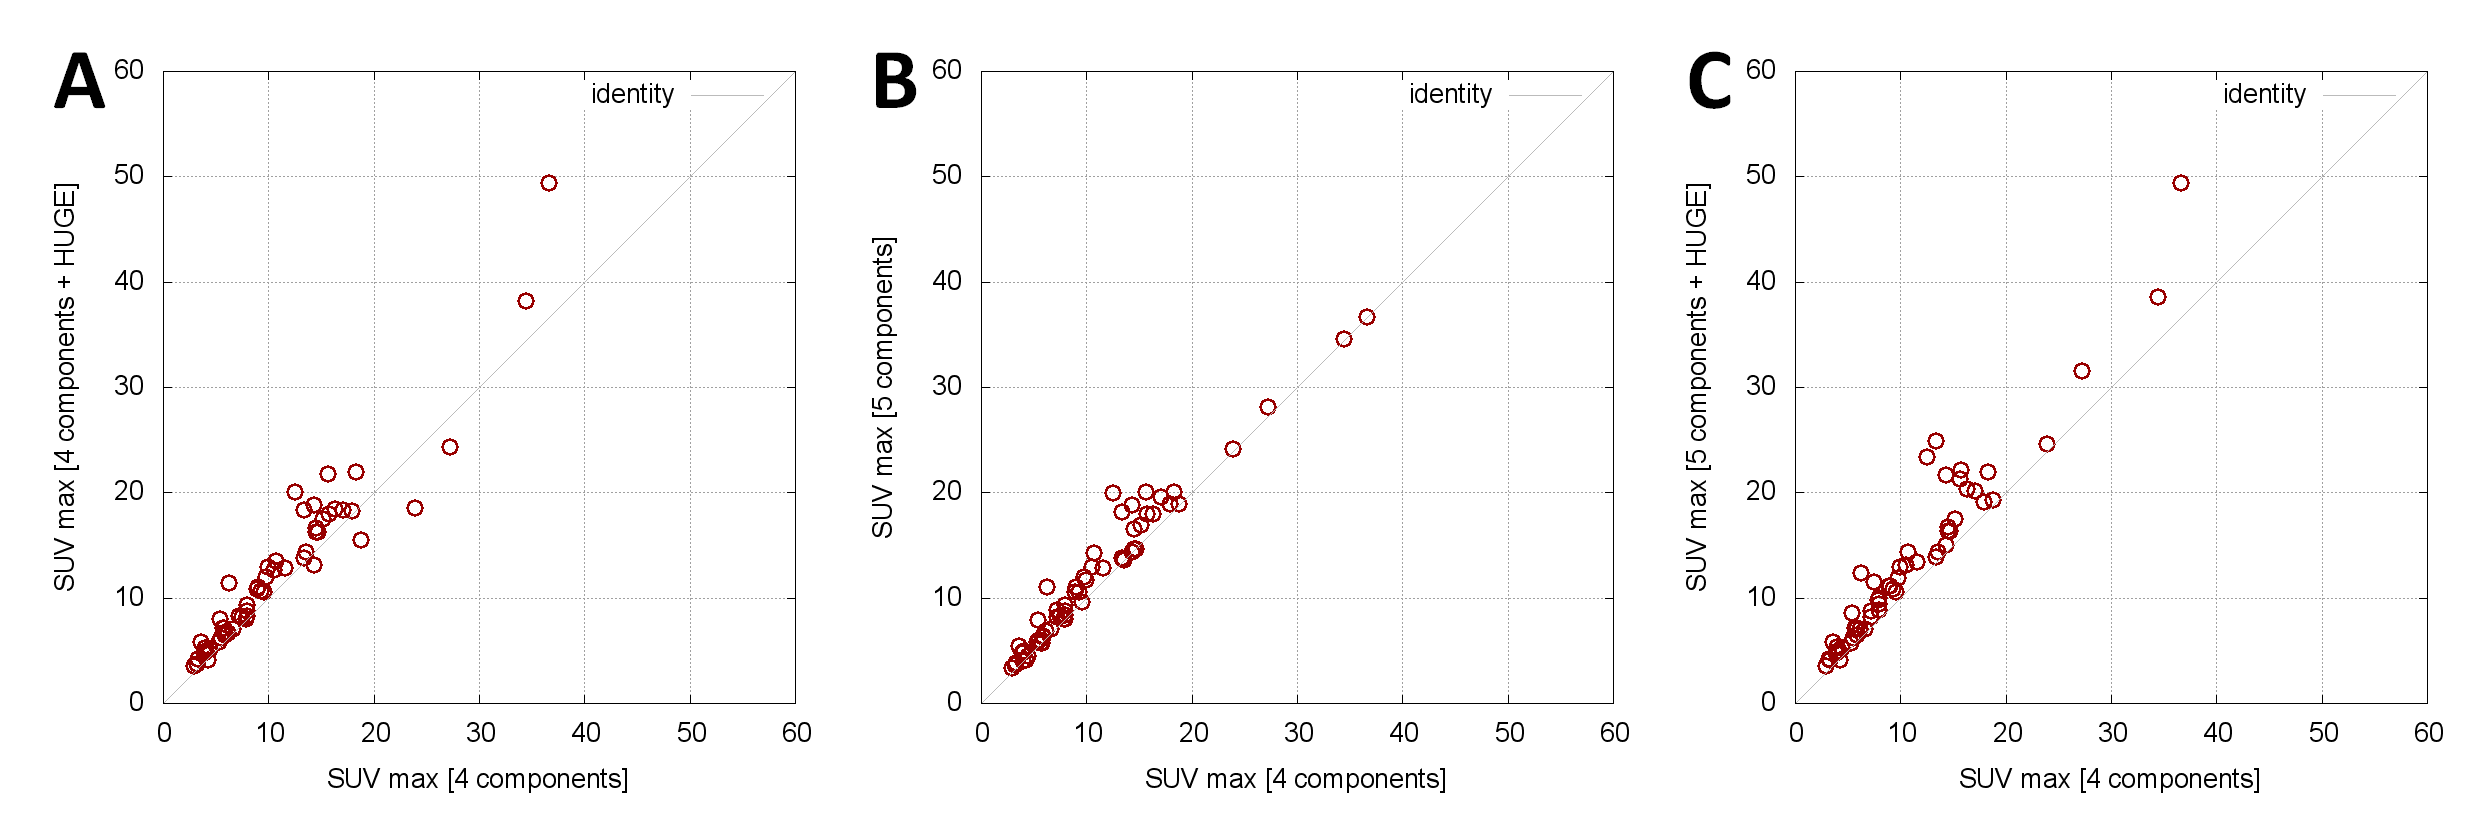
Out of the 43 examined patients 26 patients could be identified with overall 57 malignant lesions (Table 1). Using the offline generated human µmaps, the AC PET data were used for lesion detection (Figure 2). The three graphs in Figure 3 show the relation between 2 µmaps each, where the x-axis represents the reference standard with the SUVmax of the 4-component-µmap. The y-axis provides the SUVmax values of identical (congruent) lesions with 4-component-µmap+HUGE (Fig. 3A). Consequently, each lesion above the diagonal line shows an increase of the SUVmax by using additional information. The mean SUVmax of all 57 lesions increases by 14%±12% when comparing the 4-component-µmap with the 4-component-µmap+HUGE. In figure 3B the influence of additional bone information is depicted, the mean SUVmax of all 57 lesions increases by 14%±12% when comparing the 4-component-µmap with the 5-component-µmap. In figure 3C the SUVmax of the 4-component-µmap and the 5-component-µmap+HUGE is depicted. The mean SUVmax of all 57 lesions increases by 24%±19% in total when using all additional information compared to the 4-component-µmap.Discussion
It was shown that adding new features such as MR-based truncation correction with HUGE and model-based addition of bone to the standard Dixon-VIBE attenuation correction have measurable impact on the PET-quantification in a patient setting. Depending on the relative position of each individual lesion within the body and with regard to truncations and bone, the impact will vary. Accordingly and intuitively, the SUVmax of bone lesions increases comparably stronger than that of soft tissue lesions when adding bone attenuation to the µmap. These results can be seen as an important step towards improved MR-based attenuation correction in whole-body PET/MR hybrid imaging.Acknowledgements
No acknowledgement found.References
[1] Investigating the state-of-the-art in whole-body MR-based attenuation correction: an intra-individual, inter-system, inventory study on three clinical PET/MR systems. Beyer T, Lassen ML, Boellaard R, Delso G, Yaqub M, Sattler B, Quick HH. MAGMA. 2016; 29:75-87.
[2] Field of view extension and truncation correction for MR-based human attenuation correction in simultaneous MR/PET imaging. Blumhagen JO, Braun H, Ladebeck R, Fenchel M, Faul D, Scheffler K, Quick HH. Med Phys. 2014 Feb;41(2):022303.
[3] Whole-Body PET/MR Imaging: Quantitative Evaluation of a Novel Model-Based MR Attenuation Correction Method Including Bone. Paulus DH, Quick HH, Geppert C, Fenchel M, Zhan Y, Hermosillo G, Faul D, Boada F, Friedman KP, Koesters T. J Nucl Med. 2015;56:1061-1066.
Figures