1333
Simultaneous Estimation of ADC, T2-relaxation, Perfusion and 11C-acetate PET Uptake in Prostate Cancer1Department of Radiation Sciences, Umeå University, Umeå, Sweden, 2Department of Radiology, Uppsala, Sweden, 3Healthcare Systems, GE Healthcare, Stockholm, Sweden, 4Applied Science Laboratory, GE Healthcare, Uppsala, Sweden
Synopsis
Multiparametric MRI is the standard to evaluate suspected prostate cancer. T2-weighted and DWI are essential, while DCE is less crucial. We here demonstrate that simultaneous quantification of ADC, T2-relaxation and perfusion fraction f, which was calculated from non-IVIM low b-value data, is feasible in combination with 11C-acetate PET/MR imaging. ADC and T2-values differed significantly between healthy tissue and cancer, while f was more inconsistent. An important benefit of simultaneous acquisition is the lack of image mismatch between T2-maps and DWI. This enables more objective tumor grading, decreased inter-rater variability and using mathematical/statistical approaches or computer-aided detection to estimate cancer probability.
TARGET AUDIENCE
Clinicians interested in multiparametric imaging, PET/MR and prostate cancer.PURPOSE
Multiparametric MRI has become the standard to evaluate suspected prostate cancer, which can be combined with molecular imaging in PET/MR scanners. PI-RADSTM (Prostate Imaging – Reporting and Data System) is used to determine a probability score of a lesion being a clinically significant cancer. T2-weighted and diffusion-weighted imaging (DWI) are essential, while dynamic-contrast enhanced (DCE) is less crucial1,2. To further standardize evaluation and decrease inter-rater variability objective measures are in need. ADC can be used for diffusion, while T2-relaxation quantification, even T2*-relaxation, has gained interest in recent years3-6. Another potential parameter is the perfusion fraction (f) from non-IVIM (intravoxel incoherent motion) low b-value data, which correlates with Ktrans 7. Finally, standardized uptake value (SUV) can be measured in PET. One problem with fusing separate MRI sequences is the mismatch to DWI due to the strong diffusion gradients8. We here demonstrate that simultaneous quantification of ADC, T2-relaxation and f, in combination with 11C-acetate PET imaging is feasible in prostate cancer.METHODS
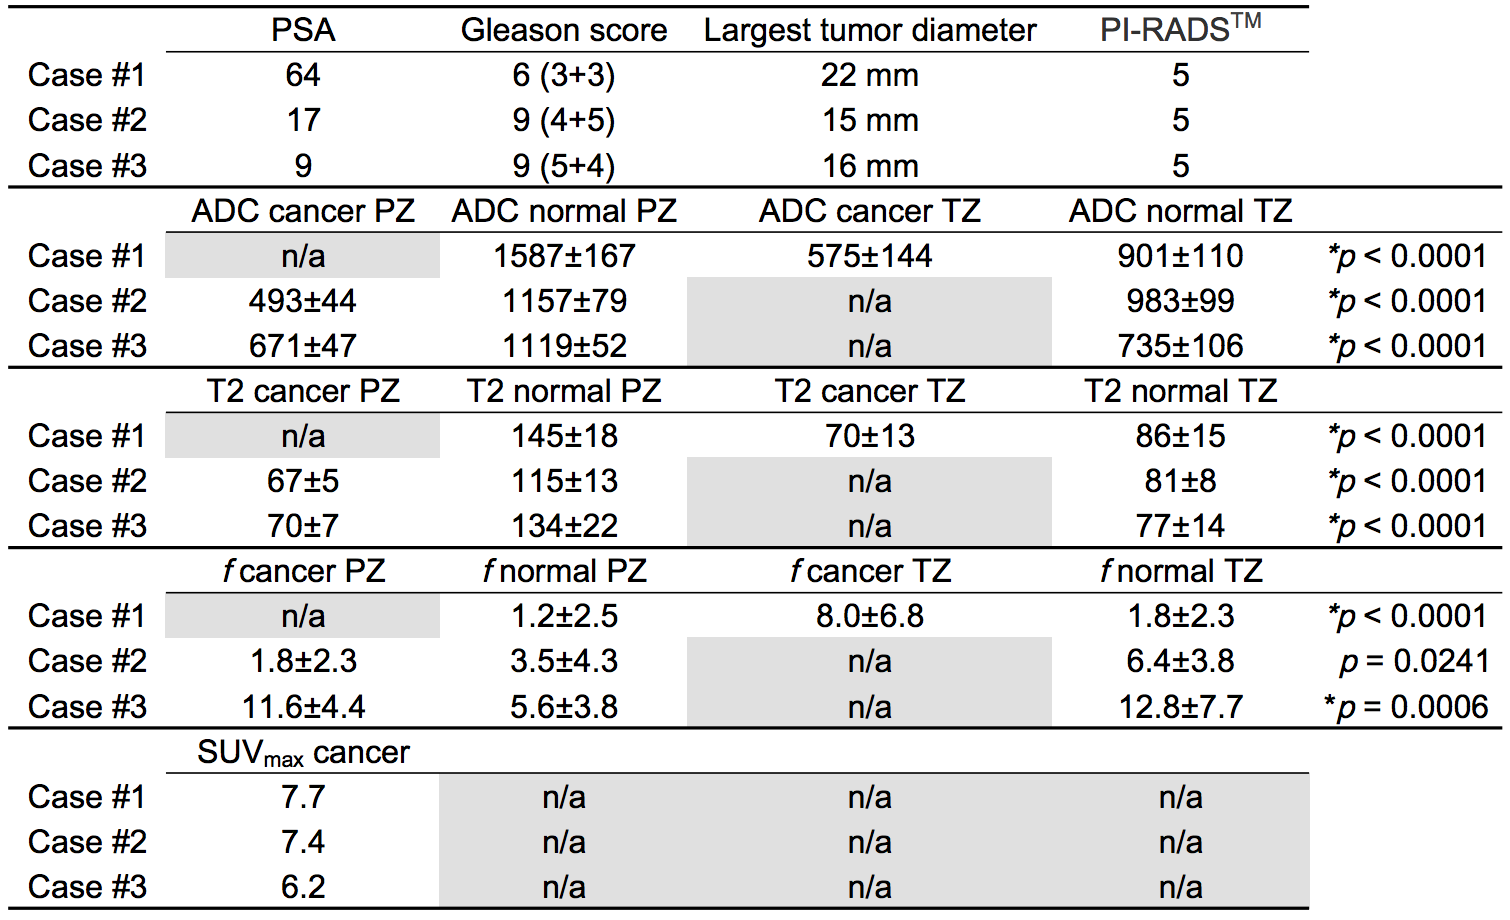
A 3.0 T PET/MR (Signa PET/MR, GE Healthcare, Milwaukee, WI) with a Central Molecular Imaging Array (CMA, GE Healthcare, Milwaukee, WI) and Lower Anterior Array (LAA, GE Healthcare, Milwaukee, WI) coil combination was used to examine three patients with prostate cancer. The study was approved by the local ethics committee and informed consent was given. A novel integrated sequence based on the FOCUS9 DW-SE EPI sequence was used, which also included T2-estimation by acquiring different TEs without diffusion gradients, and post-acquisition motion correction. Relevant scan parameters were b=200 s/mm2 (NEX=3) and b=600s/mm2 (NEX=8) to calculate ADC, T2-maps using 6 TEs (NEX=5) between 64.9 ms and 114.9 ms (ΔTE=10 ms), FOV=320×160 mm, matrix=120×60, TR=4000 ms, slice thickness=5 mm, slice spacing=0.1 mm, NSlices=16, and total time 4.36 min. f was calculated according to Pang et al7. Patients were also examined with axial and sagittal T2-weighted images, axial T1-weighted images and 11C-acetate PET (registration started 10 minutes post-injection). A radiologist categorized PI-RADS and placed ROIs in normal tissue and tumors. PSA and Gleason scores are presented in Table 1. An unpaired two-tailed t-test was used to compare the tumor mean value for ADC, T2 and f, with the corresponding normal tissue for each patient. In total, nine tests were performed. The Bonferroni-corrected significance level at alpha=0.05 was p=0.006.RESULTS
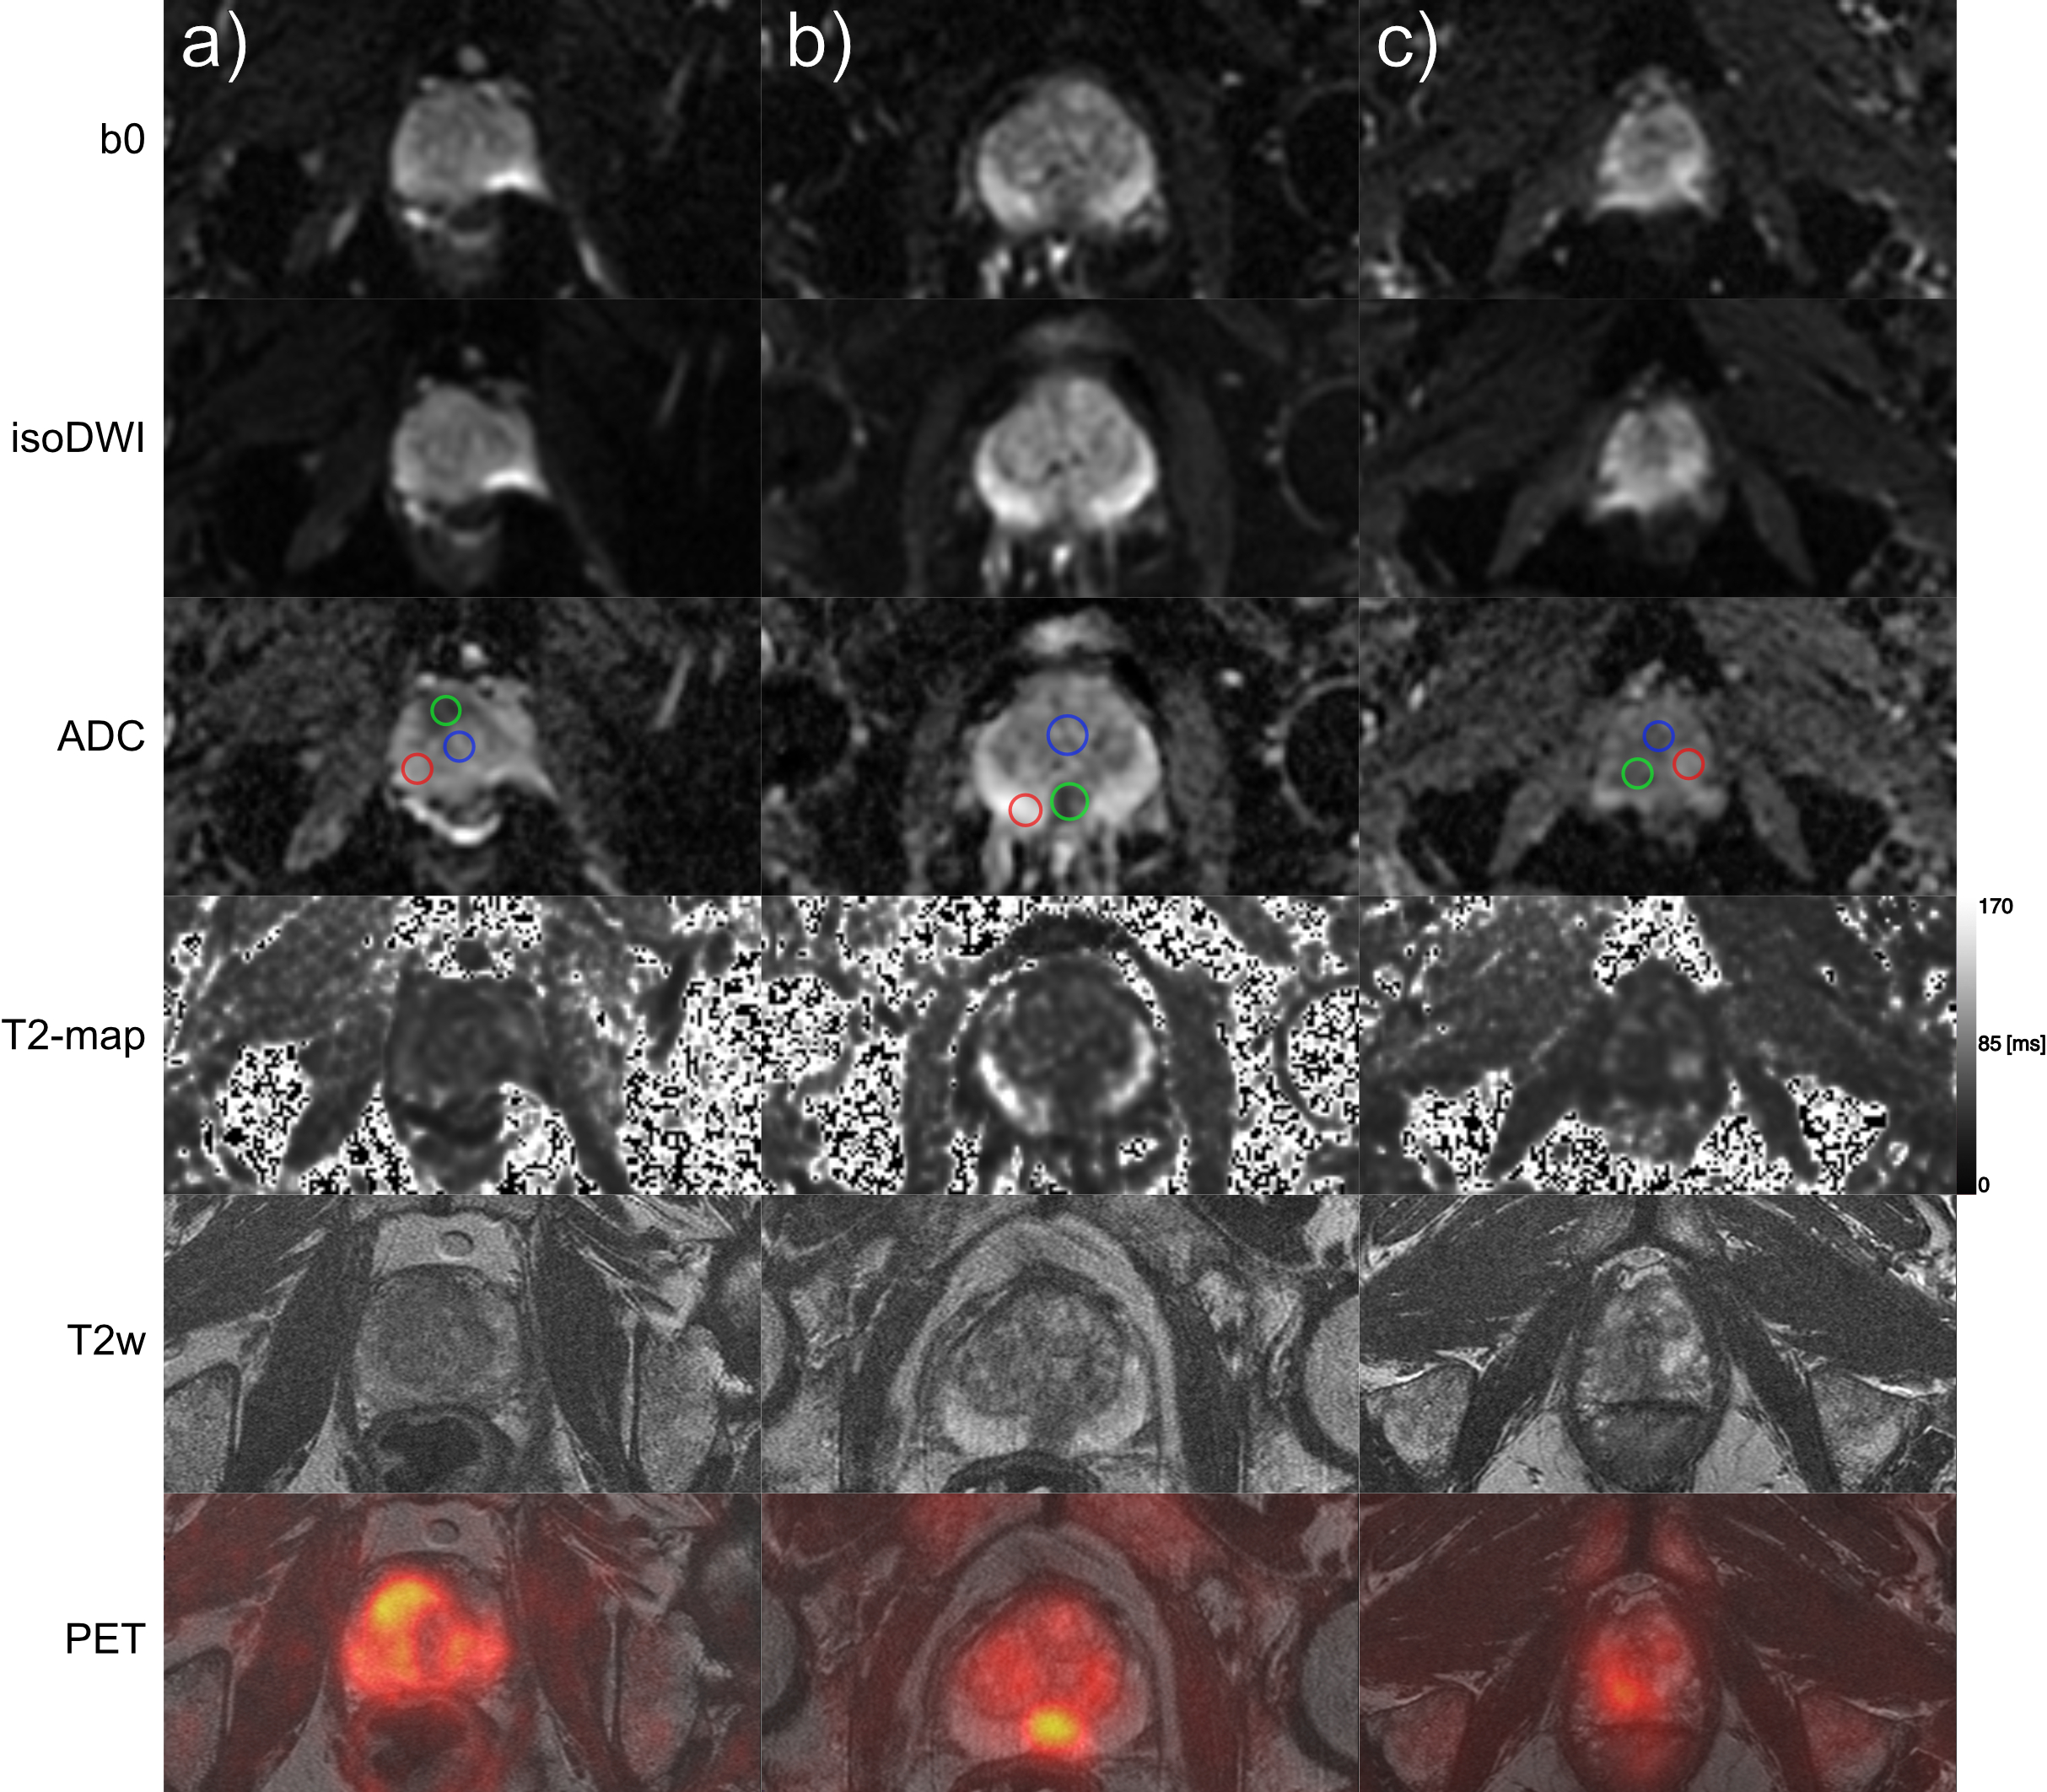
In Table 1 largest tumor diameter, PI-RADS, ADC, T2-estimates, f, SUVmax and p values are presented. ADC and T2-estimates differed significantly between normal tissue and cancer, while f was significant in 2/3 cases. Fig. 1 demonstrates b0, isoDWI, ADC, T2-maps, T2-weighted and 11C-acetate PET uptake fusion-images.DISCUSSION
ADC, T2-relaxation and perfusion fraction (f) can be estimated on a voxel level in prostate cancer, without the need of image fusion. Data was acquired in combination with 11C-acetate PET imaging, enabling an additional molecular parameter, with SUVmax being elevated in all tumors. Both peripheral zone and transition zone cancers had decreased ADC and T2-values, while 2/3 cancers had increased f. Restricted diffusion, and to some degree decreased T2-signal, correlates with cell density in prostate cancer, although an overlap exists between benign and malignant3. We believe that especially simultaneous estimation of ADC and T2-measures could contribute to an easier categorization in PI-RADS (e.g., differentiating category 3 and 4, with either DWI or T2-images, mainly depends on visual assessment of signal intensities). For f estimation, further studies are needed to evaluate the effects of SNR. Potentially, similar to DCE in PI-RADS, f could be used as a complement in specific cases (e.g. would an increased perfusion upgrade a peripheral zone cancer categorized as 3 on DWI to category 4). The highest b-value used in the study was 600 s/mm2, since higher b-values would not enable f calculation due to the increasing effect of bi-exponential decay7. However, if omitting f calculation, b-values of 800-1000 can instead be used in concordance with the European Society of Urogenital Radiology recommendation1,7. Notably, the choice of b-values will affect the ADC10. Although EPI is acquired with fat saturation, T2-estimates were comparable to published data in normal prostate and cancer4,5. An important benefit of acquiring all data within one acquisition is the lack of mismatch between T2-maps and DWI with all MRI sequence parameters kept constant, instead of combining different acquisitions as for other hybrid sequences11,12. 11C-acetate, a radiotracer reflecting lipogenesis was simultaneously acquired, which enables another parameter assisting in grading and staging of prostate cancer. Mathematical/statistical approaches, e.g. using principal component analysis, or computer-aided detection could use these 3-4 parameters to estimate a cancer probability13,14.CONCLUSION
Simultaneous estimation of ADC, T2-relaxation, f and PET uptake is feasible in prostate cancer. This enables objective tumor grading, extended standardization and decreased inter-rater variability.
Acknowledgements
No acknowledgement found.References
1. Weinreb JC, Barentsz JO, Choyke PL, et al. PI-RADS Prostate Imaging - Reporting and Data System: 2015, Version 2. Eur Urol. 2016;69(1):16-40
2. Simpkin CJ, Morgan VA, Giles SL, Riches SF, Parker C, deSouza NM. Relationship between T2 relaxation and apparent diffusion coefficient in malignant and non-malignant prostate regions and the effect of peripheral zone fractional volume. Br J Radiol. 2013;86(1024):20120469
3. Gibbs P, Liney GP, Pickles MD, Zelhof B, Rodrigues G, Turnbull LW. Correlation of ADC and T2 measurements with cell density in prostate cancer at 3.0 Tesla. Invest Radiol. 2009;44(9):572-576
4. Hoang Dinh A, Souchon R, Melodelima C, et al. Characterization of prostate cancer using T2 mapping at 3T: a multi-scanner study. Diagn Interv Imaging. 2015;96(4):365-372
5. Metzger GJ, Kalavagunta C, Spilseth B, et al. Detection of Prostate Cancer: Quantitative Multiparametric MR Imaging Models Developed Using Registered Correlative Histopathology. Radiology. 2016;279(3):805-816
6. Wu LM, Zhao ZZ, Chen XX, et al. Comparison of T2(*) mapping with diffusion-weighted imaging in the characterization of low-grade vs intermediate-grade and high-grade prostate cancer. Br J Radiol. 2016;89(1063):20151076
7. Pang Y, Turkbey B, Bernardo M, et al. Intravoxel incoherent motion MR imaging for prostate cancer: an evaluation of perfusion fraction and diffusion coefficient derived from different b-value combinations. Magn Reson Med. 2013;69(2):553-562
8. Rakow-Penner RA, White NS, Margolis DJ, et al. Prostate diffusion imaging with distortion correction. Magn Reson Imaging. 2015;33(9):1178-1181
9. Saritas EU, Cunningham CH, Lee JH, Han ET, Nishimura DG. DWI of the spinal cord with reduced FOV single-shot EPI. Magn Reson Med. 2008;60(2):468-473
10. Peng Y, Jiang Y, Antic T, et al. Apparent diffusion coefficient for prostate cancer imaging: impact of B values. AJR Am J Roentgenol. 2014;202(3):W247-253
11. Wang S, Peng Y, Medved M, et al. Hybrid multidimensional T(2) and diffusion-weighted MRI for prostate cancer detection. J Magn Reson Imaging. 2014;39(4):781-788
12. Zhou. A Fast Method for Simultaneous ADC and T2 Mapping Using Spin Echo EPI Sequence. Proc Intl Soc Mag Reson Med 24 (2016) 2493
13. Gatidis S, Scharpf M, Martirosian P, et al. Combined unsupervised-supervised classification of multiparametric PET/MRI data: application to prostate cancer. NMR Biomed. 2015;28(7):914-922
14. Liu L, Tian Z, Zhang Z, Fei B. Computer-aided Detection of Prostate Cancer with MRI: Technology and Applications. Acad Radiol. 2016;23(8):1024-1046.
Figures