1330
Probabilistic analysis of the SAR intersubject variability safety factor in parallel transmission MRI1DRF/I2BM/NeuroSpin, CEA, Gif sur Yvette, France, 2DRF/Irfu/SACM, CEA, Gif sur Yvette, France
Synopsis
Electromagnetic simulations remain to date the preferred method to assess the Specific Absorption Rate (SAR). Within that framework, taking into account the SAR intersubject variability by using a multiplicative safety factor on generic model results remains attractive due to its computational simplicity. Here we report a probabilistic analysis based on the unscented transform sampling scheme followed by the reconstruction of a polynomial approximation of the SAR with respect to head geometrical and position variables. Probabilities of exceeding a given SAR value in the population are returned and safety factors can be deduced based on risk over benefit ratio assessments.
Purpose
In head MRI, Specific Absorption Rate (SAR) is typically predicted through the use of electromagnetic (EM) simulations on numerical head models. The question regarding the sensitivity of the results with respect to anatomical and geometrical deformations yet remains often raised1, especially in parallel transmission (pTx). Although appealing from the conceptual point of view, if statistical information is sought, brute-force Monte-Carlo trials appear intractable given the time-consuming aspect of each EM simulation and the few detailed numerical models available. In this work we propose to sample four SAR-sensitive variations to reconstruct a multivariate polynomial approximation of the peak SAR with respect to the different geometrical head entries, here modelled as normal random variables. This pulse-dependent polynomial reconstruction then returns an analytical formula for the SAR which then allows computing the probability of exceeding a given SAR value in an entire population and thereby deduce reasonable safety margins.Methods
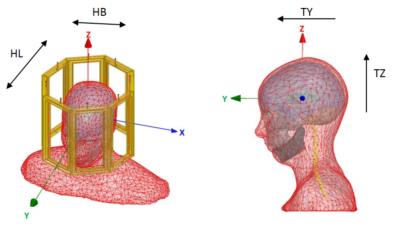
The coil under study was the 8 Tx-Rx Rapid biomedical coil (Rapid biomedical, Rimpar, Germany). Thirty three EM simulations using the finite-element HFSS (Ansys, Canonsburg, PA, USA) solver were performed to sample the 4-dimensional parameter space consisting of the head length (HL), head breadth (HB), translations in Z (TZ) and in Y (TY) (Fig.1). The generic average head model was taken as an in-house surface-based model (9 tissues) which included shoulders and whose dimensions were very close to the mean of the adult Caucasian population2. HL, HB, TZ and TY were modeled as random normal variables (denoted Xi=1…4) with zero means and standard deviations (std) taken from2 for the first two variables (7 and 6 mm respectively), while 15 and 3.8 mm were taken respectively for the last two so that 3 stds would encompass all possible scenarios. The sampling points at which full EM simulations were performed were determined by following the unscented transform scheme3: $$$(\pm\sigma_1,\pm\sigma_2,\pm\sigma_3,\pm\sigma_4)\sqrt{3/2}$$$, $$$(0,\pm\sigma_k,...,0)\sqrt{6}$$$, $$$(0,\pm\sigma_k,...,0)\sqrt{3}$$$ and $$$(0,0,0,0)$$$ (the origin, i.e. average model), where $$$\sigma_k$$$ denotes the std of Xk. The corresponding 10-g SAR matrices were then calculated for each setup/model. A given RF excitation then returned a peak 10-g SAR value over 33 setups which was normalized by the average model peak SAR to yield the dimensionless variable SARN= SAR(Xi=1…4)/SAR(Xi=1…4= 0). Assuming a smooth dependence with respect to Xi=1…4 the normalized SAR was modeled as a multivariate second order polynomial4
$$SAR_N=a_0+a_1X_1+a_2X_2+a_3X_3+a_4X_4+a_{1,2}X_1X_2+a_{1,3}X_1X_3+a_{1,4}X_1X_4+\cdot\cdot\cdot$$
$$a_{2,3}X_2X_3+a_{2,4}X_2X_4+a_{3,4}X_3X_4+b_1X_1^2+b_2X_2^2+b_3X_3^2+b_4X_4^2\cdot$$
The 15 coefficients of this polynomial were reconstructed by a weighted-least squares fit to take into account the probability of occurrence of the Xi values. The observed peak SAR being pulse-dependent, several RF excitation schemes were tested: 105 random RF shims, 105 random 5 kT-points, a CP-mode, a universal inversion pulse tailored to work robustly over the 33 models5 and 33 (non-random) tailored RF shims (one for each setup). Once the polynomials were reconstructed for each RF pulse, 106 random values of Xi=1…4 were generated according to their native normal probability distributions to compute the corresponding 106 SARN values. Probabilities to exceed a given SAR threshold could then be deduced by simply counting the number of SAR values exceeding that limit.
Results
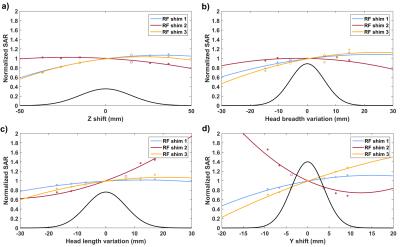
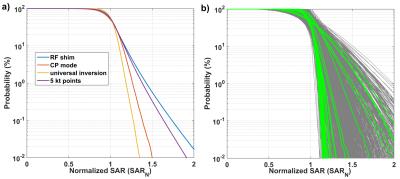
Figure 2 reports the results of the multivariate polynomial fits along each variable Xi and for 3 different RF pulses. The SAR sampled at the 33 points in the geometrical and position space investigated behaves relatively smoothly so that second order polynomials appear reasonable approximations. The probability to exceed a given peak SAR for the entire population is provided for each pulse type (the average being taken for the 105 RF-shim and 5 kT-point scenarios) in Fig.3.a. A 1.5 safety factor keeps the probability of exceeding the corresponding SAR result below 1 % for most RF pulses, although the pulse variability shown in Fig.3.b of these results should be kept in mind.
Discussion and conclusion
We have reported an analysis to determine SAR safety margins in an entire population with a reasonable number of EM simulations. Here 4 model variations were enforced due to their observed relevance in3,5. The SAR variability with respect to these transformations can be highly pulse-dependent but yet relatively smooth (Fig.2), thereby justifying a second order polynomial approximation. The results of Fig.3 provide valuable information to determine the safety factors to safely operate at 7T the head coil under investigation. When choosing such safety margin on a pTx system, however, it may be worth stressing that the latter margin is often multiplied by additional safety factors accounting for other sources of uncertainties such as modelling errors or directional couplers measurement uncertainties5.Acknowledgements
The research leading to these results has received funding from the European Research Council under the European Union’s Seventh Framework Program (FP7/2013-2018), ERC Grant Agreement n. 309674. We thank A. Amadon, A. Vignaud and F. Mauconduit for valuable discussions.References
[1] de Greef M et al. MRM 2013;69 :1476-1485. [2] Ball R et al. Applied Ergonomics 2010;41:832-839. [3] Shao Y et al. MRM 2015;2357-2362. [4] Dos Santos I et al. Phys Med Biol 2009;59:627-640. [5] Gras V et al. MRM doi: 10.1002/mrm.26148.Figures


