1327
Squeezed Variable Density Spiral Trajectory for SAR Reduction in Parallel Transmission 2D RF Design1Center for Brain Imaging Science and Technology, Department of Biomedical Engineering, Zhejiang University, Hangzhou, Zhejiang, People's Republic of China
Synopsis
A squeezed variable density spiral (SVDS) trajectory was proposed to reduce SAR and peak RF power in 2D RF pulse design using parallel transmission (pTX). SVDS was generated by applying a pointwise squeezing factor to conventional variable density spiral (CVDS) trajectory. Compared to CVDS, SVDS can reduce peak RF and SAR by close to 40%, with minimal increase in the normalized root mean square error (NRMSE) of the excitation profile and pulse duration.
Purpose
Specific absorption rate (SAR) is a critical concern for patient safety in parallel transmission (pTX) pulse design because of the magnified RF power due to the accelerated pulse. Many RF pulse based methods 1,2 have been proposed to reduce SAR by redesigning the gradient to satisfy the SAR or peak RF power constraints from the scan-specific RF pulse design. The squeezed variable density spiral (SVDS) excitation trajectory is proposed in this work to reduce SAR without the need for customized RF pulse by applying a squeezing factor to the conventional variable density spiral (CVDS) trajectory based on the excitation k-space energy distribution of the target profile.Methods
A method based on Fourier transformation of the target excitation pattern 3 was used. First, RF pulse was designed based on the excitation k-space traversal trajectory. SAR was denoted as the time integral of the RF power. Squeezing factors were then determined via minimizing the SAR. Next, the k-space trajectory was divided into dozens of groups based on the local RF peaks. Since most of the SAR was contributed by the peaks of RF pulses, the goal was to minimize the SAR of each group by squeezing the k-space points whose RF power was lower within the group towards the point with the highest RF power. The proposed SAR optimization problem was solved by an evolutionary algorithm called Backtracking Search Optimization Algorithm (BSA) 4.
More specifically the CVDS trajectory $$$K =re^{j\theta(r)}$$$ was designed with a controllable excitation FOV (XFOV) method where $$$r$$$ is the distance to the k-space center and $$$\theta$$$ is the azimuthal angle defined as $$$\theta(r) = 2\pi\int_{0}^{r}FOV(\rho)d\rho$$$. Squeezing factor $$$S = \lambda e^{j\phi}$$$ is defined to describe the squeezing towards the k-space center by the squeezing strength parameter $$$\lambda$$$ and along the tangential direction by the squeezing angle $$$\phi$$$, which can be analytical defined as $$\lambda = 0.5(1-\lambda_{0}(r))\cdot cos(\kappa_{1}(\theta+\kappa_{2})) +0.5(1+\lambda_{0}(r))$$ and $$\phi = \phi_{0}(r)\cdot sin(\kappa_{1}(\theta+\kappa_{2})),$$ where $$$\lambda_{0}(r)$$$ and $$$\phi_{0}(r)$$$ are the referential k-space energy-based squeezing strength and squeezing angle; $$$\kappa_{1}$$$ and $$$\kappa_{2}$$$ are the polar number and rotation angle. Finally, the SVDS trajectory was generated as the product of CVDS trajectory and the squeezing factor, which then be optimized to satisfy the system limitations.
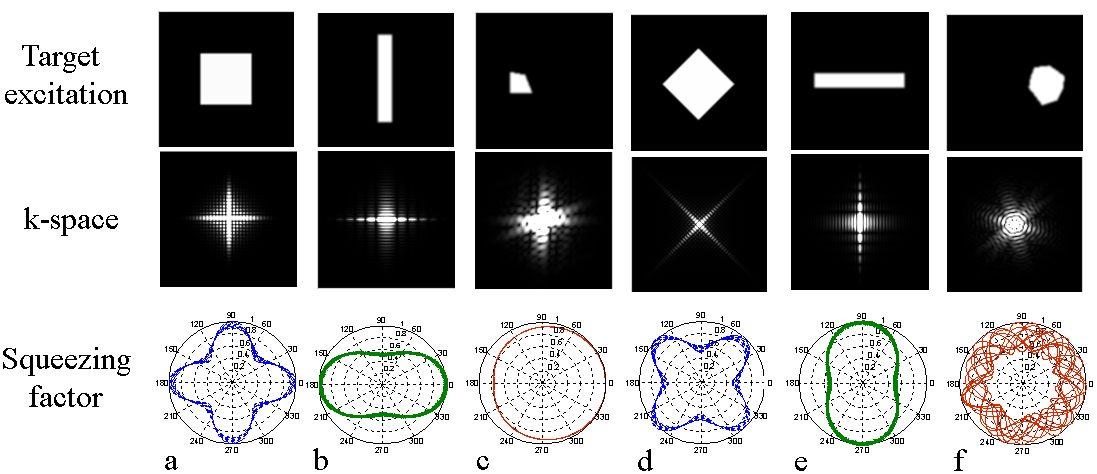
Fig. 1 shows several target excitation profiles and their corresponding k-space energy distribution as well as the squeezing factors. Measurements were performed on a Siemens 3T Prisma scanner equipped with 2 independent pTX channels. High-resolution MRI with SVDS trajectory was tested on both phantom and human brain. The pTX RF pulse was designed with a spatial domain pulse design method 5. B1+ maps were obtained by a presaturation TurboFLASH pulse sequence. Images were acquired using a SE-pTX sequence with the following parameters: matrix size = 192 × 192, TR/TE = 400/12 ms, slice thickness = 2 mm, FOV = 20 × 20 cm2 for full FOV acquisition and FOV = 10 × 10 cm2 for a reduced FOV (rFOV) imaging.
Results and Discussion
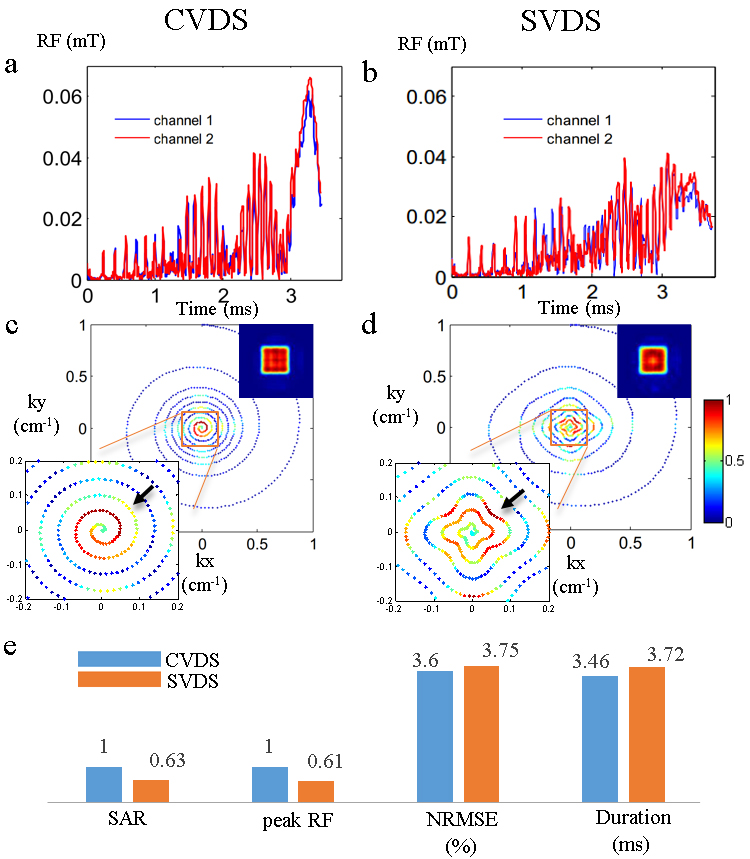
Fig 2 shows the RF pulses and Bloch simulated excitation performances of a rectangular pattern designed by the CVDS and SVDS. The black arrows over (c) and (d) indicate that RF peaks in CVDS has been dispersed to the squeezed-in points in SVDS. Thereby, the RF peak amplitude has been reduced in SVDS as shown in (b). The result is in agreement with the squeezing theory where k-space points with low RF amplitude will be squeezed towards the local RF peaks. In the rectangular excitation, SVDS has reduced the SAR and peak RF by 37% and 39% respectively, with 0.15% loss of excitation accuracy and 260 µs pulse extension.
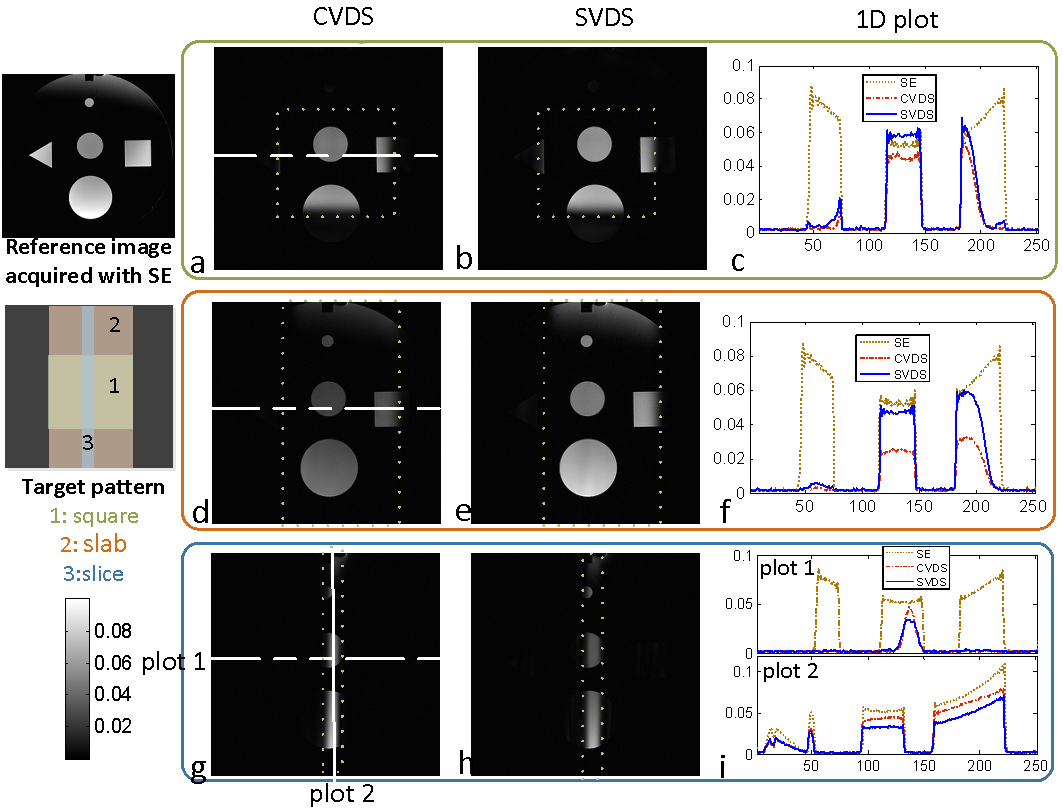
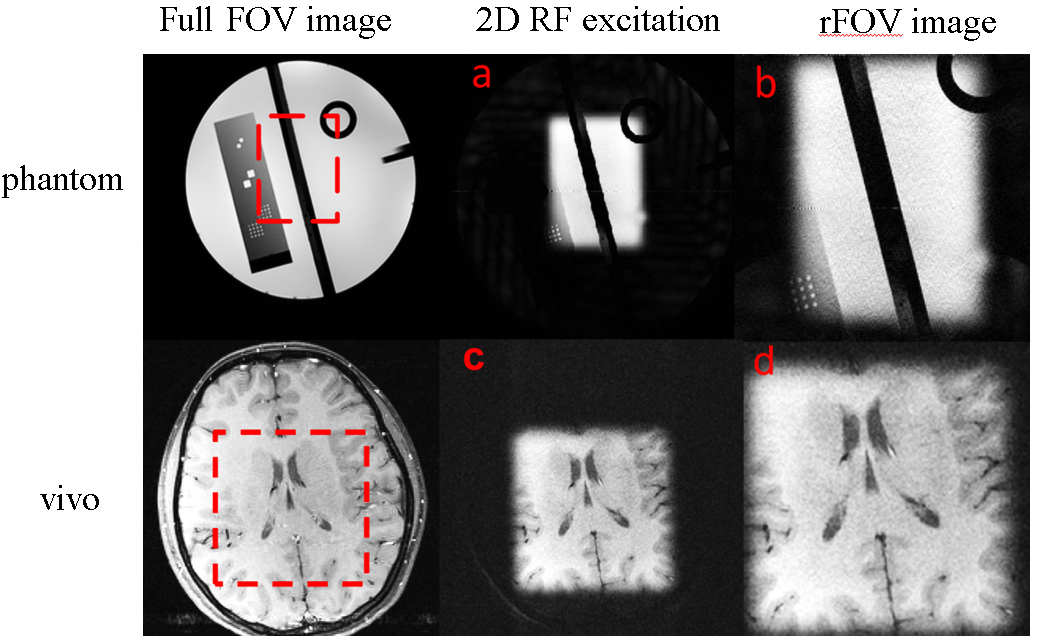
In Fig. 3, three types of patterns, square, slab and slice, were excited with CVDS and SVDS on a fixed maximum transmission voltage 200V as measured on the scanner. SVDS provides higher signal intensity level in square and slab excitation than CVDS. For the square excitation, SVDS shows a more uniform excitation profile than the referential SE image because the B1+ distributions have been involved in the SVDS RF pulse design. Fig. 4 shows the ability of SVDS to increase the imaging resolution by 4 times without prolonging the scan time.
Conclusion
A squeezed variable density spiral excitation k-space trajectory design method based on the target profile is proposed to reduce the SAR and peak RF amplitude in pTX multidimensional RF design. Results show substantial reduction in peak RF and SAR but minimal increase in NRMSE of the excitation profile and pulse duration.Acknowledgements
No acknowledgement found.References
1. Lee D, Grissom W A, Lustig M, et al. VERSE-guided numerical RF pulse design: A fast method for peak RF power control. Magnetic Resonance in Medicine, 2012, 67(2): 353-362.
2. Xu D, King K F, Liang Z, et al. Variable slew-rate spiral design: Theory and application to peak B1 amplitude reduction in 2D RF pulse design. Magnetic Resonance in Medicine, 2007, 58(4): 835-842.
3. Katscher, U., Börnert, P., Leussler, C, et al. Transmit SENSE. Magnetic Resonance in Medicine, 2003, 49: 144–150.
4. Civicioglu P. Backtracking Search Optimization Algorithm for numerical optimization problems. Applied Mathematics and Computation, 2013, 219(15): 8121-8144.
5. Grissom W A, Yip C, Zhang Z, et al. Spatial domain method for the design
of RF pulses in multicoil parallel excitation. Magnetic Resonance in
Medicine, 2006, 56(3): 620-629.
Figures