1326
Local SAR minimization of Turbo Spin-Echo sequences by Dynamic RF Shimming1UMC Utrecht, Utrecht, Netherlands, 2King's College London
Synopsis
Turbo Spin-Echo sequences (TSE) are frequently characterized by high local specific absorption rate (SAR), a limiting factor for their application. Here we show that the direct signal control (DSC) framework can drastically reduce the local SAR response of a TSE sequence by expanding the search-space for the amplitude and phase RF weights. A solution is found which enforces optimal contrast behavior and local SAR limits across different shim settings. A cardiac exam at 3 Tesla MRI is used as simulated test case.
Purpose and Introduction
Direct Signal Control (DSC) of turbo spin-echo sequences dynamically acts on the phase and amplitude settings of the transmit coil array achieving a correct tissue contrast even in the presence of strongly inhomogeneous radio-frequency fields[1]. The DSC is cast as an optimal control problem of the extended-phase-graph (EPG) model[2]. TSE sequences are frequently characterized by high local specific absorption rate (SAR), a limiting factor for their application. Here we show that the DSC framework can drastically reduce the local SAR response of a TSE sequence by expanding the search-space for the amplitude and phase RF weights. A solution is found which enforces optimal contrast behavior and local SAR limits across different shim settings. A cardiac exam at 3 Tesla MRI is used as simulated test case.Theory
The Optimal control DSC problem is outlined as:
$$ \begin{array}{rl}\mathbf{P}^{\text{opt}}=\arg\min&\|\mathbf{f}(\mathbf{P})-\mathbf{t}\|^2\\ \text{such that}&\sum_{j = 1}^J|p_{j,\ell}|^2\leq \pi_{\max},\quad\ell=1,\dots,L\\& |p_{j,\ell}|^2\leq \text{peak}^2_{\max},\quad \ell=1,\dots,L\quad\text{and }j=1,\dots J\end{array}$$
where $$$\mathbf{P}=(p_{j,\ell})$$$ contains all dynamic (complex) weighting terms. $$$\ell$$$ and $$$j$$$ denote, respectively, the channel and time indexes. $$$\mathbf{t}$$$ is the vector of target signal responses. $$$\mathbf{f}$$$ represents the signal responses of the SR-EPG model (i.e. the $$$F^+_0$$$ configuration state). Constraints on the maximum average power per channel, $$$\pi_{\max}$$$, and peak power are included.
To include the local SAR constraint, we assume that virtual-observation-points matrices $$$\mathbf{Q}_n$$$ are available[3].
Denoting by $$$b_j(t)$$$ the RF pulse waveform at the $$$j$$$-th excitation (these could be different for each excitation), the SAR for the $$$n$$$-th VOP over the whole TSE sequence is: SAR$$$_n=\sum_{j=1}^J\pi_j\mathbf{p}_j^H\mathbf{Q}_n\mathbf{p}_j$$$ where $$$\pi_j$$$ is the power of the $$$j$$$-th RF waveform (a fixed parameter) and $$$\mathbf{p}_j$$$ the corresponding RF weights. The local SAR can be calculated directly from the dynamic complex weights $$$\mathbf{P}$$$.
Expanding the original problem, we obtain the local-SAR optimized version:
$$ \begin{array}{rl}\mathbf{P}^{\text{opt}} =\arg\min&\|\mathbf{f}(\mathbf{P})-\mathbf{t}\|^2\\ \text{such that} & \sum_{j=1}^J|p_{j,\ell}|^2\leq\pi_{\max},\quad\ell=1,\dots,L\\& |p_{j,\ell}|^2\leq \text{peak}^2_{\max},\quad \ell=1,\dots,L\quad\text{and }j=1,\dots J\\ &\sum_{j=1}^J\pi_j\mathbf{p}_j^H\mathbf{Q}_n\mathbf{p}_j\leq \text{SAR}_{\max},\quad n=1,\dots,N.\end{array}$$
The derivatives of the SAR constraint are quickly calculated by the compact expressions:
$$ \begin{array}{ccc}\frac{\partial}{\partial\mathbf{p}_{m}^{R}}\sum_{j=1}^J\pi_j\mathbf{p}_j^H\mathbf{Q}_n\mathbf{p}_j&=&2\pi_j\left[(\mathbf{p}^R_m)^T\mathbf{Q}_n^R+(\mathbf{p}^I_m)^T\mathbf{Q}_n^I\right]\\ \frac{\partial}{\partial\mathbf{p}_{m}^{I}}\sum_{j=1}^J\pi_j\mathbf{p}_j^H\mathbf{Q}_n\mathbf{p}_j&=&2\pi_j\left[(\mathbf{p}^I_m)^T\mathbf{Q}_n^R-(\mathbf{p}^R_m)^T\mathbf{Q}_n^I\right] \end{array}$$
where $$$R$$$ and $$$I$$$ denote, respectively, the Real and Imaginary part of the variable: $$$\mathbf{p}_m=\mathbf{p}^R_m+\imath\mathbf{p}^I_m$$$ and $$$\mathbf{Q}_n=\mathbf{Q}^R_n+\imath\mathbf{Q}^I_n$$$.
Methods
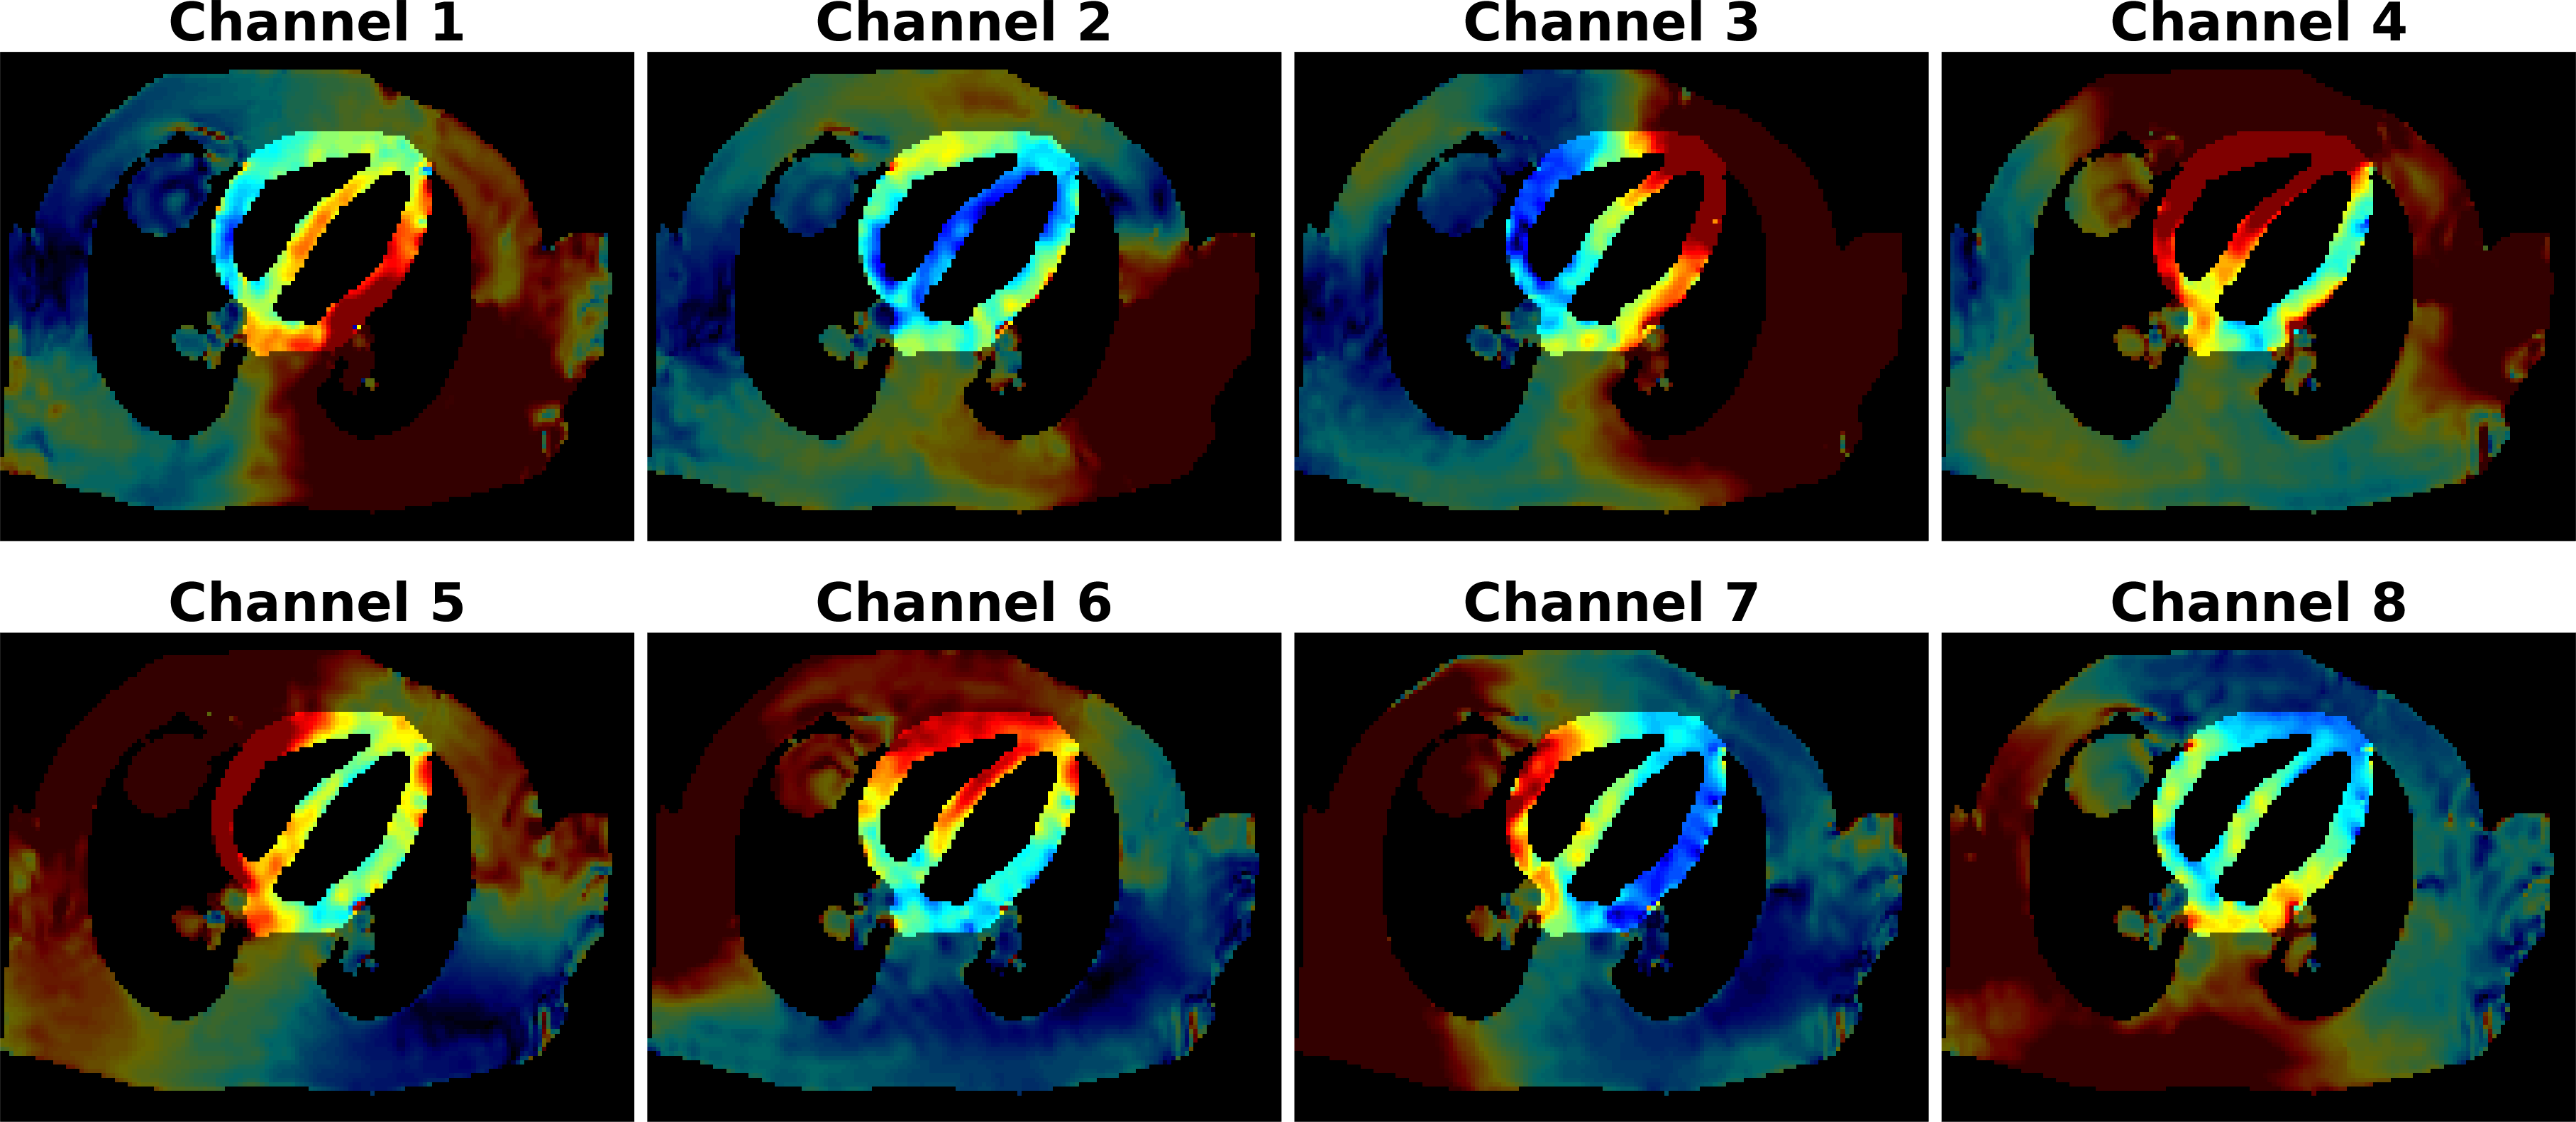
We consider a 2D cardiac TSE sequence at 3T with 16 echoes in the train. The target response corresponds to a standard 90$$$^o$$$-180$$$^o$$$ scheme. $$$(T_E,T_R)=(5.9,1060)$$$ms. An 8 Tx channel coil[4] is employed. The measured transmit fields[5] are shown in Fig.1. The NORMAN model[6] was employed for SAR calculations, which is compressed to 419 VOPs.
The DSC design algorithm is run for three configurations:
1) 1W/Kg maximum local SAR,
2) 2W/Kg maximum local SAR,
3) without local SAR constraints.
These configurations are all constrained by average and peak power per channel.In addition, we report also the obtained SAR and signal response for the quadrature-mode excitation.
The DSC problem is implemented in Matlab on a desktop PC. Exact derivatives are calculated as in [2] and as outlined in the previous paragraph.
Results
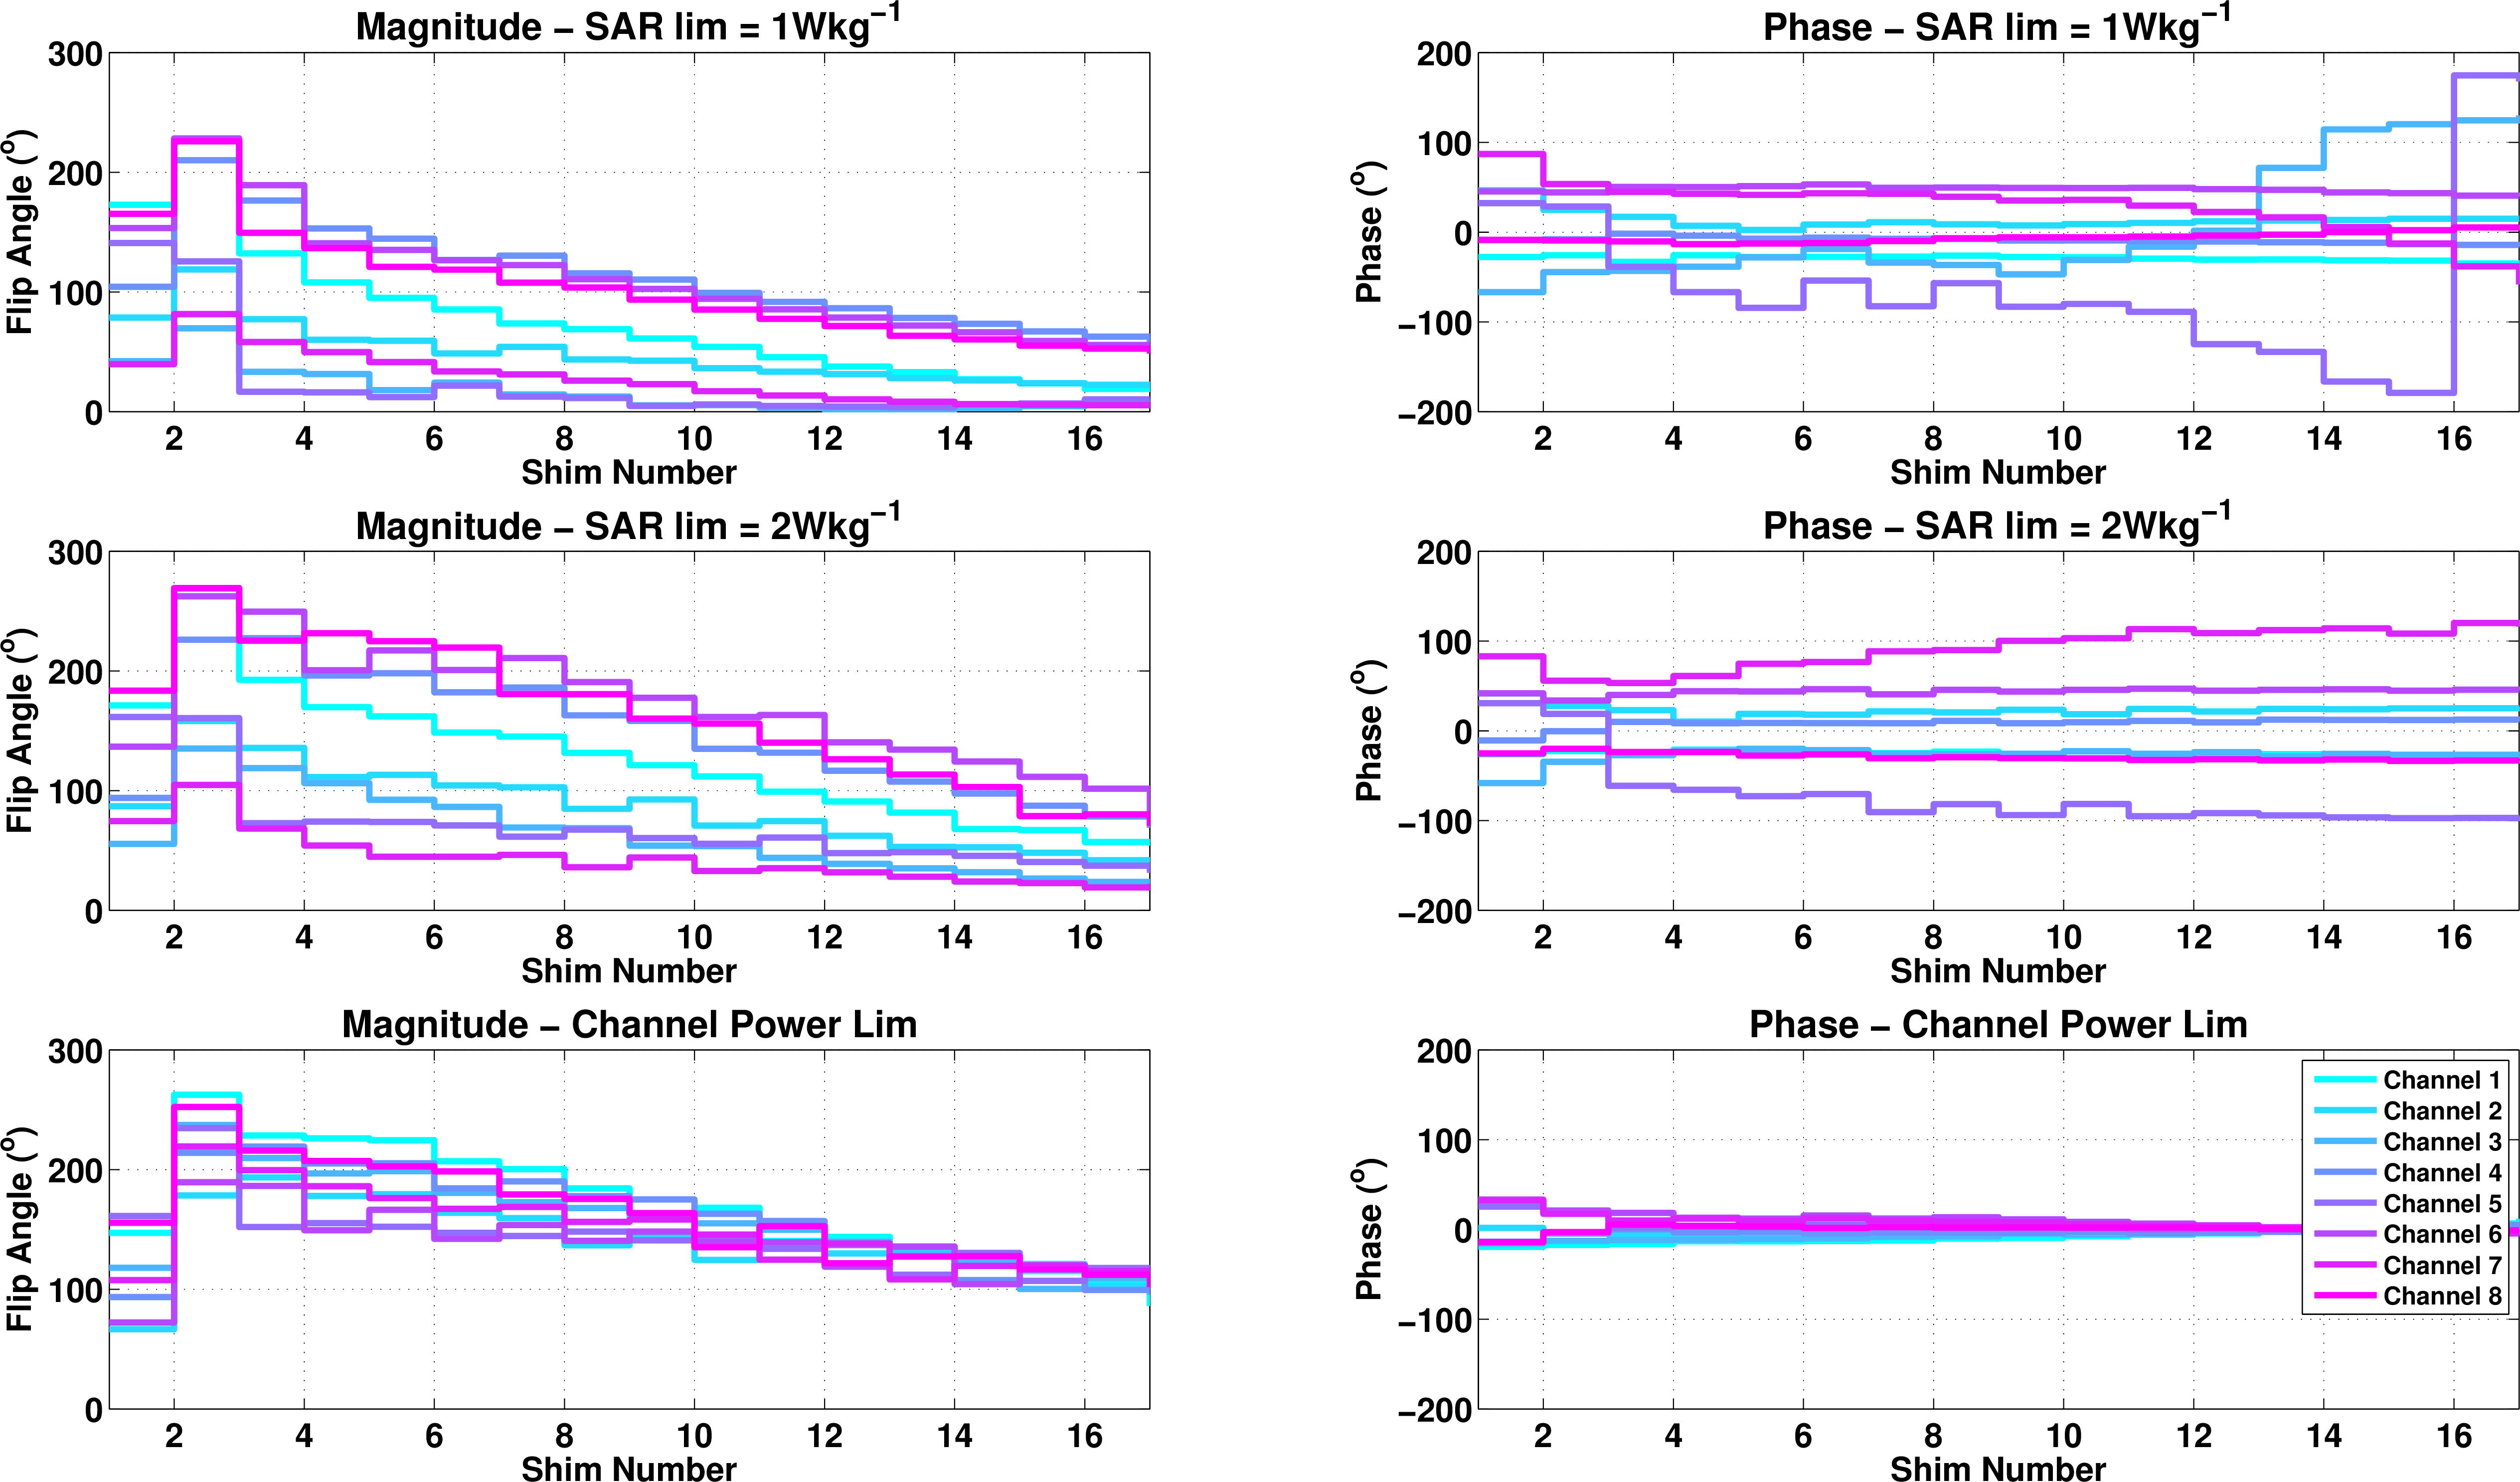
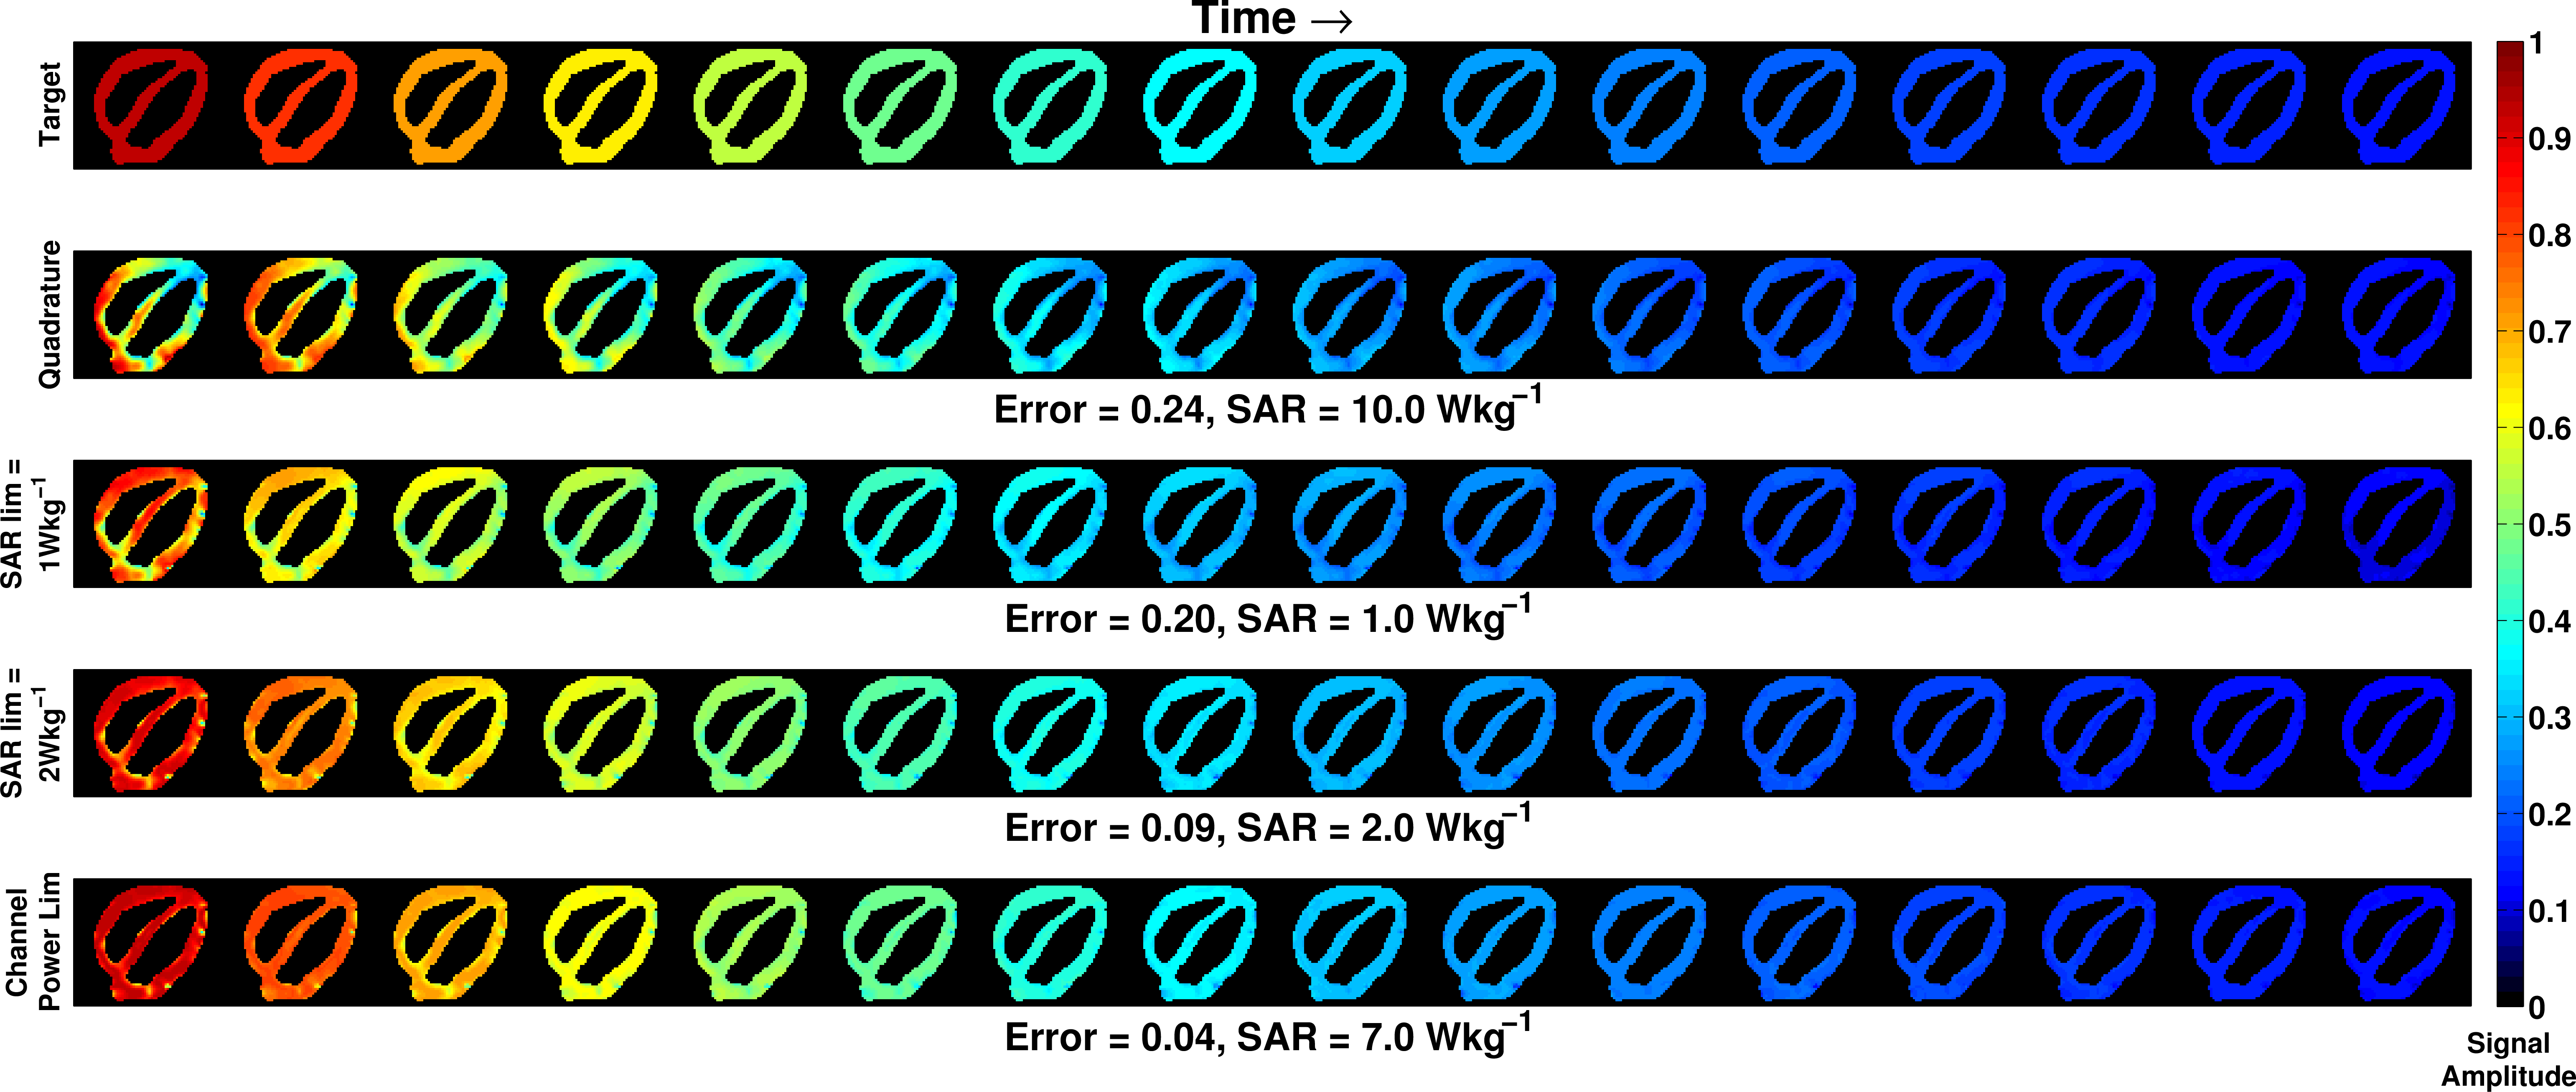
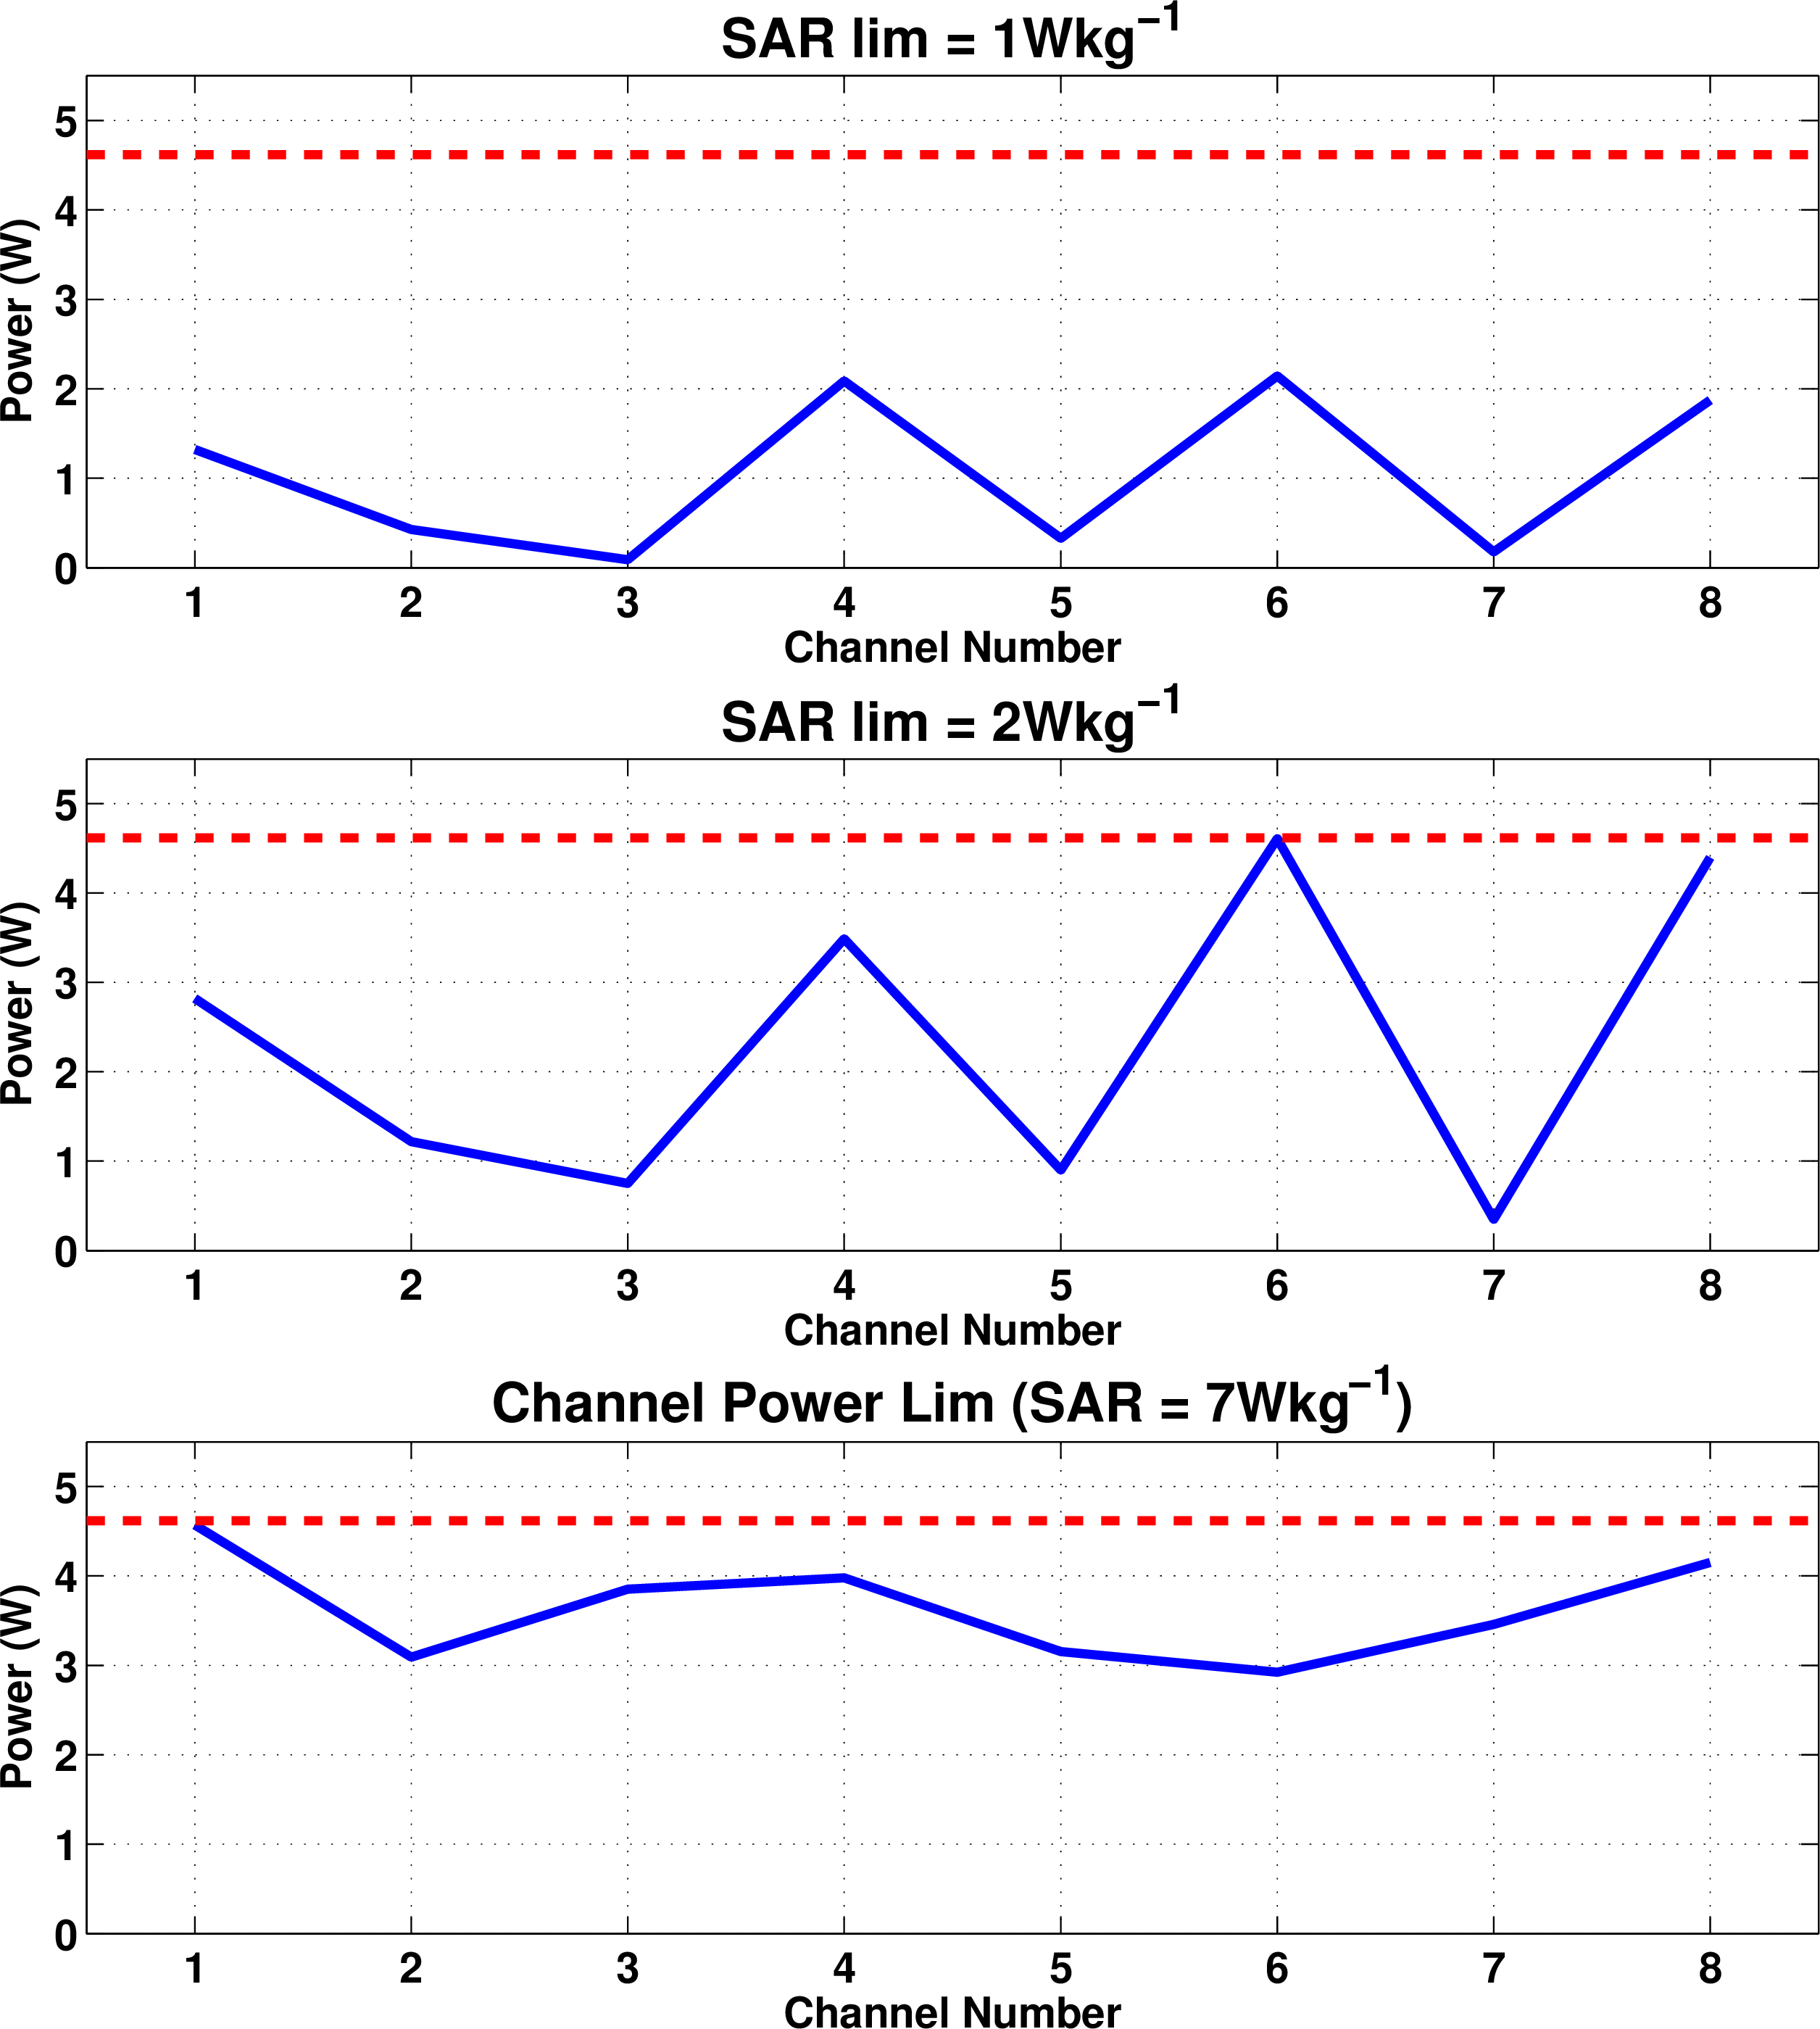
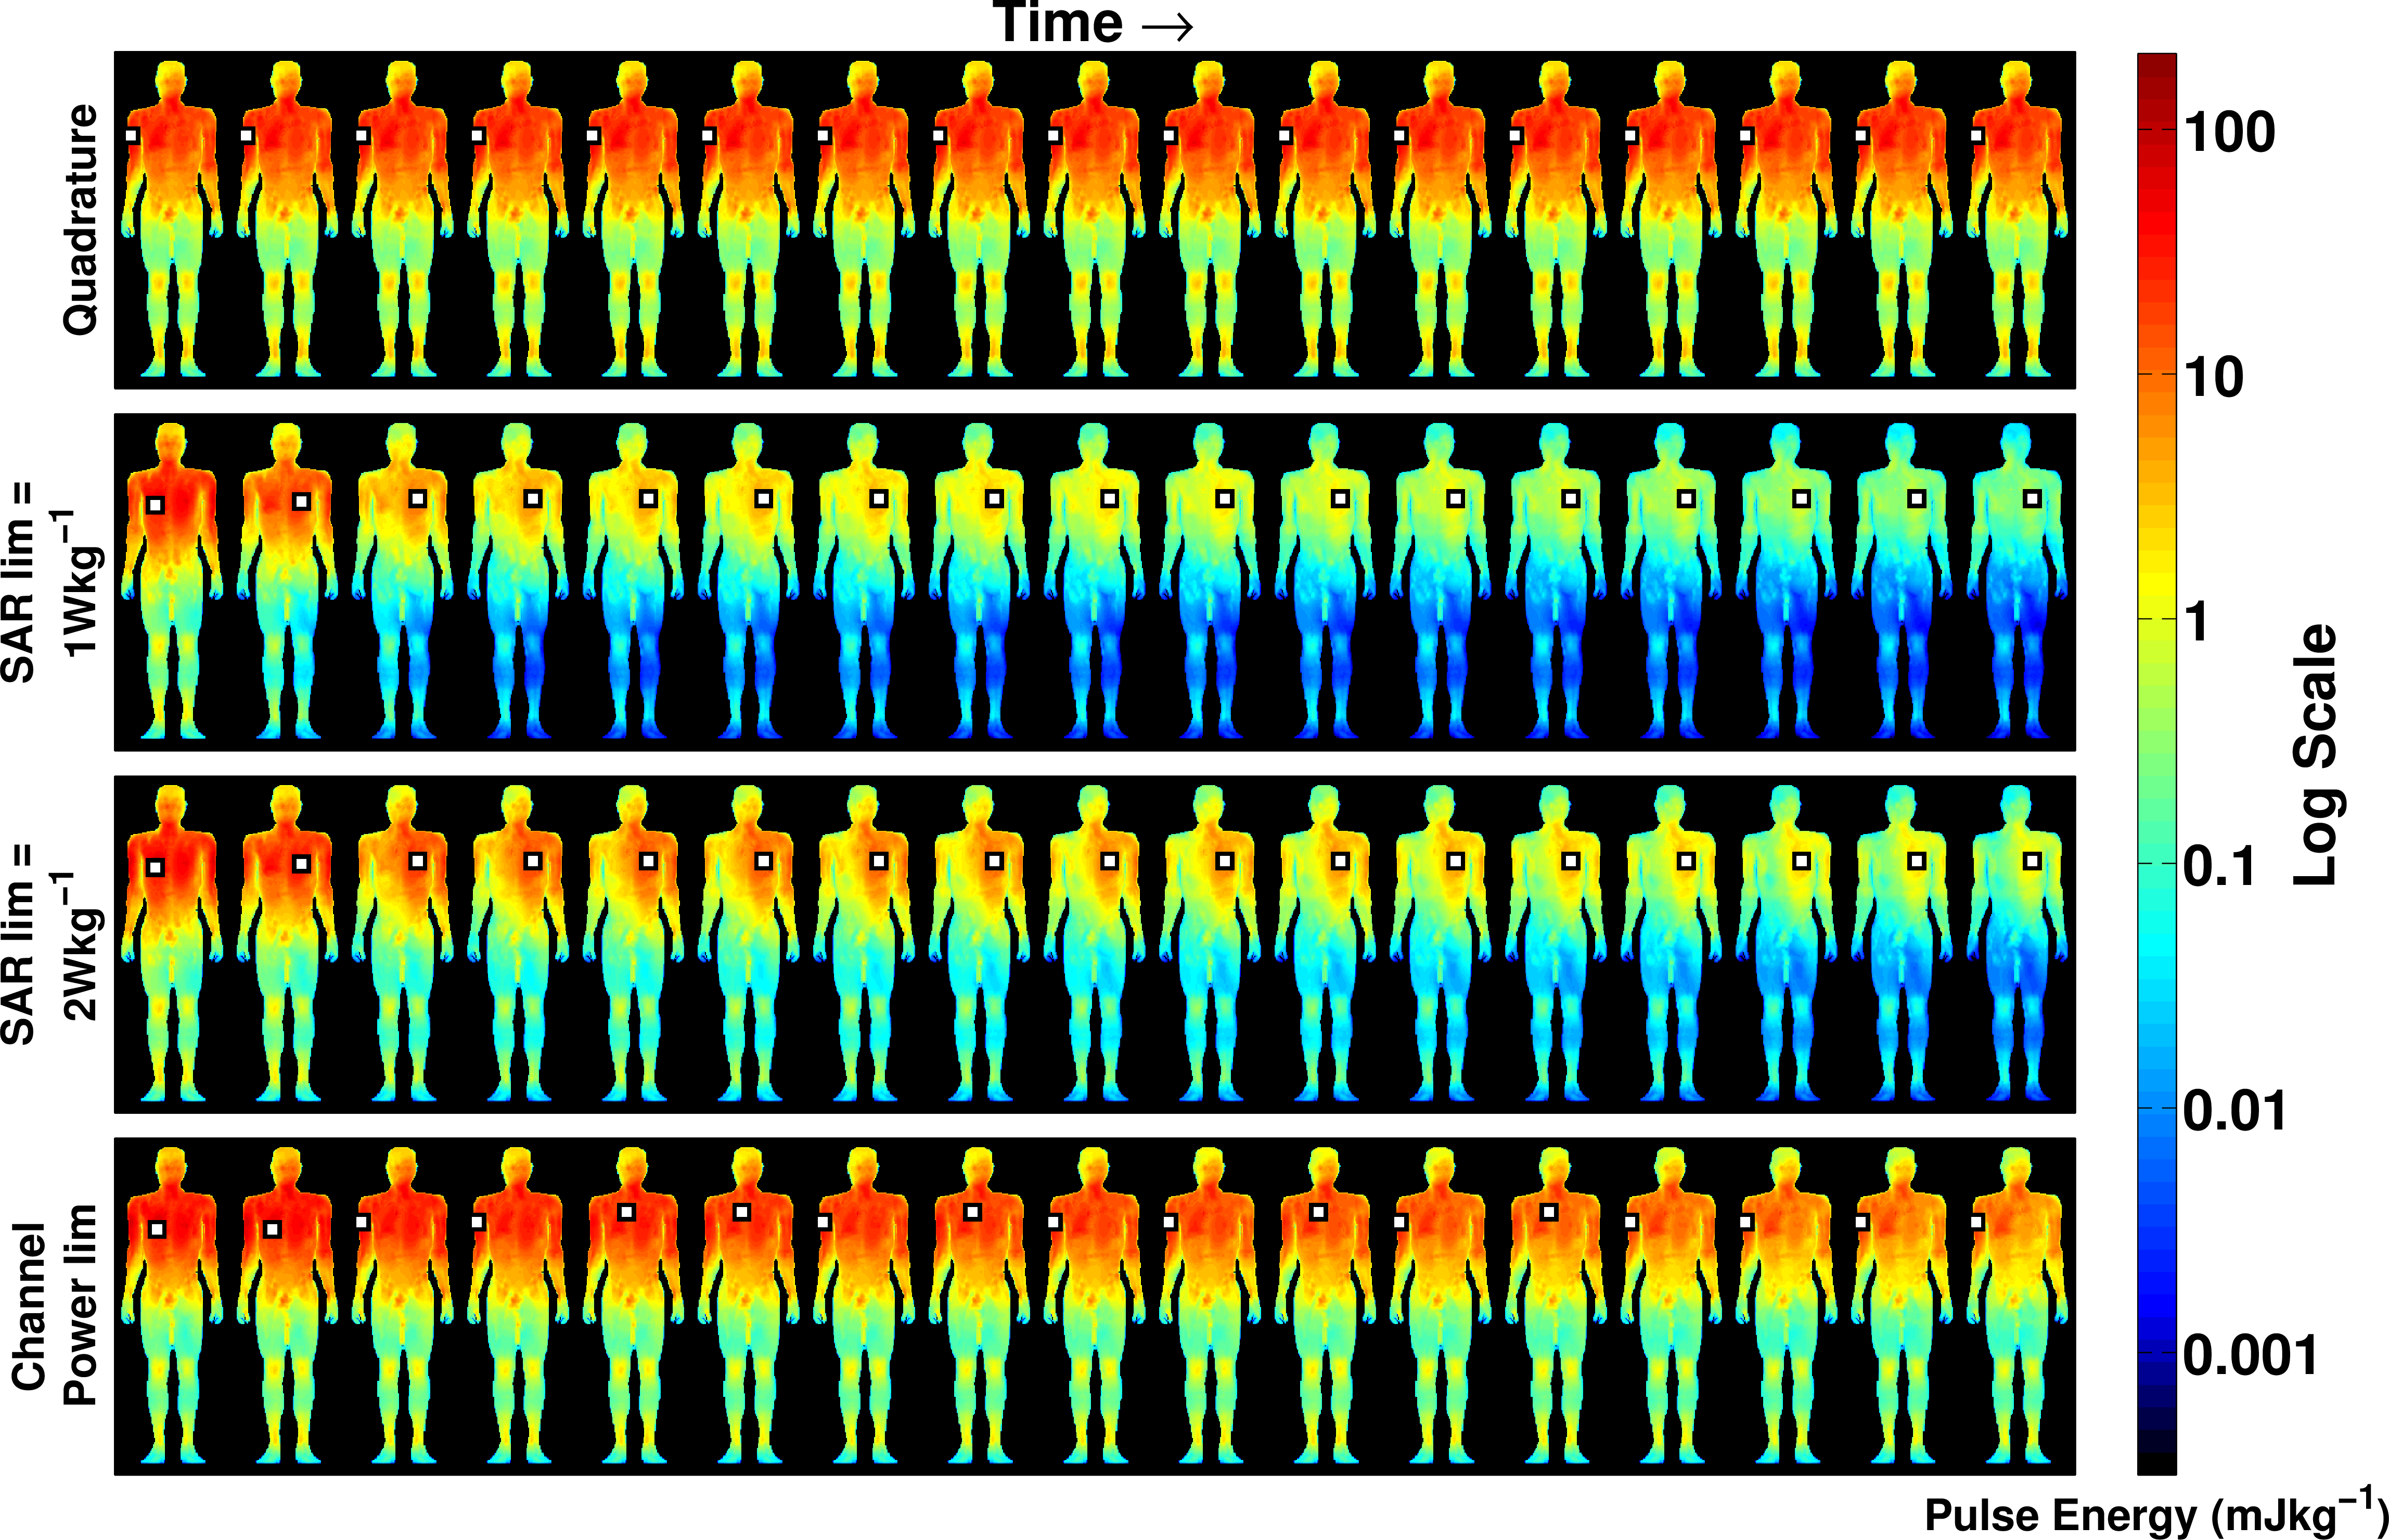
The DSC optimized RF amplitude and phase settings are shown in Fig.2. The computation times vary between 20 and 50 seconds. The signal throughout all echoes is shown in Fig.3. The normalized root-mean-squared error and peak local SAR values are also reported. Note that the local-SAR constrained DSC sequences drastically reduce the SAR and simultaneously improve the excitation. The power per channel values are given in Fig.4 and show low power demand for the SAR-constrained sequences. Finally, the energy distributions obtained during the sequence are shown in Fig.5. The white box indicates the location of the maximum local-SAR (hot-spot). In all of the DSC optimizations, the position of the hot-spot varies throughout the echo train, a consequence of the dynamic shimming obtained by DSC. The SAR-constrained solutions move the deposited energy maxima from right to left side of the body over the course of the echo train, forcing destructive interference of electric fields. The SAR-unconstrained DSC optimization resulted in SAR=7W/kg, which was less than quadrature but much higher than specifically SAR-optimized DSC solutions.Discussion and Conclusion
We extended the optimal control DSC framework to enable application of TSE sequences which would otherwise be hampered by high local-SAR. The DSC approach enhances local-SAR reduction by dynamically acting on the RF settings across the whole sequence. The search space is expanded and a solution can be found which simultaneously achieves low SAR and an accurate signal response. In this work, a single-slice TSE sequence with TR=1s was defined with SAR=10W/kg when using quadrature excitation. By using the proposed approach with a limit of 1W/kg it would hence be possible to fit in 10 slices per TR using a multislice acquisition, giving a large potential increase in speed.Acknowledgements
The present research was funded by the following grants:
Dutch Technology Foundation (STW) Grant 14125
EPSRC (UK research councils) grant number EP/L00531X/1
References
[1] Malik, S. J., Beqiri, A., Padormo, F. and Hajnal, J. V. (2015), Direct signal control of the steady-state response of 3D-FSE sequences. Magn Reson Med, 73: 951-963. doi: 10.1002/mrm.25192
[2] Sbrizzi A, Hoogduin H, Hajnal JV, van den Berg CA, Luijten PR, Malik SJ. Optimal control design of turbo spin-echo sequences with applications to parallel-transmit systems. Magnetic resonance in medicine. 2016 Jan 1.
[3] Eichfelder G, Gebhardt M. Local specific absorption rate control for parallel transmission by virtual observation points. Magnetic resonance in medicine. 2011 Nov 1;66(5):1468-76.
[4] Vernickel P, Roeschmann P, Findeklee C, Luedeke K-M, Leussler C, Overweg J, Katscher U, Graesslin I, Schuenemann K. Eight-channel transmit/receive body MRI coil at 3T. Magn. Reson. Med. 2007;58:381-9.
[5] Nehrke K, Boernert P. DREAM-a novel approach for robust, ultrafast, multislice B1 mapping. Magnetic resonance in medicine. 2012 Nov 1;68(5):1517-26.
[6] Dimbylow PJ. FDTD calculations of the whole-body averaged SAR in an anatomically realistic voxel model of the human body from 1 MHz to 1 GHz. Phys. Med. Biol. 1997;42:479-490.
Figures